Effect of Feed Protein and Carbohydrate Levels on Feed Intake, Growth, and Gonad Production of the Sea Urchin, Lytechinus variegatus
Abstract
In this study, we evaluated protein and carbohydrate levels in cold-extruded dry diets. Sea urchins (12.6 ± 0.12 SE g wet weight, 29.5 ± 0.11 SE mm diameter) were collected from St. Joseph Bay, Florida (30°N, 85.5°W), and transported to the Texas Agrilife Research Mariculture Laboratory in Port Aransas, Texas. Urchins were held individually in replicated enclosures within a recirculating seawater system (32 ± 2 ppt and 22 ± 2 C). Urchins (n = 16urchins) were fed diets that differed in protein : carbohydrate levels (31:33%, 25:39%, 21:44%, and 17:47% dry weight) for 12-wk. Survival was 100% in all diet treatments. Urchins fed the 31:33% protein : carbohydrate diet consumed less feed, more dry protein, less dry carbohydrate, less energy, and had lower feed conversion ratios than urchins fed other diets. Urchins fed the 31:33% protein : carbohydrate diet had larger test diameters, total wet weights, production efficiencies, and gonad production efficiencies than urchins in the other diets. Weight gain varied directly and significantly with protein intake. Sufficient energy was available for maximum weight gain as protein was spared. Growth rates and production efficiencies for the urchins in this study were higher than in previous feeding studies with adult Lytechinus variegatus.
The overfishing of natural sea urchin stocks and the associated ecological impacts, coupled with the increasing demand for the sea urchin gonad (uni or roe), have stimulated research directed at the development of sea urchin aquaculture (Lawrence et al. 2001; Pearce et al. 2002; Robinson 2004; Lawrence 2007). Before sea urchin aquaculture can be feasible, cost effective, high quality feeds must be commercially available to promote rapid somatic growth and marketable roe production (Pearce et al. 2002; Lawrence and Lawrence 2004).
Sea urchin aquaculture (egg to marketable adult) has not been commercialized in any sea urchin species. Most emphasis has been on early life-stage aquaculture with subsequent stock enhancement of juveniles into natural populations, particularly in Japan (Agatsuma et al. 2004). Adult life-stage aquaculture may involve collecting wild populations when roe quantity or quality is minimal, and culturing (feedlot) urchins, either on- or offshore, in preparation for market. Roe enhancement techniques for collected wild stocks would benefit communities with seasonal fisheries, and lead the way for development of full life-cycle aquaculture.
Dietary protein is an important macronutrient that provides essential amino acids and energy for maintenance, growth, and reproduction in animals (Morris 1991). Since protein is one of the most costly nutrients in aquaculture feeds it is important to determine the dietary protein requirements for optimum growth. Carbohydrate oxidation is the primary source of energy for all herbivorous and many omnivorous animals (Morris 1991), and knowledge of carbohydrate utilization is essential to the development of cost-effective feeds. Furthermore, energy must be supplied in sufficient amounts to spare protein from catabolism so that it is used only for tissue synthesis (Cuzon and Guillaume 1997).
Many nutritional studies with sea urchins have used natural feeds or natural feed components (Lawrence et al. 2007). These studies are important because they provide insight into the dietary requirements of sea urchins (Watts et al. 2010). However, these feeds cannot be conveniently stored, may spoil rapidly, can be difficult to proffer, and are inconsistent in quality. The advantages of formulated dry diets versus natural feeds are summarized by Lawrence and Lawrence (2004). Moist semi-purified or purified diets can be used to determine specific dietary nutrient requirements, but are not feasible as a feed for commercial production of sea urchin roe because they are not cost effective.
In this study, a cold-extruded feed pellet composed of purified and practical ingredients with low moisture content (7–9% moisture) was used. These semi-purified feeds are similar in physical characteristics and nutrient values to commercial aquaculture feeds. The purpose of this study is to evaluate the effect of protein and carbohydrate levels in extruded feeds on growth and gonad production in Lytechinus variegatus. The ability to rapidly enhance somatic and roe production in wild-caught urchins using a formulated diet has implications for improving utilization and value of natural stocks of adult urchins.
Materials and Methods
Collection, Culture, and Initial Measurements
Lytechinus variegatus were collected in October 2004, from Port St. Joseph Peninsula State Park, Florida (30°N, 85.5°W), and transported to the Texas Agrilife Research Mariculture Laboratory in Port Aransas, Texas. At the time of collection, gonads of individuals in wild populations are minimal in size (Cunningham 2008). Sea urchins were held for 1 mo in 750 L tanks at approximately 32 ± 2 ppt salinity and 23 ± 1 C. Natural seawater was filtered to 0.5 µm using stratified sand filtration, a Diamond water filter (Diamond Water Conditioning, Horton, WI, USA), and then piped to the culture tanks under flow-through conditions. During this period sea urchins were fed a maintenance ration (ca. once every 3 d) of a formulated diet (31:33% protein : carbohydrate diet; Table 1).
| Ingredient | Protein : carbohydrate levels | |||
|---|---|---|---|---|
| 31:33 | 25:39 | 21:44 | 17:47 | |
| Crude protein (%)1 | 30.86 | 24.80 | 20.73 | 17 |
| Carbohydrate (%)1 | 32.62 | 35.50 | 40.05 | 47.43 |
| Crude fiber (%)1 | 2.50 | 2.50 | 2.50 | 2.47 |
| Crude fat (%)1 | 7.52 | 7.52 | 7.52 | 7.52 |
| Total ash (%)1 | 23.52 | 23.52 | 23.52 | 23.18 |
| Moisture (%)1 | 9.35 | 7.95 | 7.03 | 9.16 |
| Carotenoid (%) | 0.42 | 0.42 | 0.42 | 0.42 |
| Cholesterol (%) | 0.22 | 0.22 | 0.22 | 0.22 |
| Calcium (%)1 | 2.35 | 2.35 | 2.35 | 2.35 |
| Phosphorous (%)1 | 1.89 | 1.89 | 1.89 | 1.89 |
| Sodium (%) | 1.29 | 1.29 | 1.29 | 1.29 |
| Potassium (%) | 1.63 | 1.63 | 1.63 | 1.63 |
| Magnesium (%) | 0.39 | 0.39 | 0.39 | 0.39 |
| Iron (ppm) | 319 | 319 | 319 | 319 |
| Zinc (ppm) | 91 | 91 | 91 | 91 |
| Manganese (ppm) | 71 | 71 | 71 | 71 |
| Copper (ppm) | 47 | 47 | 47 | 47 |
| Selenium (ppm) | 0.228 | 0.228 | 0.228 | 0.228 |
| Arginine (%) | 2.15 | 2.15 | 2.15 | 2.15 |
| Histidine (%) | 0.62 | 0.62 | 0.62 | 0.62 |
| Isoleucine (%) | 1.12 | 1.12 | 1.12 | 1.12 |
| Leucine (%) | 2.00 | 2.00 | 2.00 | 2.00 |
| Lysine (%) | 1.69 | 1.69 | 1.69 | 1.69 |
| Methionine (%) | 0.49 | 0.49 | 0.49 | 0.49 |
| Cystine (%) | 0.27 | 0.27 | 0.27 | 0.27 |
| Phenylalanine (%) | 1.29 | 1.29 | 1.29 | 1.29 |
| Tyrosine (%) | 0.96 | 0.96 | 0.96 | 0.96 |
| Threonine (%) | 1.05 | 1.05 | 1.05 | 1.05 |
| Tryptophan (%) | 0.26 | 0.26 | 0.26 | 0.26 |
| Valine (%) | 1.19 | 1.19 | 1.19 | 1.19 |
| Vitamin A (IU) | 4800 | 4800 | 4800 | 4800 |
| Vitamin D (IU) | 3000 | 3000 | 3000 | 3000 |
| Vitamin E (ppm) | 240 | 240 | 240 | 240 |
| Vitamin C (ppm) | 349 | 349 | 349 | 349 |
| Thiamine (ppm) | 36 | 36 | 36 | 36 |
| Riboflavin (ppm) | 48 | 48 | 48 | 48 |
| Pyridoxine (ppm) | 96 | 96 | 96 | 96 |
| Niacine (ppm) | 96 | 96 | 96 | 96 |
| Pantothenic acid (ppm) | 36 | 36 | 36 | 36 |
| Biotin (ppm) | 1 | 1 | 1 | 1 |
| Inositol (%) | 0.10 | 0.10 | 0.10 | 0.10 |
| Choline (%) | 0.10 | 0.10 | 0.10 | 0.10 |
| Folic acid (ppm) | 24 | 24 | 24 | 24 |
| Vitamin B12 (ppm) | 0.2 | 0.2 | 0.2 | 0.2 |
| Protein : energy ratio (mg protein/Kcal) | 80.79 | 65.96 | 56.49 | 47.09 |
| Energy (Kcal/g)1 | 3.82 | 3.76 | 3.67 | 3.61 |
- 1The values were based on dry weight and derived empirically (Eurofins Scientific, Inc). Energy was determined by bomb calorimetry (Parr Instrument Co.).
To stock the experimental systems, L. variegatus (12.6 ± 0.12 g wet weight, 29.5 ± 0.11 mm test diameter, n = 64) were haphazardly selected, blotted dry with a paper towel to remove excess water, and weighed to the nearest mg with a Mettler balance (Mettler Toledo Scales, Dublin, OH, USA). Test diameters were measured at two perpendicular points across the ambitus using calipers and the mean test diameter was calculated. Sixteen individuals were weighed as described above, and dissected into the body compartments (test and spines, Aristotle's lantern, gut, gonads) to characterize the state of the sea urchins at the beginning of the experiment. For dissection, sea urchins were cut through the peristomial membrane on the oral surface. The gut (esophagus, stomach, and intestine) was rinsed in sea water to remove gut contents. Each organ was blotted with a paper towel to remove excess water and weighed to the nearest mg. Organs were placed in aluminum pans, dried to constant weight at 60 C, and reweighed. At the end of the study sea urchins from each of the diet treatments were weighed and dissected as described above.
For the diet trials, sea urchins were placed individually into a cylindrical enclosure. The cylindrical enclosures were made from a plastic mesh (ca. 12 cm diameter, 30 cm high, and a 4-mm open mesh) secured by plastic cable ties. The mesh enclosures were fitted into 11.5 cm internal diameter PVC couplings so that the floors of the cylindrical enclosures were approximately 5.5 cm above the bottom of the tank. Small plastic spacers (ca. 0.5 cm thick) were then placed under the bottom of each coupling to allow water circulation underneath the enclosures. Four cylindrical enclosures were placed into a 0.07-m2 bottom surface fiberglass tank with 20 L water volume. Water volume was held constant by a central standpipe below the top of the enclosures to prevent escape. Seawater was supplied to each enclosure approximately at a rate of 25 L/h. Each diet treatment was comprised of four fiberglass tanks containing four cages per tank (n = 16 individuals per diet treatment, assigned haphazardly). The fiberglass tanks were connected to a temperature-controlled semi-recirculating aquaculture system with mechanical and biological filtration, foam fractionation, and UV sterilization. Seawater was exchanged in the semi-recirculating systems at an approximate rate of 10% volume/d.
Culture conditions were checked daily to maintain constant conditions (32 ± 2 ppt salinity, 22 ± 2 C, and 7 ± 2 ppm dissolved oxygen). Photoperiod was 12 h : 12 h light : dark. Ammonia, nitrite, nitrate, and pH levels were checked weekly and were maintained at or below the following concentrations: ammonia 0.1 ± 0.05 ppm, nitrite 0.1 ± 0.05 ppm, nitrate 5 ± 2 ppm, and pH 8 ± 0.3.
Feeds and Feed Preparation
Four semi-purified diets (Table 1) that varied only in levels of protein and carbohydrate (31:33%, 25:39%, 21:44%, and 17:47% protein : carbohydrate diets; to be referred to as 31:33, 25:39, 21:44, and 17:47) were prepared from semi-purified and purified ingredients (ca. 28% marine source ingredients, 34.6% plant source ingredients, 7.5% crude fat, 1.1% carotenoids, 0.7% vitamin premix, 17.9% mineral premix, 10.2% binder-antifungal-antioxidant; Table 1). Protein and carbohydrate levels were adjusted by adding different levels of soy protein isolate (Zeigler Bros. Inc., Gardeners, PA, USA) and pure wheat starch (MP Biomedical, Solon, OH, USA). All other ingredient levels remained constant (Table 1). Dry ingredients were blended with a twin shell dry blender (Patterson-Kelley Co., East Stroudsburg, PA, USA) for 10 min, and mixed in a Hobart mixer (Model A-200, Hobart Corporation, Troy, OH, USA) for 40 min. Deionized water (500 mL/kg) was then added to the dry ingredients and mixed an additional 10 min to achieve a mash consistency appropriate for extrusion. The mash was extruded through a meat chopper attachment (Model A-200, Hobart Corporation) fitted with a 4.8-mm die. Moist feed strands were dried on wire racks in a forced air oven at 35 C to a moisture content of 8–10%, placed into plastic bags and stored in a refrigerator at 4 C until used.
Proximate analysis of the diets (Table 1) was performed by Eurofins Scientific Inc., Des Moines, IA, USA. Energy content was determined by microbomb calorimetry (Parr Instrument Company, Moline, IL, USA).
Feed Intake
Growth
Dry Matter Production and Production Efficiency
Statistics
Statistical comparisons for feed intake, protein intake, test diameter, and wet weight at 4, 8, and 12 wk were completed using SAS (version 9.1). These parameters were analyzed as the dependent variable in a repeated measures model with feed protein level as the predictor. The PROC MIXED procedure (SAS) was a general linear model used to analyze the relationship between each parameter and time accounting for group differences. Group means in 4-wk increments were compared using the Tukey's adjustment. Treatment tanks were arranged in a block design; however, tank effects among replicate block tanks were not found to be significant and each individual held within an enclosure was considered to be an independent observation. Statistical comparisons for feed consumption and protein consumption were performed on the Systat 11 software package (Systat Software Inc., Point Richmond, CA, USA). All other statistical comparisons were performed on the Systat 11 software package. If organ growth, production, and production efficiency data were normally distributed and were homoscedastic, parametric tests including ANOVA and ANCOVA were completed. ANCOVA was used when necessary to eliminate confounding effects of animal size for organ analyses. When significant differences were determined, a Tukey's test for pairwise group comparisons was used. A P value of <0.05 was determined statistically significant for all parametric tests. If these data were non-normally distributed or heteroscedastic, data transformations were attempted. If data transformations were not successful, nonparametric tests (Kruskal–Wallis, Mann–Whitney U, or Kolmogorov–Smirnov two-way tests) were employed. To maintain an overall acceptance criterion of α = 0.05 during multiple comparisons, a Bonferroni's adjustment was adopted for all nonparametric analyses.
Results
Water quality remained within optimal levels for sea urchins (Basuyaux and Mathieu 1999) during the 12-wk study and was assumed not to be a factor affecting growth and efficiency parameters. This is verified by the high survival, growth, and production values obtained in this study.
Survival
Survival was 100% in all feed treatments for the entire 12-wk study.
Feed Intake
The predictive model from The Mixed Procedure indicated there was an overall significant time effect, group (diet) × time effect, but not a significant group effect for total feed intake (Table 2A). Total feed intake was not different among the diet treatments at Week 4 (Table 2B and Fig. 1A). At Week 8, sea urchins fed the 31:33% diet consumed significantly less food than those fed the 17:47% or 21:44% but not the 25:39% diet. At Week 12, sea urchins fed the 31:33% diet consumed significantly less food (14.9 g) than urchins fed the 17:47%, 21:44%, or 25:39% diets (18.3, 18.2, and 16.9 g, respectively).
| Type 3 tests of fixed effects | ||
|---|---|---|
| Effect | F value | P |
| Total feed intake (g) | ||
| Protein | 2.61 | 0.063 |
| Weeks | 18.11 | <0.001 |
| Weeks × protein | 8.12 | <0.001 |
| Total dry protein intake (g) | ||
| Protein | 0.87 | 0.463 |
| Weeks | 18.08 | <0.001 |
| Weeks × protein | 8.57 | <0.001 |
| Energy intake (Kcal) | ||
| Protein | 19.43 | <0.001 |
| Weeks | 2066.04 | <0.001 |
| Weeks × protein | 5.91 | <0.001 |
- 1The PROC MIXED procedure was used to analyze the relationship between average feed intake and time accounting for group differences. The group means at various points were compared using the Tukey's adjustment. The significance was determined for the entire 12-wk study (overall) and for each 4-wk period following the start of the study.
| Parameter | Week | Dietary protein : carbohydrate | |||||
|---|---|---|---|---|---|---|---|
| 17:47 vs. 21:44 | 17:47 vs. 25:39 | 17:47 vs. 31:33 | 21:44 vs. 25:39 | 21:44 vs. 31:33 | 25:39 vs. 31:33 | ||
| Total dry food intake (g) | 4 | 1.000 | 1.000 | 0.876 | 0.999 | 0.893 | 0.870 |
| 8 | 0.999 | 0.196 | 0.002 | 0.241 | 0.002 | 0.228 | |
| 12 | 0.997 | 0.057 | <0.001 | 0.088 | <0.001 | 0.009 | |
| Total dry protein intake (g) | 4 | 0.675 | 0.106 | <0.001 | 0.628 | 0.003 | 0.068 |
| 8 | <0.001 | <0.001 | <0.001 | 0.003 | <0.001 | <0.001 | |
| 12 | <0.001 | <0.001 | <0.001 | <0.001 | <0.001 | 0.007 | |
| Energy intake (Kcal) | 4 | 0.995 | 0.974 | 0.670 | 0.998 | 0.812 | 0.894 |
| 8 | 0.838 | 1.000 | 0.124 | 0.826 | 0.018 | 0.131 | |
| 12 | 0.842 | 0.963 | <0.001 | 0.563 | <0.001 | 0.004 | |
- 1The PROC MIXED procedure was used to analyze the relationship between average feed intake and time accounting for group differences. The group means at various points were compared using the Tukey's adjustment. The significance was determined for the entire 12-wk study (overall) and for each 4-wk period following the start of the study.
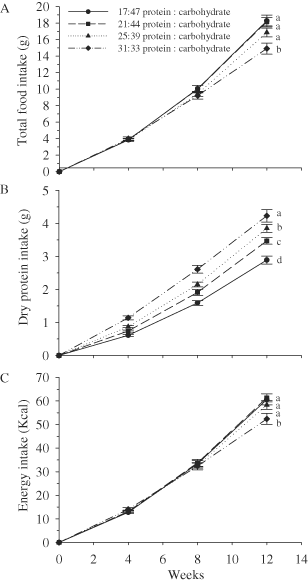
(A) Total food intake, (B) total protein intake, and (C) total energy intake among sea urchins fed four different protein : carbohydrate feeds. Values represent mean±SE. Letters indicate significant differences among diets.
The predictive model from The Mixed Procedure indicated an overall significant time effect, group × time effect, but not a significant group effect for the total dry protein intake (Table 2A). Sea urchins fed the 31:33% diet consumed significantly more dry protein than sea urchins fed the 17:47% and 21:44% diets but not the 25:39% diet at Week 4 (Table 2B and Fig. 1B). At Week 8 the dry protein intake was significantly different among all the treatments and remained different among treatments for the duration of the study.
The predictive model from The Mixed Procedure indicated an overall significant group effect, time effect, and group × time effect for energy intake (Table 2A). There was no significant difference in energy intake among the diet treatments at Week 4 or 8 (Table 2B and Fig. 1C). At Week 12, energy intake was significantly less in urchins fed the 31:33% diet but was not different among the other diet treatments.
Growth
The predictive model from The Mixed Procedure indicated an overall significant group effect, time effect, and group × time effect for test diameter (Table 3A). Sea urchins fed the 17:47% diet had a significantly smaller test diameter (31.9 mm) than urchins fed the 31:33% (33.2 mm) or 25:39% diets (33.1 mm) but not the 21:44% diet (32.8 mm) at Week 4 (Table 3B and Fig. 2A). At Weeks 8 and 12, sea urchins fed the 31:33% diet had a significantly larger test diameter than urchins fed the 17:47% or 21:44% diets but not the 25:39% diet (Table 3B and Fig. 2A).
| Type 3 tests of fixed effects | ||
|---|---|---|
| Effect | F value | P |
| Test diameter | ||
| Protein | 294.86 | <0.001 |
| Weeks | 71.95 | <0.001 |
| Weeks × protein | 6.71 | <0.001 |
| Wet weight | ||
| Protein | 0.22 | 0.884 |
| Weeks | 52.47 | <0.001 |
| Weeks × protein | 10.21 | <0.001 |
- 1The PROC MIXED procedure was used to analyze the relationship between average consumption and time accounting for group differences. The group means at various points were compared using the Tukey's adjustment. The significance was determined for the entire 12-wk study (overall) and for each 4-wk period following the start of the study.
| Parameter | Weeks | Dietary protein : carbohydrate | |||||
|---|---|---|---|---|---|---|---|
| 17:47 vs. 21:44 | 17:47 vs. 25:39 | 17:47 vs. 31:33 | 21:44 vs. 25:39 | 21:44 vs. 31:33 | 25:39 vs. 31:33 | ||
| Test diameter (mm) | 4 | 0.186 | 0.025 | 0.017 | 0.804 | 0.723 | 0.999 |
| 8 | <0.001 | <0.001 | <0.001 | 0.088 | 0.001 | 0.241 | |
| 12 | <0.001 | <0.001 | <0.001 | 0.140 | 0.001 | 0.108 | |
| Wet weight (g) | 4 | 0.282 | 0.104 | 0.018 | 0.952 | 0.582 | 0.877 |
| 8 | <0.001 | <0.001 | <0.001 | 0.045 | <0.001 | 0.018 | |
| 12 | <0.001 | <0.001 | <0.001 | 0.024 | <0.001 | 0.013 | |
- 1The PROC MIXED procedure was used to analyze the relationship between average consumption and time accounting for group differences. The group means at various points were compared using the Tukey's adjustment. The significance was determined for the entire 12-wk study (overall) and for each 4-wk period following the start of the study.

(A) Test diameter (mm) and (B) total wet weight (g) of sea urchins fed four different protein : carbohydrate feeds. Values represent mean±SE. Letters represent significant differences among diets.
The predictive model from The Mixed Procedure indicated an overall significant time effect, group × time effect, but not a group effect for wet weight (Table 3A). At Week 4, the total wet weight of sea urchins fed the 31:33% diet was significantly higher (20.2 g) than sea urchins fed the 17:47% (17.3 g), but not the 21:44% (19.0 g) or 25:39% (19.6 g) diets (Table 3B and Fig. 2B). At Weeks 8 and 12, the total wet weight was different among all the diet treatments and varied directly with protein level.
There was no significant linear relationship (R = 0.088, P = 0.488) between the energy consumption and wet weight gain at Week 12; however, there was a significant linear relationship (R = 0.585, P < 0.001) between protein consumption and wet weight gain (Fig. 3A, B). There were also significant curvilinear relationships between wet weight gain and both protein : carbohydrate ratio (R = 0.692, P < 0.001) and protein : energy ratio (R = 0.694, P < 0.001) at Week 12 (Fig. 4A, B).
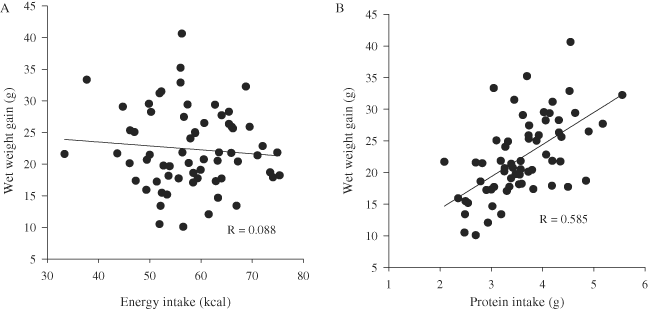
Scatter plot of wet weight gain (A) versus energy intake and (B) versus protein intake at 12 wk. The regression line of best fit indicates the relationship between the two parameters and the R value indicates the strength of the relationship.
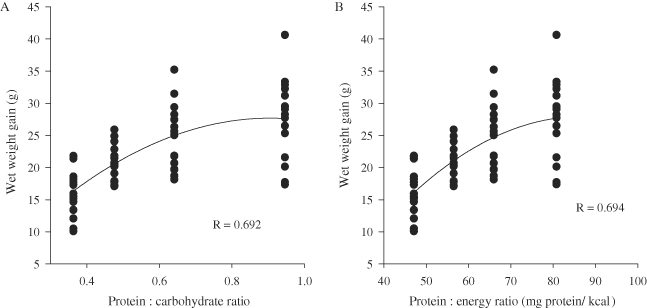
Scatter plot of wet weight gain (A) versus protein : carbohydrate ratio and (B) versus protein : energy ratio at 12 wk. Each point represents an individual (n = 16 for each ratio). The regression line of best fit indicates the relationship between the two parameters and the R value indicates the strength of the relationship.
Organ Wet and Dry Weight
Test wet and dry weight varied directly with dietary protein and inversely with dietary carbohydrate content at 12 wk (Table 4). Sea urchins fed the 31:33% diet had a significantly higher test dry weight than urchins fed the 17:47% and 21:44% diets but not the 25:39% diet at Week 12. Wet and dry weight of Aristotle's lantern did not vary significantly among the diet treatments (Table 4). Gut wet weight varied directly with dietary protein and inversely with dietary carbohydrate content at 12 wk; however, the increase in gut wet weight was isometric with test wet weight. Gut dry weight did not vary with diet treatment. Gonad wet and dry weight varied directly with dietary protein content and inversely with carbohydrate content at Week 12; however, the increase in gonad wet and dry weight was isometric with test wet and dry weight, respectively.
| Organ | Parameters | Dietary protein : carbohydrate (%) | 12 wk | ANOVA | ANCOVA |
|---|---|---|---|---|---|
| Test | Wet weight (g) | 17:47 | 10.49 ± 0.22 | C | NA |
| initial | 21:44 | 13.17 ± 0.28 | B | NA | |
| 5.74 ± 0.17 | 25:39 | 14.46 ± 0.52 | AB | NA | |
| 31:33 | 15.40 ± 0.73 | A | NA | ||
| Dry weight (g) | 17:47 | 5.47 ± 0.12 | C | NA | |
| initial | 21:44 | 6.58 ± 0.15 | B | NA | |
| 2.90 ± 0.08 | 25:39 | 7.05 ± 0.26 | AB | NA | |
| 31:33 | 7.46 ± 0.30 | A | NA | ||
| Lantern | Wet weight (g) | 17:47 | 1.03 ± 0.03 | A | A |
| initial | 21:44 | 1.11 ± 0.04 | A | A | |
| 0.66 ± 0.02 | 25:39 | 1.08 ± 0.04 | A | A | |
| 31:33 | 1.05 ± 0.03 | A | A | ||
| Dry weight (g) | 17:47 | 0.57 ± 0.02 | A | A | |
| initial | 21:44 | 0.62 ± 0.02 | A | A | |
| 0.38 ± 0.01 | 25:39 | 0.62 ± 0.02 | A | A | |
| 31:33 | 0.60 ± 0.02 | A | A | ||
| Gut | Wet weight (g) | 17:47 | 0.83 ± 0.04 | B | A |
| initial | 21:44 | 0.85 ± 0.03 | B | A | |
| 0.24 ± 0.0 | 25:39 | 0.90 ± 0.04 | AB | A | |
| 31:33 | 1.06 ± 0.05 | A | A | ||
| Dry weight (g) | 17:47 | 0.20 ± 0.01 | A | A | |
| initial | 21:44 | 0.21 ± 0.01 | A | A | |
| 0.05 ± 0.01 | 25:39 | 0.22 ± 0.01 | A | A | |
| 31:33 | 0.25 ± 0.01 | A | A | ||
| Gonad | Wet weight (g) | 17:47 | 3.75 ± 0.27 | B | A |
| initial | 21:44 | 4.98 ± 0.33 | AB | A | |
| 0.07 ± 0.02 | 25:39 | 5.45 ± 0.31 | A | A | |
| 31:33 | 6.20 ± 0.43 | A | A | ||
| Dry weight (g) | 17:47 | 1.26 ± 0.08 | B | A | |
| initial | 21:44 | 1.69 ± 0.12 | A | A | |
| 0.02 ± 0.01 | 25:39 | 1.83 ± 0.10 | A | A | |
| 31:33 | 1.89 ± 0.10 | A | A |
Production and Efficiency
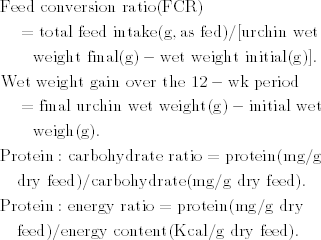
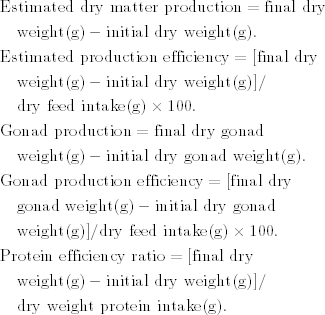
The feed conversion ratio (FCR) of sea urchins varied indirectly with dietary protein content and directly with the carbohydrate level (Table 5). Sea urchins fed the 31:33% diet had a significantly lower FCR (0.6) than sea urchins fed the 17:47% (1.2) or 21:44% (0.9) diets but not the 25:39% (0.7) diet at Week 12 (ANOVA, F = 39.054, df = 3, P < 0.001). Sea urchins fed the 31:33% diet had significantly higher production (7.1 g) and production efficiency (53%) than sea urchins fed the 17:47% (4.2 g, 27.3%) or 21:44% (5.8 g, 35.3%) diets (ANOVA, F = 14.084, df = 3, P≤ 0.032, production; F = 19.309, df = 3, P≤ 0.003, production efficiency; Table 5). Although production did not vary between urchins fed the 31:33% (7.1 g) and 25:39% (6.0 g) diets, those fed the 31:33% diet had significantly higher production efficiency (53%, ANOVA, F = 19.309, df = 3, P≤ 0.003) than those fed the 25:39% (39.3%) diet (Table 5).
| Protein : carbohydrate ratio | ||||
|---|---|---|---|---|
| 17:47 | 21:44 | 25:39 | 31:33 | |
| FCR | 1.19 ± 0.07a | 0.87 ± 0.04b | 0.71 ± 0.04bc | 0.56 ± .04c |
| ETP (g) | 4.24 ± 0.21c | 5.80 ± 0.28b | 6.02 ± 0.31ab | 7.06 ± 0.41a |
| ETPE (%) | 27.31 ± 2.02c | 35.32 ± 2.012bc | 39.31 ± 2.45b | 53.05 ± 3.04a |
| EGP (g) | 1.24 ± 0.08b | 1.68 ± 0.12a | 1.81 ± 0.10a | 1.87 ± 0.10a |
| EGPE (%) | 6.90 ± 0.52c | 9.36 ± 0.70b | 10.86 ± 0.65ab | 12.60 ± 0.42a |
| EPER | 1.59 ± 0.12a | 1.70 ± 0.10a | 1.59 ± 0.10a | 1.72 ± 0.10a |
- FCR = food conversion ratio; ETP = estimated total production; ETPE = estimated total production efficiency; EGP = estimated gonad production; EGPE = estimated gonad production efficiency; EPER = estimated protein efficiency ratio.
Gonad production was significantly less in sea urchins fed the 17:47% (1.2 g) diet than in urchins fed the other three diets (1.7, 1.8, 1.9 g, respectively, ANOVA, F = 8.112, df = 3, P≤ 0.016; Table 5). Gonad production efficiency was significantly higher in sea urchins fed the 31:33% (12.6%) diet than in urchins fed the 17:47% (6.9%) and 21:44% (9.4%) diets but not the 25:39% (10.9%) diet (ANOVA, F = 17, 47.299, df = 3, P≤ 0.020). There was no difference in the protein efficiency ratio among the diet treatments at Week 12 (Table 5).
Discussion
Feed Intake
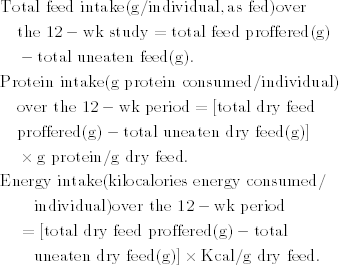
Direct measures of feed intake could not be accomplished in this study due to time and labor available; thus, feed intake was estimated as described previously (Jones et al. 2010). These feed intake estimates are reasonable, as personnel were trained in feed intake evaluation and all evaluations were consistent. It is acknowledged that these estimates may result in increased variation and increase the potential for Type II error. Individual sea urchins feed intermittently and without consistency, that is, some individuals will feed, whole or in part, immediately, whereas others may not feed for several hours, allowing nutrient leaching (Hammer 2006). Consequently, feed estimates are always confounded by leaching/disintegration, and feed intake values will be overestimates of the actual amount of feed consumed. However, these estimated feed intake values are comparable among the diets in this study.
Reduced feed intake of the high protein (high energy) diet suggests that L. variegatus consumed feed to satisfy an energy requirement. However, energy alone cannot easily explain all of the differences observed in growth and production rates. Protein (or amino acid) levels, protein : energy ratios or, more specifically, protein : carbohydrate ratios may affect growth and production rates. Inherent differences in specific nutrient digestibilities may also affect production. Interestingly, the increased feed intake by urchins fed the 17:47%, 21:44%, and 25:39% diets did not become significant until the final period of the study (Weeks 8–12) suggesting that dietary requirements were being satisfied early but were later insufficient to support maximal weight gain. Hammer et al. (2006) reported that adult L. variegatus fed a 9% protein diet consumed more food than urchins fed 20 or 31% protein diet. Similar results were observed with small L. variegatus (Hammer et al. 2004). Fernandez and Boudouresque (1998) and McBride et al. (1998) indicated an inverse relationship between feed intake and protein content for small Paracentrotus lividus and Strongylocentrotus franciscanus, respectively. Otero-Villanueva et al. (2004) indicated that feed intake rates were lower for small Psammechinus miliaris fed a commercial salmon feed (37% protein) than for urchins fed a diet of mussels (31% protein), formulated feed (27% protein), or algae (2% protein). Miller and Mann (1973) suggested that sea urchins in the field may consume large amounts of carbohydrate rich (protein poor) material to process and obtain necessary protein. We do, however, recognize the difficulties in comparing different studies due to differences in source protein quantity and quality as well as differences in other nutrients that may change in response to changing a practical or natural feed ingredient. Additionally, although all urchins were “feed trained” using the 31:33% diet, we do not believe this diet provided an advantage to this treatment, as urchins will readily consume almost any source of organic nutrients.
Growth
Weight gain was directly proportional to the amount of protein and inversely proportional to carbohydrate intake, and differences were observed within the first 4 wk of feeding. Weight gain was not directly proportional to energy intake. Weight gain was higher than previously reported from laboratory and field observations for this species (Beddingfield and McClintock 2000), with individuals increasing approximately 8.5–12.5 mm in test diameter and approximately 16–28 g in wet weight in 12 wk. Otero-Villanueva et al. (2004) reported that large P. miliaris (ca. 18 g wet weight and 33 mm test diameter) fed a commercial salmon feed (28% protein) and a diet of fresh mussel tissue (20% protein) had significantly higher total wet weights than urchins fed algae (3% protein). Small P. lividus fed 13% protein diets for 9 mo had smaller test diameters than urchins fed 29 or 47% protein diets after 9 mo (Fernandez and Boudouresque 1998). Small Pseudocentrotus depressus (ca. 1.6 g wet weight and 15 mm test diameter) fed a 10% purified protein in the diet had significantly smaller test diameters than sea urchins fed 21–51% purified protein but no significant differences in wet weight were observed over the 8-wk study (Akiyama et al. 2001). McBride et al. (1998) indicated no difference in test diameter or wet weight among S. franciscanus fed 30, 40, or 50% protein diets for 10 mo.
Organ Weight
Evaluating growth in sea urchin organs (test, Aristotle's lantern, gut, gonad) represent a unique challenge in evaluating treatment effects. Organ allometry can change with organismal size and presumably those factors that induce changes in the size of the organism. The test, gut, and gonad wet weights increased with dietary protein content; however, these organs increased in proportion to the size of the sea urchin. That is, organ allometry did not occur with protein and carbohydrate feed intake, but was isometric. Dry weight values for the gut and gonad showed similar, but less significant, trends with feed protein and carbohydrate levels. Aristotle's lantern did not vary with dietary protein and carbohydrate, but varied directly based on the size of the individual.
Production
The lower food conversion ratio, higher production, and higher production efficiency of urchins fed the 31:33% diet suggests that this diet promotes efficient somatic growth. Total protein and/or indispensable amino acids may be limiting in diets with lower protein levels. Production efficiencies in this study were higher (25–48%) than those reported for large adult L. variegatus (9–26%) (Hammer et al. 2006; Watts et al. 2011) and small L. variegatus (12–33%) (Hammer et al. 2004). The high production efficiencies in this study resulted from a combination of lower consumption and higher production, strongly suggesting that the feeds were of high nutritional quality. Additionally, the feeds used in this study (extruded pellets) had much lower water content (higher nutrient density) than those reported in previous studies (wet pellets, low nutrient density) with L. variegatus. These observed increases in efficiencies are important, as they suggest extruded dry feeds are used effectively by sea urchins for somatic growth.
Fernandez and Boudouresque (1998) reported that production efficiency was directly related to protein content of the diet in small P. lividus cultured for 9 mo. McBride et al. (1998) reported that reduced feed intake in small S. franciscanus fed 40 and 50% protein diets led to higher production efficiencies than for urchins fed a 30% protein diet. Otero-Villanueva (2004) reported highest production efficiencies in small and large P. miliaris fed high protein versus low protein diets. As indicated previously, comparisons among studies are constrained due to differences in source protein quality and quantity.
Higher dietary protein and/or carbohydrate support efficient gonad production. The gonad production efficiencies in this study (6.9–12.6%) are higher than those reported for adult L. variegatus (1.9–9.3%) (Hammer et al. 2006; Watts et al. 2011) and for small L. variegatus (0.59–4.1%) (Hammer et al. 2004), further supporting the value of an extruded dry feed in improving roe production in captured adult urchins.
Protein efficiency ratios (PER) were similar among the feeds examined, suggesting that adequate nonprotein energy was not limiting for the growth rate obtained and that protein was probably not being utilized as a significant energy source. In contrast, Hammer et al. (2006) reported PER values that were significantly lower in a 31% protein feed (compared to 9 and 20% protein feeds) and suggested that the protein was used as an energy source, as carbohydrate was limited in the feed (12 vs. 33% in the current feed). The use of carbohydrate as the primary energy source in sea urchins is suggested by Taylor (2006) and Marsh and Watts (2007). Akiyama et al. (1997) reported PER values ranging from 0.77 to 6.6 (based on wet weight gain) for small P. depressus fed 4 diets of 26 to 30% crude protein. Schlosser et al. (2005) reported that protein efficiency (based on digestible protein) was much higher in adult P. lividus fed a formulated diet (23% protein) than that of urchins fed two different algae feeds (37 and 15% protein) because the formulated diet contained more digestible energy.
The protein : energy ratio of the 31:33% diet was approximately 80.8 mg protein/Kcal and is slightly lower than the ratio used in the diets of many commercial shrimp species (ranging from 90 to 160 mg protein/Kcal reviewed in Cuzon and Guillaume 1997). A better defined protein : energy ratio for this species might allow for a reduction in the amount of protein in the feed without limiting growth. Such a reduction in feed protein would reduce feed cost and pollution potential of the feed in aquaculture systems.
From a commercial standpoint, determination of protein requirements in sea urchins is more complex than in finfish. The ultimate goal of commercial sea urchin culture is the production of consumer-preferred roe. Although certain protein levels may promote maximum somatic weight gain and roe production, these same levels may negatively impact other important qualities (taste, texture, color) for the successful marketability of roe. Pearce et al. (2002) found that high levels of dietary protein increased the degree of bitterness in the roe of cultured gonads in Strongylocentrotus droebachiensis. Thus, determination of protein, carbohydrate, and neutral fat requirements in urchin culture will require an “optimization” of energy levels in formulated feeds, to balance the goal of efficient somatic growth with the production of quality roe.
In summary, sea urchins grew at a rate higher than that reported for any other study using adult L. variegatus, suggesting that the dry diets used were of high quality. Somatic and gonad production were significant, indicating that somatic weight gain and gonad mass of wild-caught L. variegatus could be greatly increased within a 12-wk period using extruded dry diets. These data indicate that we are approaching the upper requirement for feed protein levels, although it may be possible to improve upon the 31:33% diet through evaluation of amino acid requirements and nutrient digestibilities. This study suggests that sea urchins are very efficient at converting protein to tissue (regardless of the protein level of the feed) as long as sufficient digestible energy is available (protein sparing). We suggest that future nutrition research focus on protein : energy ratios, indispensable amino acid levels and requirements, and highly digestible protein and carbohydrate sources. These areas of research are essential to the development of cost-effective, commercially available feeds for the future aquaculture of sea urchins.
Acknowledgments
We would like to thank Jeff Barry, Anthony Siccardi, Patty Waits Beasley, and the rest of the staff at the Texas AgriLife Research Mariculture Laboratory in Port Aransas, Texas, for their technical support. We also thank Renee Desmond (Department of Biostatistics) and Robert Angus for statistical consultation. The authors also thank Louis D’Abramo and Brenda Hammer for reviewing this manuscript. This publication was supported by the National Sea Grant College Program of the U.S. Department of Commerce's National Oceanic and Atmospheric Administration under NOAA grant numbers NA16RG2258 and NA06OAR41700 78, the Mississippi-Alabama Sea Grant Consortium project numbers R/SP-9 and R/SP-15, and the University of Alabama at Birmingham. Additional support was provided by the Texas Sea Grant and Texas AgriLife Research Mariculture Laboratory. The views expressed herein do not necessarily reflect the views of any of those organizations.


