Growth and Contaminant Removal Effect of Several Plants in Constructed Wetlands
Supported by the National Natural Science Foundation of China (30470346), and the Natural Science Foundation of Guangdong Province (021082 and 06025056).
Abstract
The aim of the present study is to probe the relation between plant growth and its decontamination effect in constructed wetlands. Four species were studied in the small-scale mono-cultured constructed wetlands, which were fed with domestic wastewater. Plant growth indexes were correlated with contaminant removal performance of the constructed wetlands. Wetlands planted with Cyperus flabelliformis Rottb. showed the highest growth indexes such as shoot growth, biomass, root activity, root biomass increment, and the highest contaminant removal rates, whereas wetlands planted with Vetiveria zizanioides L. Nash had the lowest growth indexes and the lowest removal rates. Above-ground biomass and total biomass were significantly correlated with ammonia nitrogen removal, and below-ground biomass with soluble reactive phosphorus removal. Photosynthetic rate had higher correlation with nitrogen removal in these species. Root activity and root biomass increment was more correlated with 5 d biochemical oxygen demand removal. Chemical oxygen demand removal had lower correlations with plant growth indexes. All four species had higher removal rates in summer and autumn. The results suggest that the effect of plant growth on contaminant removal in constructed wetlands were different specifically in plants and contaminants.
Constructed wetlands have been used for the treatment of domestic or municipal wastewater for decades (Ran et al. 2004; Vymazal 2005; Maine et al. 2007). This wetland system process has been gaining international interest and increased applications due to its low maintenance and operation cost, and high decontamination capacity (Brix 1987; Green and Upton 1994; Liang et al. 2003). The complex interaction processes between wetland plants, microorganisms, and substrate in wetland systems are considered the main mechanisms of wastewater treatment (Chen et al. 2004).
Previous studies have indicated that several processes in wastewater treatment were strongly linked to functional characteristics of the wetland macrophytes, especially in regard to the important functions of the roots (Tanner 2001; Kadlec et al. 2005; Stein and Hook 2005). Wetland plants generally have notable root zones, where physicochemical and biological processes, induced by the interaction of plants, microorganisms, substrate and contaminations, take place (Kivaisi 2001; Stottmeister et al. 2003). It was reported that the ability to remove contaminants by wetland plants is significantly related to root development (Wood 1995; Cheng 1996). Yang et al. (2007) also found that the abundance of fine roots is an important characteristic in selecting highly effective wetland plants. Batty and Younger (2004) found that the majority of ions was present either within or was associated with plant roots. The characteristics of wetland plant roots such as distribution and biomass can be considered as one of the predictors to evaluate the potential application in artificially constructed wastewater treatment wetlands (Kyambadde et al. 2004; Chen et al. 2007b). But very little research on vertical distribution and biomass of root systems has been conducted in these constructed wetlands (Chen et al. 2004).
In wetland substrate, plants are faced with a substantial lack of oxygen. Wetland plants have extensive oxygen transport systems to transport the oxygen to the roots to cope with soil anaerobiosis and to remove contaminants (Delaune et al. 1990; Armstrong et al. 1994; Sorrell 1999). Photosynthesis is not only a resource of oxygen transport, but also provides the energy for wastewater treatment (Polprasert and Khativada 1998; Kadlec 1999). A high photosynthetic rate of plants secures high root activity by supplying sufficient amount of photosynthates to the roots. Conversely, high root activity secures a high photosynthetic rate by supplying sufficient amounts of nutrients to plants, thus ensuring a high biomass (Osaki et al. 1997; Yang et al. 2004). Studies on photosynthesis of wetland plants have mainly focused on the photosynthesis characteristics under flooding, different light, and salinity conditions (Pezeshki et al. 1996; Lessmanna et al. 2001; Blindow et al. 2003; Chen et al. 2005), and very few studies have assessed the relationships between photosynthesis, root activity, and contamination removal.
Earlier studies are contradictory concerning the actual role of plants in the cleansing process (Karathanasis et al. 2003; Edwards et al. 2006). Recent research indicates that while direct uptake and sequestration of nutrients by plants may not play a major role, plants could still be important in improving the cleaning ability of constructed wetlands because of their important indirect roles. Recent studies have also shown that a large difference exists in the removal efficiency between different plant wetlands (Tanner 1996; Karathanasis et al. 2003; Iamchaturapatr et al. 2007; Maine et al. 2007). However, few studies have involved the correlation between above- and below-ground growth, and the effect of such correlation on pollutant removal efficiency (Coleman et al. 2001; Kyambadde et al. 2004; Ray and Inouye 2007). It is not known how root growth, activity and photosynthesis affect each other, or how they affect contaminant removal. The objective of the present study was to compare contaminant removal of four wetland species and investigate the correlation between removal rate and plant growth characteristics (photosynthesis, shoot and root growth and biomass, root activity) in the constructed wetlands.
Results
Root biomass, growth and activity
Cyperus flabelliformis Rottb. had significantly (P < 0.05) higher amounts of fine roots (D < 3 mm) than other species. Vetiveria zizanioides L. Nash had a significantly (P < 0.01) lower below-ground biomass than other species (Table 1). Phragmites australis Trin. ex Steud. and Acorus calamus Linn. had a notable rhizome biomass, which made up 57.5% and 75.2% of total below-ground biomass, respectively.
| Species | Below-ground biomass (g per plant) | ||||
|---|---|---|---|---|---|
| D ≤ 1 mm | 1 < D ≤ 3 mm | D > 3 mm | Rhizome | Total | |
| Acorus calamus | 24.7 ± 9.7aB(0.12) | 25.7 ± 5.5B | 0 | 152.6 ± 36.5 | 203.0 ± 50.1bA |
| Cyperus flabelliformis | 78.4 ± 19.3A(0.43) | 101.9 ± 9.9A | 0 | 0 | 182.4 ± 28.1abA |
| Phragmites australis | 24.6 ± 10.4aB(0.18) | 31.4 ± 9.6B | 0.8 ± 1.8 | 76.6 ± 32.4 | 133.4 ± 37.0aA |
| Vetiveria zizanioides | 10.3 ± 3.6bB(0.21) | 39.4 ± 18.0 B | 0 | 0 | 49.7 ± 20.3cB |
- Values in parentheses are percentages of roots. D ≤ 1 mm.
- Significant difference tests of below-ground biomass are conducted between four species. Different small letters denote a significant difference (P < 0.05), and different capitals denote a very significant difference (P < 0.01).
Total root growth (root biomass increment, g/m2) of C. flabelliformis, A. calamus, P. australis, and V. zizanioides were 643.8, 300.7, 256.9, and 81.0, respectively. Root growth of C. flabelliformis was significantly (P < 0.05) higher than that of the other three species. There was no significant difference between A. calamus, P. australis, and V. zizanioides. Root growth exhibited a single-peak pattern, with maximum growth in November, except A. calamus, which presented its peak in September (Figure 1). A higher percentage of root biomass increment was distributed in the 5–15 cm medium for all species (Figure 2). However, difference also existed between species. P. australis and V. zizanioides exhibited a remarkable percentage of root biomass increment in the deeper depth (>15 cm), while C. flabelliformis and A. calamus had a high percentage in the upper 5 cm (Figure 2).
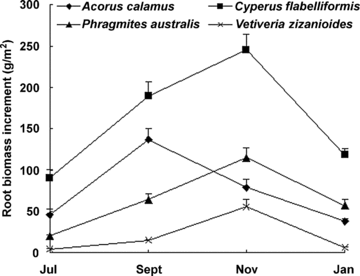
Root growth (root biomass increment) (g/m2) (mean ±SD) of the four species measured with net cylinders in July, September, November and January (the following year).
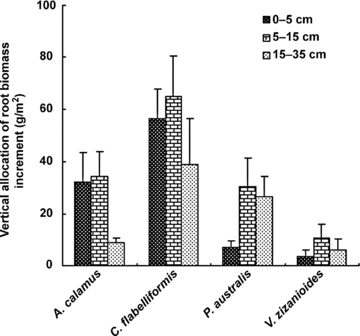
Vertical allocation of root biomass increment (g/m2) (mean ±SD) of four species measured with net cylinders.A. calamus, Acorus calamus; C. flabelliformis, Cyperus flabelliformis; P. australis, Phragmites australis; V. zizanioides, Vetiveria zizanioides.
A marked difference in root activity was measured between species. C. flabelliformis had a significantly higher (P < 0.05) yearly average root activity (1.42 mg/g dry weight (DW) per h) than V. zizanioides and A. calamus. In all months, except October, there existed a significant difference (P < 0.05) between the four species. In general, root activity was higher in the earlier months, declined after May or June, and reached its lowest values in October (Figure 3).
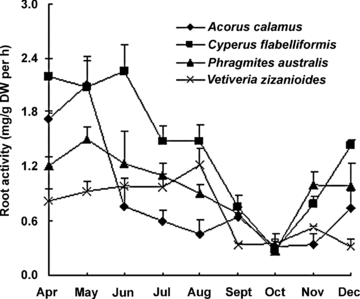
Root activity (mean ±SD) of four species in the small-scale gravel wetlands during a growing season.
Shoot growth and photosynthesis
Acorus calamus had the highest daily average photosynthetic rate (9.40 μmol CO2/m2 per s), followed by P. australis (8.75 μmol CO2/m2 per s), C. flabelliformis (8.27 μmol CO2/m2 per s), and V. zizanioides (5.92 μmol CO2/m2 per s), the latter being significantly (P < 0.05) lower than the other three species. No significant difference existed between the other three species. Photosynthetic rate was lower in the morning and gradually increased to a maximum photosynthesis between 11.00–13.00 hours during the spring and summer months and at 13.00 hours during winter. The exceptions were A. calamus, which had the highest values between 09.00 and 13.00 hours, and had a photosynthesis inhibition at 11.00 hours during April and August, and C. flabelliformis, which showed a photosynthesis inhibition at 11.00 hours in August. No photosynthesis inhibition was found in P. australis and V. zizanioides during this study (Figure 4). For the same two species there was no significant difference in photosynthetic rate between different seasons.
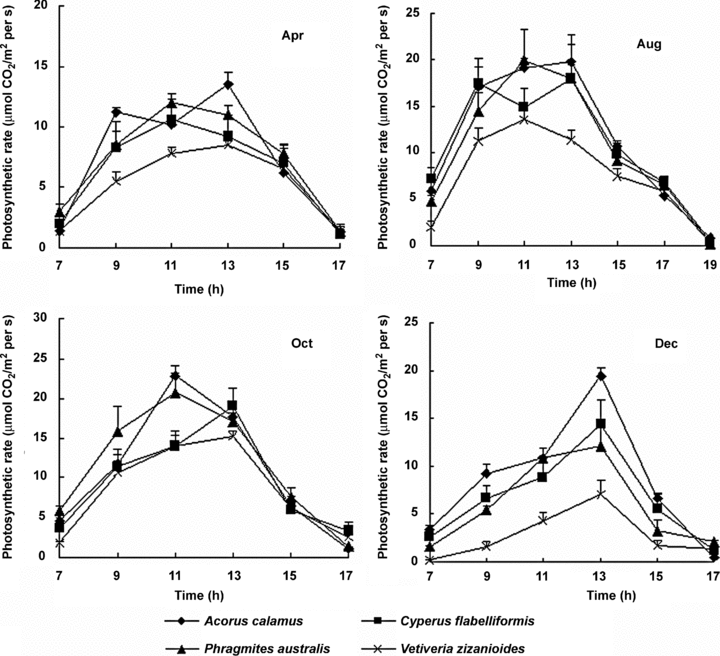
Daily photosynthetic rates (mean ±SD) of four species in the small-scale gravel wetlands in different months.
Average photosynthetic rate and light intensity were higher in summer and autumn than in spring and winter. The results demonstrated a significant correlation between photosynthetic rate and light intensity, and between photosynthetic rate and the combination of light intensity and temperature (P < 0.05).
The maximum and the minimum average shoot heights were recorded in C. flabelliformis (145.8 cm) and P. australis (94.0 cm) wetlands at the end of the growth season (Figure 5A). C. flabelliformis had the highest average height growth rate (11.5 cm per month), followed by V. zizanioides (8.8), P. australis (6.6), and A. calamus (4.0). There was a significant difference (P < 0.05) between C. flabelliformis and A. calamus. The four species generally demonstrated the fastest height growth during the first half of the year. The culms of P. australis were bent during growth, which decreased the shoot height. Height growth of A. calamus ceased after June and most leaves wilted after September. V. zizanioides maintained a relatively steady height (101.7 cm on average) after September (Figure 5A).
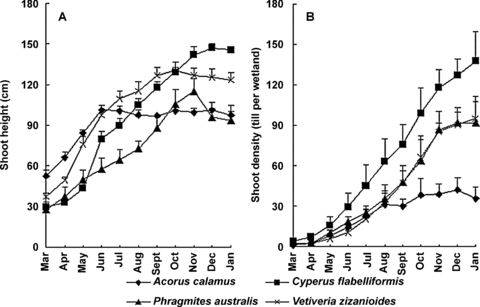
Shoot height (A) and shoot density (B) (mean ±SD) of four species in the small-scale gravel wetlands.
The maximum shoot densities (tillers per wetland) for C. flabelliformis, P. australis, V. zizanioides, and A. calamus were 137.6, 93.1, 92.2, and 34.7, respectively (Figure 5B). C. flabelliformis had the highest average tiller growth rate (13.6 tillers per month), followed by P. australis (10.7 tillers per month), V. zizanioides (9.6 tillers per month), and A. calamus (3.2 tillers per month). There was a significant difference (P < 0.05) in tiller density between the species, except between V. zizanioides and P. australis. C. flabelliformis, P. australis, and V. zizanioides kept high tiller rates until November, while A. calamus displayed a high tiller rate to August, and leveled off subsequently (Figure 5B).
The maximum above-ground biomass (1 004.1 g per plant) and total biomass (1 186.5 g per plant) were recorded for C. flabelliformis, which were significantly larger (P < 0.01) than for other species. A. calamus had the lowest above-ground biomass (145.0 g per plant). V. zizanioides had the lowest total biomass (216.9 g per plant) (Figure 6). The above-ground biomasses of V. zizanioides and C. flabelliformis accounted for 77.1% and 87.0% of total biomass, respectively, while A. calamus and P. australis, both having proportionally large rhizomes, had lower percentages (41.7% and 52.3%, respectively).
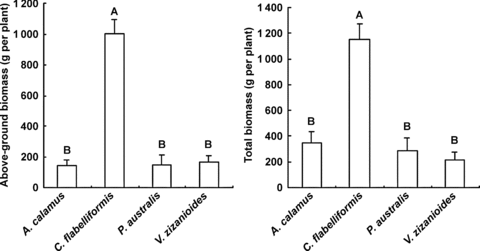
Above-ground biomass (left) and total biomass (right) (mean ±SD) of the four species in the small-scale gravel wetlands.Significant difference tests were conducted between four species, different capitals denote a very significant difference (P < 0.01). A. calamus, Acorus calamus; C. flabelliformis, Cyperus flabelliformis; P. australis, Phragmites australis; V. zizanioides, Vetiveria zizanioides.
Contaminant removal rate
Average total nitrogen (TN) removal rates varied from 36.6 to 56.6%, with an average influent concentration of 17.68 mg/L (Figure 7). Nitrogen in the influent wastewater occurred predominantly as ammonia nitrogen (NH4-N) (nearly 80% of total nitrogen). NH4-N removal rates varied between 58.7%–79.3%. Nitrate nitrogen (NO3-N) removal rates were 54.7%–68.5% with relatively low influent concentrations ranging from 0.47 mg/L to 1.55 mg/L on average. Highest TN removal was recorded in summer, and was significantly (P < 0.05) higher than in winter; NH4-N and NO3-N removal rates were significantly (P < 0.01) higher in summer and autumn than in spring and winter. C. flabelliformis had the highest nitrogen removal rate, followed by A. calamus, P. australis, and V. zizanioides. The TN removal of C. flabelliformis was significantly (P < 0.01) higher than V. zizanioides. However, there was no significant difference between species for NH4-N and NO3-N removal.
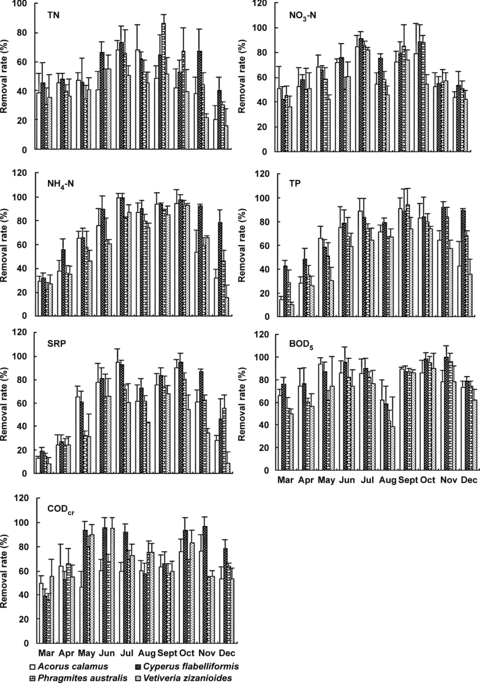
Removal rates (mean ±SD) of several contaminants in small-scale gravel wetlands of four species in different months.
Average total phosphorus (TP) and soluble reactive phosphorus (SRP) removal varied between 50.3%–76.9% and 40.1%–68.4% with low influent values (2.36 and 1.74 mg/L on average, respectively) (Figure 7). TP removal was significantly (P < 0.01) higher in summer and autumn than in winter, and SRP removal was significantly (P < 0.05) higher in summer and autumn than in spring and winter. C. flabelliformis had the highest P removal rate, significantly higher (P < 0.05) than that of V. zizanioides. There was no significant difference between the other species in P removal.
The fluctuation in influent concentration of 5 d biochemical oxygen demand (BOD5) and chemical oxygen demand (CODcr) was quite high between months. The lowest values (9.64 mg/L BOD5 and 39.06 mg/L CODcr) were in August, and the highest values were observed in December (44.70 mg/L BOD5 and 125.95 mg/L CODcr). As a whole, BOD5 and CODcr removal rates were high. Average BOD5 and CODcr removal rates varied from 69.3% to 87.4% and from 61.4% to 79.0%, respectively (Figure 7). BOD5 removal in autumn was significantly (P < 0.05) higher than in other seasons. There was no significant difference between seasons for CODcr removal. C. flabelliformis had the highest BOD5 and CODcr removal rates, significantly higher than V. zizanioides, which had the lowest BOD5 removal rate, and A. calamus, which had the lowest CODcr removal rate.
Plant growth and removal efficiency
Photosynthetic rate appeared to show higher correlation with removal rate than the other growth indexes, especially with nitrogen removal. Root activity and root biomass increment seemed to have a more significant correlation with phosphorus removal and BOD5 removal. As for species, A. calamus, which had higher photosynthetic rate, represented a higher correlation between photosynthetic rate and contaminant removal. C. flabelliformis showed higher correlation regression coefficients between removal rate and root activity and between removal rate and root biomass increment, while V. zizanioides had the least correlation between contaminant removal and growth indexes. As for contaminants, BOD5 removal appeared to have a more significant correlation with the growth indexes, while CODcr removal appeared to have the least correlation (Table 2). Above-ground biomass and total biomass were significantly correlated with NH4-N removal, and below-ground biomass with SRP removal (Table 3).
| Species | TN | NO3-N | NH3-N | TP | SRP | BOD5 | CODcr | |
|---|---|---|---|---|---|---|---|---|
| Net photosynthesis | Acorus calamus | 0.77 | 0.98* | 0.90* | 0.69 | 0.87 | 0.95* | 0.48 |
| Cyperus flabelliformis | 0.96* | 0.86 | 0.69 | 0.47 | 0.65 | 0.39 | 0.13 | |
| Phragmites australis | 0.90* | 0.92* | 0.80 | 0.31 | 0.38 | 0.34 | 0.02 | |
| Vetiveria zizanioides | 0.41 | 0.68 | 0.98* | 0.66 | 0.83 | 0.65 | 0.77 | |
| Mean | 0.76 | 0.86 | 0.84 | 0.53 | 0.68 | 0.58 | 0.35 | |
| Root biomass increment | Acorus calamus | 0.66 | 0.75 | 0.89* | 0.40 | 0.74 | 0.46 | 0.14 |
| Cyperus flabelliformis | 0.66 | 0.64 | 0.76 | 0.81 | 0.96* | 0.97* | 0.80 | |
| Phragmites australis | 0.37 | 0.63 | 0.62 | 0.79 | 0.76 | 0.99** | 0.02 | |
| Vetiveria zizanioides | 0.01 | 0.17 | 0.51 | 0.49 | 0.23 | 0.78 | 0.12 | |
| Mean | 0.43 | 0.55 | 0.70 | 0.62 | 0.67 | 0.80 | 0.27 | |
| Root activity | Acorus calamus | 0.00 | 0.06 | 0.26 | 0.56 | 0.40 | 0.08 | 0.43 |
| Cyperus flabelliformis | 0.22 | 0.22 | 0.67 | 0.81 | 0.66 | 0.99** | 0.74 | |
| Phragmites australis | 0.31 | 0.56 | 0.58 | 0.87 | 0.82 | 0.98** | 0.00 | |
| Vetiveria zizanioides | 0.11 | 0.14 | 0.09 | 0.61 | 0.61 | 0.10 | 0.51 | |
| Mean | 0.16 | 0.25 | 0.40 | 0.71 | 0.62 | 0.54 | 0.42 |
- *P < 0.05; **P < 0.01. Data analyzed are the means of every season except the data of root biomass increment which are the means of July, September, November and January of next year, respectively. Spring: March–May; summer: June–September; autumn: October–November; winter: December–February. BOD5, 5 d biochemical oxygen demand; CODcr, chemical oxygen demand; NH4-N, ammonia nitrogen; NO3-N, nitrate nitrogen; SRP, soluble reactive phosphorus; TN, total nitrogen; TP, total phosphorus.
| TN | NO3-N | NH4-N | TP | SRP | BOD5 | CODcr | |
|---|---|---|---|---|---|---|---|
| Above-ground biomass | 0.68 | 0.33 | 0.94* | 0.56 | 0.44 | 0.60 | 0.73 |
| Below-ground biomass | 0.39 | 0.79 | 0.28 | 0.60 | 0.88* | 0.74 | 0.03 |
| Total biomass | 0.75 | 0.46 | 0.98* | 0.67 | 0.58 | 0.73 | 0.60 |
- *P < 0.05. BOD5, 5 d biochemical oxygen demand; CODcr, chemical oxygen demand; NH4-N, ammonia nitrogen; NO3-N, nitrate nitrogen; SRP, soluble reactive phosphorus; TN, total nitrogen; TP, total phosphorus.
Discussion
Photosynthesis is an important physiological process for both wetland plants and other plants; furthermore, it might be the main source of oxygen transported to the roots of wetland plants. Many studies indicate that wetland plants could transfer the oxygen produced during photosynthesis to the roots and the rhizosphere, which was considered as the main cause for wetland plants and nitrification and denitrification bacteria to survive in the anaerobic sediments (Barko et al. 1991; Sorrell and Armstrong 1994; Brix 1997; Colmer 2003; Bezbaruah and Zhang 2004). Ma et al. (2005) also found that the change in dissolved oxygen was mainly influenced by plant photosynthesis in constructed wetlands. The substrate of constructed wetlands was anoxic, thus photosynthesis is of special importance for wetland plant growth and contaminant removal. Some studies have reported correlation between photosynthesis and contaminant removal (Luo et al. 2007). In this study, higher correlation between photosynthetic rate and contaminant removal was detected in plants with the highest photosynthetic rate; thus indicating the importance of photosynthesis for contaminant removal. However, photosynthetic rate did not show high relation to contaminant removal in some species in this study, this might relate to the fact that photosynthetic rate does not always exactly reflect photosynthetic ability of a whole plant. Some plants might have higher photosynthetic rate than other plants, but have not higher assimilation ability because of smaller leaf area due to thinner foliage, such as P. australis. Contrarily, C. flabelliformis showed lower photosynthetic rate, which might not be the real reflection of its assimilation ability because only its bract could be measured. This was interpreted as to why C. flabelliformis did not have a high correlation between photosynthetic rate and removal rate, but had a high correlation between growth speed and removal rate.
Our study indicated that photosynthesis had a stronger correlation with nitrogen removal in all four species, but weaker correlations with the removal of other contaminants. It has generally been agreed that the major removal mechanisms for N removal in horizontal subsurface constructed wetlands are ammonification and a complex of bacterial nitrification or denitrification (Vymazal 2002). Incomplete nitrification (i.e. oxidation of ammonia to nitrate) is the major cause of limited nitrogen removal in the anaerobic substrate (Vymazal 2005). Since the main nitrogen form is NH4-N in the present study, it might be responsible for the nitrogen removal enhancement that photosynthesis provided oxygen to the rhizosphere.
Previous studies indicated that constructed wetland decontamination performance was correlated with plant growth characteristics (Breen and Chick 1995; Karathanasis et al. 2003; Chen et al. 2004, 2007b). For example, mean removal of TN showed a significant positive linear correlation with plant biomass (Tanner 1996). In the present study, C. flabelliformis, which exhibited the fastest growth and highest biomass, had the highest removal rate for all the contaminants. V. zizanioides, which had lowest growth and biomass, had the smallest removal effect. Plant biomass was measured correlated with NH4-N and SRP removal (Table 3). These suggest a correlation between growth and removal effect. However, not all species showed a significant correlation between growth and removal effect. Plant direct uptake and assimilation is not the main cause for contaminant removal (Münch et al. 2005; Toet et al. 2005) and the effect of plant growth on decontamination might involve complex mechanisms, including promoting microbial growth and decomposition, plant absorption, favoring physical and chemical decontamination conditions, etc. Therefore, more research is required to assess the relation between plant growth and decontamination effects.
Root biomass and root growth might be greatly responsible for decontamination. Kyambadde et al. (2004) compared root growth and root surface area of Cyperus papyrus L. and Miscanthidium violaceum (K. Schum.) Robyns in microcosm constructed wetlands, and found that C. papyrus had a greater root number increase, and a more adventitious roots production than M. violaceum. This was related to higher removal rates and greater number of periphytic nitrifying bacteria and corresponding higher nitrification rates than M. violaceum. Chen et al. (2007a) compared four “fibril root” plants and four “rhizomatic root” plants, and found that the former had a significantly larger small size root (D < 3 mm) biomass, and significantly faster growth than the latter. The present study also demonstrated that C. flabelliformis had a larger fine root (D < 3 mm) biomass, faster root growth, and higher contaminant removal than the other three species. Root role in decontamination was further revealed from the clue that removal of some contaminants was more correlated with root growth and root activity than others. In this study, root biomass increment showed higher correlation with BOD5 removal and lower correlation with CODcr removal. BOD5 removal is more tightly correlated with microbial community on the rhizoplane and the rhizophere, and CODcr removal is more dependent on the physical, chemical and biodegradative functions of substrate, and less dependent on the direct role of plants.
Root activity is an important factor influencing plant growth and is considered a predictor reflecting the actual uptake of nutrients (Lehmann 2001). In the present study, root activity had a significant correlation with BOD5 removal in some species. It was reported that BOD5 was primarily absorbed in the surface of medium and root system, and decomposed by aerobiotic microorganisms surrounding the roots (Tanner and Sukias 1995; Nguyen 2000). In addition, root activity can improve enzyme activity in the substrate. Substrate enzymes (intracellular and extracellular) are the mediators and catalysts of biochemical processes, which can promote the decomposition of organic pollutants (Shackle et al. 2000; Zhou et al. 2005). This might be the reason why high root activity favored BOD5 removal. This also appeared to have a higher correlation between root activity and P removal. Root activity can improve the substrate phosphatase activity, which plays a key role in soil phosphorus cycling by catalyzing mineralization of organic P (Acosta-Martínez et al. 2007). Li et al. (2007) found that the coupling effect between microorganisms and plants might be one of the main ways to enhance the removal rate of phosphorus in wetlands. This might be the reason why high root activity favored BOD5 and phosphorus removal.
Our study showed that the root activity of most species decreased gradually after May or June, and presented the lowest value in October, which might be related to higher temperature in summer and early autumn of Guangzhou. However, plants had faster growth and the wetlands had higher contaminant removal rates in summer and autumn, which contrasted with the lower root activity. This phenomenon might be explained as: although activity of an individual root decreased gradually after May or June, function of a whole root system (oxygen release, nutrient absorption, etc.) still increased until later months because of larger root number. This might explain why root activity of an individual root generally did not show significant correlation with contaminant removal rates in the present study.
The present study was conducted in small-scale wetlands and lasted only for one growth season, which might cause limitations in the results. For example, a shorter growth period might show a lower ratio of rhizome biomass in total underground biomass; and one growth season might not correctly reflect the growth and decontaminant ability during the early part of a year, because in the present study, plant growth and decontaminant effect was measured in wetlands with young plants during this period.
Materials and Methods
The constructed wetland system
The present study was conducted in the Biological Garden of South China Normal University, Guangzhou, China, from February in 2006 to January in 2007. Guangzhou has a subtropical climate, with an annual average air temperature of 23.2 °C. The coldest month (January) and the hottest month (July) are 13.9 °C and 28.7 °C, respectively. The annual precipitation is about 1 700–1 900 mm, with the wet season occurring from April to September and the dry season from October to March.
Twenty micro-scale gravel-bed constructed wetlands were constructed in rectangular plastic tanks with a size of 56 × 46 × 38 cm (length × width × depth). The tanks were filled to 35 cm depth with 1–2 cm diameter gravel. In every tank two PVC pipes (diameter 4 cm) were placed upright about 15 cm from the center of the tank. One of the pipes was 38 cm long for taking a bottom water sample, and the other was 20 cm for taking a middle water sample. A net cylinder (20 cm diameter, 35 cm height, mesh hole size 2.5 × 2.5 cm) made of thin stainless steel (Chen et al. 2007b) was placed vertically near the center of the tank and filled with gravel substrate for measuring root growth and distribution. Four species, A. calamus, C. flabelliformis, P. australis, and V. zizanioides were used in this study. A. calamus grows widely in wet areas with transverse rhizomes, such as ponds and shallow rivers, in temperate and subtropical regions all over the world. C. flabelliformis is native to Madagascar, distributing in swamps or on shores of lakes with high humidity and fertility. P. australis widely distributes in wet areas such as bogs, ponds and shallow rivers, and are most widely planted in constructed wetlands in the world. V. zizanioides is a pasture plant in tropical and subtropical regions and can also grow in wet areas. With a rich root system it is often used in water and soil conservation (Yang et al. 2007). All of the species are often used as constructed wetland plants in subtropical China. A single seedling of a species (about 20 cm height) was planted in a wetland in February, and each species had five replicates.
Shoot growth and photosynthesis
Photosynthesis was measured every 2 h from 07.00 to 19.00 hours in August, and from 07.00 to 17.00 hours in April, October and December. A total of five mature and intact leaves from five wetlands of each species on each sample day were used for photosynthesis measurement with a LI-6400 portable photosynthesis system (LiCor). The leaves were kept in the LiCor chamber for a short period to avoid air temperature increase in the chamber (Mann and Wetzel 1999). Every leaf was measured in triplicate in different positions, and the measured positions were kept the same during a sample day.
Shoot height (natural height) and shoot density in each tank was counted twice a month. Biomass was measured at the end of the growth season (late January). Shoots were cut at the gravel surface. All the below-ground biomass was excavated, washed and divided into rhizomes and roots. The roots were divided into three diameter (D) groups: D ≤ 1 mm, 1 < D ≤ 3 mm, and D > 3 mm. All above- and below-ground organs had fresh weight and dry weight (after drying to constant weight in an oven at 80 °C) assessed in triplicate.
Root activity and growth
Root activity was determined by measuring oxidation of alpha-naphthylamine (α-NA) (Zhang et al. 1994). One gram of fresh roots (D < 3 mm) was transferred into a 150 mL flask containing 50 mL α-NA (25 mg/L). The flasks were incubated for 1 h at room temperature (25 °C) in an end-over-end shaker. After incubation, the aliquot was filtered and 2 mL filtrate was mixed with 1 mL NaNO3 (1.18 mmol/L) and 1 mL sulfanilic acid, and the resulting color was measured by a spectrophotometer.
Root biomass increment was measured in the net cylinders in July, September, November, and January (of the following year). Gravel in the cylinder was picked out by layers (0–5 cm, 5–15 cm, and 15–35 cm), and the roots were harvested. The gravels were subsequently placed back into the cylinder after measurement (Chen et al. 2007b). The roots were washed and divided into three diameter classes (D ≤ 1 mm, 1 < D ≤ 3 mm, D > 3 mm), and weighed for fresh and dry weight. The root lifespan of the plants was about 60–90 d (Chen et al. 2007a), and biomass increment can be considered as an estimate of root growth.
Contaminant removal
The wetlands were initially filled with tap water for about 4 weeks and then fed with wastewater every 5 d with an average loading rate of 28.0 L/m2 per d. The wastewater used in the experiment, with an average concentration (mg/L) of 5 d biochemical oxygen demand (BOD5) 31.35 ± 13.57, chemical oxygen demand (CODcr) 91.73 ± 37.58, total nitrogen (TN) 17.68 ± 6.38, total phosphorus (TP) 2.36 ± 1.04, soluble reactive phosphorus (SRP) 1.74 ± 0.85, ammonia nitrogen (NH4-N) 14.51 ± 2.94, and nitrate nitrogen (NO3-N) 0.79 ± 0.16, was from a student dormitory. Contaminant concentration represented obvious seasonal variation, with generally higher concentration in winter and lower in summer. Before irrigating, the wastewater was deposited in a large tank. Contaminant concentration was measured according to the standard methods (Environment Bureau of the State 2002). Removal rates (%) of the above contaminants were measured monthly from March to December according to the formula: R= (Cinf−Ceff)/Cinf× 100%, where Cinf is the influent contaminant concentration, and Ceff the effluent contaminant concentration. Effluent was sampled from the bottom, the middle and the surface with equal amounts from each wetland after a 2 d retention. Specific average removal rate was calculated from five wetlands.
Statistical analysis
All the experiment data were analyzed statistically by anova analysis procedure. Duncan's new multiple range test (DMRT) was carried out to test for significant differences between species. DMRT were analyzed using SPPS software packages.
(Handling editor: Guanghui Lin)


