Effects of Glycerol on the Fluorescence Spectra and Chloroplast Ultrastructure of Phaeodactylum tricornutum (Bacillariophyta)
Supported by the National Natural Science Foundation of China (30770336, 30370231 and 40876074).
Abstract
Responses of the photosynthetic activity of Phaeodactylum tricornutum (Bacillariophyta) to organic carbon glycerol were investigated. The growth rate, photosynthetic pigments, 77 K fluorescence spectra, and chloroplast ultrastructure of P. tricornutum were examined under photoautotrophic, mixotrophic, and photoheterotrophic conditions. The results showed that the specific growth rate was the fastest under mixotrophic conditions. The cell photosynthetic pigment content and values of Chl a/Chl c were reduced under mixotrophic and photoheterotrophic conditions. The value of carotenoid/Chl a was enhanced under mixotrophic conditions, but was decreased under photoheterotrophic conditions. In comparison with photoautotrophic conditions, the fluorescence emission peaks and fluorescence excitation peaks were not shifted. The relative fluorescence of photosystem (PS) I and PS II and the values of F685/F710 and F685/F738 were decreased. Chloroplast thylakoid pairs were less packed under mixotrophic and photoheterotrophic conditions. There was a strong correlation between degree of chloroplast thylakoid packing and the excitation energy kept in PS II. These results suggested that the PS II activity was reduced by glycerol under mixotrophic conditions, thereby leading to repression of the photosynthetic activity.
Extensive studies of mixotrophic and photoheterotrophic growth of microalgae have been reported since the 1960s, such as Chlorella vulgaris (Karlander and Krauss 1966), Agmenellum quadruplicatum (Van Baalen et al. 1971), Cylindrotheca fusiformis (Darley et al. 1981), Dunaliella parva CCAP 19/9 (Hard and Gilmour 1996) and Micractinium pusillum (Bouarab et al. 2004), which are capable of photoassimilating different kinds of organic carbon substances for growth, such as glucose, acetate and glycerol. Many studies on light stress and light regulation of photosynthetic gene expression have been carried out with mixotrophic and photoheterotrophic grown cells (Steinbib and Zetsche 1986; Heifetz et al. 2000; Oesterhelt et al. 2007). Recently, much attention has been paid to the organic carbon substances that may have effects on photosynthetic activity and related processes.
Organic carbon assimilation induces a number of changes in both structure and function of the photosynthetic organization of various microalgae species. Vernotte et al. (1992) observed a 90% decrease of the Chl a content in Synechocystis sp. PCC 6714 cells grown photoheterotrophically with glucose, which resulted in blocking energy transfer to photosystem II (PS II) from its major antenna complex phycobilisomes. In Chlamydomonas reinhardtii cells grown mixotrophically, acetate reduced photosynthetic CO2 fixation and net O2 evolution, but did not cause significant effects on PS II efficiency (Heifetz et al. 2000). In the study of Pyrenomonas salina under photoheterotrophic conditions, Lewitus et al. (1991) reported that the addition of glycerol reduced the cell phycoerythrin content, phycoerythrin to chlorophyll a ratio, degree of thylakoid packing, number of thylakoids per cell, and PS II particle size. The authors suggested that enhancement of heterotrophic potential occurred at the expense of light-harvesting ability in glycerol-grown P. salina (Lewitus et al. 1991). However, in the studies of Anabaena variabilis ATCC 29413 (Mannan and Pakrasi 1993), Synechococcus sp. PCC 7002 (Kang et al. 2004), and Synechocystis sp. PCC 6803 (Wang et al. 2000), glucose enhanced the net photosynthesis rate and the PS II photochemical efficiency Φ II.
To date, much work on photosynthetic activity of microalgae by organic carbons has been focused on Cyanophyta, Chlorophyta, Rhodophyta, and Cryptophyta (Lewitus et al. 1991; Mannan and Pakrasi 1993; Heifetz et al. 2000; Oesterhelt et al. 2007). There is little information available about the photosynthetic response of diatom to organic carbons but such information is desired. Phaeodactylum tricornutum has been regarded as a typical diatom in many studies. It does not possess the heavily silicified cell wall, and its cell wall structure is characterized by separate platelets of silica rather than organized silicified frustules. This makes P. tricornutum an ideal organism for the physiological study of diatoms because its cell walls are easily ruptured in French press thereby preparation of cellular organelles is facilitated (Milner et al. 1950). It has been demonstrated that P. tricornutum is capable of using glycerol in the light for growth (Cooksey 1974; García et al. 2000, 2005). In the present study, the photosynthetic response of P. tricornutum to glycerol was studied. The content of pigment, 77 K fluorescence spectra, and chloroplast ultrastructure were examined with the photoautotrophic, mixotrophic, and photoheterotrophic strains.
Results
Effects of glycerol on the growth and content of photosynthetic pigments
Using glycerol as the carbon source for mixotrophic culture, specific growth rate was the fastest value among different conditions. The addition of glycerol resulted in significant decreases in the content of Chl a, Chl c, and carotenoid compared with those under photoautotrophic conditions (Table 1). Under photoheterotrophic conditions, content of Chl a, Chl c, and carotenoid were decreased to 53.26%, 44.83%, and 60.58% compared with those under photoautotrophic conditions, respectively. Under mixotrophic conditions, content of Chl a, Chl c, and carotenoid were decreased to 19.57%, 13.79%, and 13.46%, respectively. Under mixotrophic and photoheterotrophic conditions, Chl a to Chl c ratios were both decreased. Carotenoid to Chl a ratio was increased under mixotrophic conditions, but the ratio was decreased under photoheterotrophic conditions. The results suggested that decrease of Chl a content was greater than differences in the content of Chl c and carotenoid.
| Growth conditions | Specific growth rate | Pigment content (10−7μg/cell) | Chl a/Chl c CAR | CAR/Chl a | ||
|---|---|---|---|---|---|---|
| Chl a | Chl c | |||||
| Photoautotrophy | 0.11 ± 0.01 | 0.92 ± 0.04 | 0.29 ± 0.02 | 1.04 ± 0.02 | 3.17 ± 0.04 | 1.13 ± 0.03 |
| Mixotrophy with glycerol | 0.16 ± 0.01 | 0.74 ± 0.04 | 0.25 ± 0.06 | 0.90 ± 0.08 | 2.96 ± 0.02 | 1.22 ± 0.03 |
| Photoheterotrophy with glycerol | 0.08 ± 0.01 | 0.43 ± 0.04 | 0.16 ± 0.01 | 0.41 ± 0.04 | 2.69 ± 0.18 | 0.95 ± 0.00 |
- CAR, carotenoid; Chl a, chlorophyll a; Chl c, chlorophyll c. Each value is the mean of three measurements ±SE.
Effects of glycerol on 77 K fluorescence emission spectra
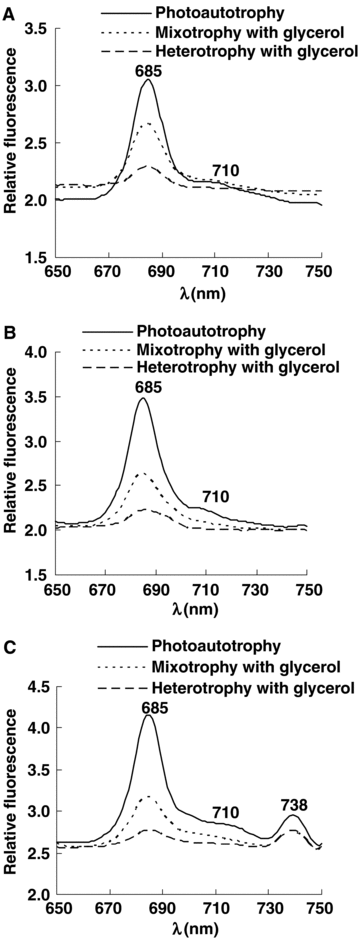
Fluorescence emission spectra at 77 K were measured to analyze stoichiometry and composition of PS I and PS II (Figure 1). When fluorescence was excited at 440 nm (Chl a absorption peak) and 465 nm (Chl c absorption peak), there were major emission bands at 685 nm (F685) and shoulder bands at 710 nm (F710). When fluorescence was excited at 495 nm (carotenoid absorption peak), there were major emission bands at 685 nm (F685) and 738 nm (F738), and shoulder bands at 710 nm (F710). Among these, F685 was emitted from PS II, F710 and F738 originated from PS I. These data indicated that the light energy absorbed by Chl a, Chl c and carotenoid was transferred to both PS II and PS I in these cells.

77 K fluorescence emission spectra of Phaeodactylum tricornutum under photoautotrophic, mixotrophic, and photoheterotrophic conditions.Fluorescence was excited at (A) 440 nm; (B) 465 nm; (C) 495 nm. The cells were adjusted to the same chlorophyll absorbance near 680 nm.
Glycerol did not shift the fluorescence emission peaks, but lowered the fluorescence intensity. Under mixotrophic and photoheterotrophic conditions, the ratios of F685/F710 and F685/F738 were both lowered, and the decrease range was greater under photoheterotrophic conditions (Table 2). Therefore, there was a relative decrease in fluorescence emission from PS II when glycerol was added, suggesting that PS II activity was decreased under mixotrophic and photoheterotrophic conditions.
| Growth conditions | Maximum fluorescence 685 nm | F685/F710 | F685/F738 | ||
|---|---|---|---|---|---|
| 710 nm | 738 nm | ||||
| Photoautotrophy | 4.16 | 2.86 | 2.94 | 1.46 | 1.41 |
| Mixotrophy with glycerol | 3.17 | 2.69 | 2.76 | 1.18 | 1.15 |
| Photoheterotrophy with glycerol | 2.77 | 2.61 | 2.76 | 1.06 | 1.00 |
- Fluorescence was excited at 495 nm. F685, fluorescence at 685 nm; F710, fluorescence at 710 nm; F738, fluorescence at 738 nm.
Effects of glycerol on 77 K fluorescence excitation spectra
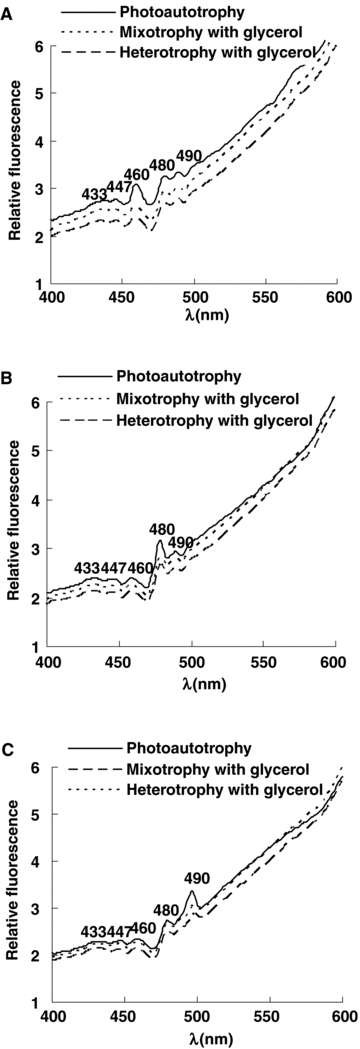
Based on the fluorescence emission spectra, fluorescence was emitted at 685 nm, 710 nm, and 738 nm (Figure 2). Under photoautotrophic, mixotrophic and photoheterotrophic conditions, there were five excitation bands: 433 nm and 447 nm originated from Chl a, 460 nm originated from Chl c, 480 nm and 490 nm were emitted from carotenoid. These data suggested that the energy of Chl a, Chl c and carotenoid were coupled together. The fluorescence excitation peaks were not changed and the fluorescence intensity were lowered. These results were accompanied by the fluorescence emission spectra.

77 K fluorescence excitation spectra of Phaeodactylum tricornutum under photoautotrophic, mixotrophic, and photoheterotrophic conditions.Fluorescence was emitted at (A) 685 nm; (B) 710 nm; (C) 738 nm. The cells were adjusted to the same chlorophyll absorbance near 680 nm.
Effects of glycerol on chloroplast ultrastructure
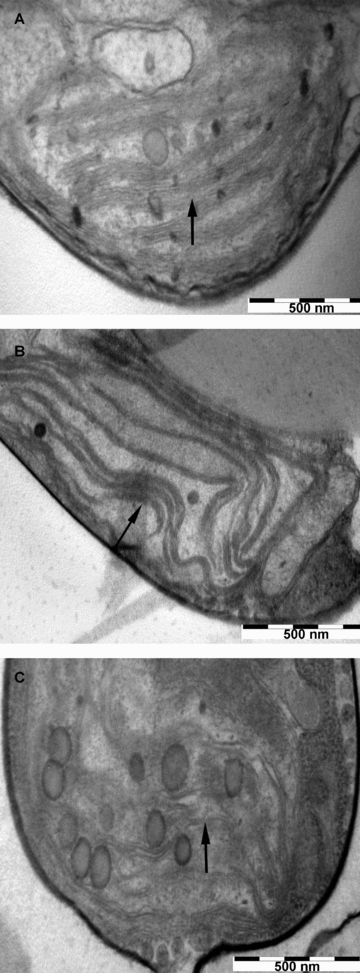
The thin-section electron microscopy (TEM) revealed obvious ultrastructural differences among the three treatments (Figure 3). Under photoautotrophic conditions, the thylakoids were predominantly arranged in pairs, and there was a strong tendency for thylakoid pairs to run parallel to each other (Figure 3A). Cells grown under mixotrophic conditions contained less thylakoid pairs, lamellar structures were bended, and the interspaces between lamellar structures were larger (Figure 3B). Cells grown under photoheterotrophic conditions almost contained no thylakoid pairs (Figure 3C). In general, thylakoid pairs were more tightly packed in cells grown under photoautotrophic conditions than those in glycerol-grown cells.

Thin-section electron micrographs of Phaeodactylum tricornutum under (A) photoautotrophic; (B) mixotrophic; and (C) photoheterotrophic conditions.Bar, 500 nm. The arrows identify the thylakoid pairs.
Discussion
Chlorophyll a, c, and carotenoid are the key photosynthetic pigments of P. tricornutum. Chl c, carotenoid and most Chl a play as the light-harvesting pigments and some Chl a act as reaction-center pigments. After a long period of adaptation to mixotrophic and photoheterotrophic conditions, the contents of photosynthetic pigments were reduced in P. tricornutum. Smart et al. (1991) observed a 75% Chl a decrease in Synechococcus sp. PCC 6803 under photoheterotrophic conditions. This decrease was brought about mainly through a decrease in the number of PS I units, leading to a decrease in the ratio of PS I/PS II. In Synechocystis sp. PCC 6714 cells grown photoheterotrophically, there was a 90% decrease in the Chl a content, which resulted in a block in energy transfer to PS II from its major antenna complex phycobilisomes (Vernotte et al. 1992). The decrease of Chl b content was greater than that of Chl a in Chlamydomonas reinhardtii (Hoober et al. 1990). On the other hand, there are some microalgae in which the contents of photosynthetic pigments increase a little, such as C. humicola (Laliberté and De La Noue 1993). In A. variabilis ATCC 29413, dark heterotrophic growth conditions resulted in an increase in the content of phycobilin and the number of PS II units, whereas the number of PS I units remained unchanged (Mannan and Pakrasi 1993). There were also several microalgae that only showed small changes in pigment composition, such as Spirulina platensis (Marquez et al. 1993).
Low temperature fluorescence spectra proceed at 77 K, and at this temperature all of the physiological and biochemical reactions cease; there is only the light energy transfer process, so it is an easy and feasible method to indicate the energy transfer between the photosynthetic systems (Vernotte et al. 1992; Chen et al. 2002; Liao and Xu 2007). Under mixotrophic and photoheterotrophic culture of P. tricornutum, the fluorescence peaks were not changed, but the fluorescence intensity was lower. It has been widely accepted that 77 K fluorescence spectra indicates the energy flow between PS II and PS I (Vernotte et al. 1992; Mannan and Pakrasi 1993; Wang et al. 2005). The amount of excitation energy kept in PS II indicates the photosynthetic efficiency (Lichtenthaler et al. 1981). Glycerol induced the excitation energy to redistribution between PS I and PS II. The ratios of F685/F710 and F685/F738 were both decreased, indicating that more energy was kept in PS I. Therefore, glycerol-grown cells depressed the photosynthetic efficiency. Similar results have been shown in glucose-grown Synechocystis sp. PCC 6714 cells (Vernotte et al. 1992), glucose-grown Galdieria sulphuraria cells (Oesterhelt et al. 2007), and acetate-grown C. reinhardtii cells (Endo and Asada 1996; Heifetz et al. 2000) under mixotrophic and heterotrophic conditions. However, there is little effect of organic carbon sources on PS II activity, such as fructose-grown A. variabilis ATCC 29413 cells (Valiente et al. 1992). There are also some exceptions. Mannan and Pakrasi (1993) observed that after 6 months acclimation, the ratios of F685/F735 and F695/F735 were enhanced in fructose-grown A. variabilis ATCC 29413 cells, suggesting that more excitation energy was kept in PS II.
The polymorphism of chloroplast ultrastructure is closely related to its function. Chloroplast has a completely developed membrane system, especially the differentiation of thylakoid organization, which results in the high concentration of the light-harvesting system in chloroplast (Anderson et al. 1973). PS II and PS II light-harvesting complex (LHC II) are mainly distributed in stacking grana lamella, but PS I and PS I light-harvesting complex (LHC I) are mainly distributed in stroma lamella and unstacking grana lamella (Garab and Mustárdy 1999). The distributions of PS II and PS I are not uniform, so the relative units of PS II and PS I are related to the degree of grana lamella and stroma lamella (Melis 1984). It is generally believed that the degree of thylakoid packing could determine the photosynthetic strength (Anderson 1981). In Pyrenomonas salina under heterotrophic conditions, the addition of glycerol reduced the degree of thylakoid packing and the number of thylakoids per cell, suggesting that enhancement of heterotrophic potential occurred at the expense of light-harvesting ability (Lewitus et al. 1991). The degree of thylakoid packing was significantly reduced under mixotrophic and photoheterotrophic conditions of P. tricornutum. The differences of the chloroplast ultrastructure brought about the redistribution of excitation energy between PS II and PS I, and the excitation energy was reduced in PS II. This was consistent with the 77 K fluorescence spectra. The results suggested that glycerol reduced the PS II activity of P. tricornutum; therefore the photosynthetic efficiency was depressed.
Materials and Methods
Organism and growth conditions
Phaeodactylum tricornutum was obtained from the Institute of Hydrobiology, Jinan University (Guangzhou, China). Batch cultures (100 mL volume) were grown in f/2 medium (Guillard and Ryther 1962) in 250 mL flasks without aeration under aseptic conditions. Cultures were illuminated with white fluorescent light (50 μmol/m2 per s) on a 12:12 h light-dark cycle at 20 °C. The pH of the medium was 7.4, and the salinity was 30‰.
For mixotrophic and photoheterotrophic treatments, the media were supplied with 100 mmol/L glycerol, and the medium was also supplied with 10−6 M 3-(3,4-dichlorophenyl)-1,1-dimethylurea (DCMU) under photoheterotrophic culture. Glycerol was sterilized by filtration through 0.22 μm pore membranes. Cultures used for inocula were acclimatized to the organic media by repeated transfer of cells in the midexponential growth phase into fresh media. After 3 months of repeated transfers, the cells were acclimatized to the organic media, and there were no significant differences in the growth rate of several sequential cultures. After acclimation to the organic media, exponentially growing populations were inoculated into fresh media to start the experiment. The culture medium was supplemented with 50 μg/mL kanamycin sulfate to help minimize bacterial contamination during repeated transfers under mixotrophic and photoheterotrophic growth conditions. Cultures were tested for bacterial contamination throughout the experiment by inoculating tubes containing f/2 medium plus 1.5% yeast extract with 1 mL of the culture and examining these tubes for bacterial growth. All parameters were made in triplicate.
Determination of cell growth and pigment
Cell counts were determined using CASY-TT Schärfe-System (ALIT, Germany). Chl a and Chl c concentrations were determined according to the method of Jeffrey and Humphrey (1975). The absorbency of samples at 664 nm, 647 nm, 630 nm, and 750 nm were measured. Carotenoid concentration was determined according to Wellburn (1994). The absorbency of samples at 662 nm, 646 nm, and 440 nm were measured.
77 K fluorescence spectra
Fluorescence spectra at 77 K was recorded by a F-4500 fluorescence spectrophotometer (Hitachi, Japan). The cells were adjusted to the same chlorophyll absorbance near 680 nm. The scanning speed was 240 nm/min with a 2 nm slit width. Chl a fluorescence emission spectra were excited at 436 nm, 465 nm and 495 nm, and the scanning scope was 650 nm to 750 nm. Chl a fluorescence excitation spectra were emitted at 685 nm, 710 nm and 738 nm, and the scanning scope was 400 nm to 550 nm.
Chloroplast ultrastructure
Cells were harvested by centrifugation and fixed with glutaraldehyde (2.5% final concentration) in 0.1 M phosphate buffer for 24 h. After being repeatedly washed in phosphate buffer, cells were postfixed in 1% OsO4 in phosphate buffer for 4 h. After the same washing, cells were dehydrated in a graded ethanol series and embedded in Spurr's low-viscosity resin. Cells were cut with a Leica-S microtome (Wetzlar, Germany). Ultrathin sections were stained with uranyl acetate and lead citrate, and examined with a TECNAI 10 (Philips, Netherlands) electron microscope.
(Handling editor: Mark Tester)


