Coexpression of Donor Peptide/Recipient MHC Complex and Intact Donor MHC: Evidence for a Link between the Direct and Indirect Pathways
Abstract
T lymphocytes recognize foreign antigens presented by donor or recipient cells through the direct and indirect pathways respectively. This raises the question of how directly and indirectly activated T cells interact. A 4-cell model involving the interaction of CD4+ and CD8+ T cells recognizing major histocompatibility complex (MHC) class II on recipient antigen presenting cell (APC), and MHC class I on donor APC, has been proposed. However, this would require complex co-ordination between all the participating cell types. The semidirect pathway of alloantigen presentation suggests a simpler mechanism. Although exchange of MHC class II molecules between donor and recipient cells has been described, coexpression of recipient MHC molecules presenting donor derived allopeptides (indirect presentation) and donor MHC (direct presentation) on the same cell, a key requirement for the semidirect alloantigen presentation pathway, has not been demonstrated. We have used a mouse transplantation model to demonstrate the presence of cells expressing both donor MHC class I/II molecules, and a donor MHC class II peptide in the context of a recipient MHC class II molecule. This would allow indirectly activated CD4+ T cells to regulate directly activated CD4+ T cells, or to help directly activated CD8+ T cells, thus providing physical evidence for the semidirect pathway.
Abbreviations:
-
- APCs
-
- antigen presenting cells
-
- MHC
-
- major histocompatibility complex
-
- Y-Ae molecule
-
- donor MHC class II I-Ed 52-68 peptide presented in the context of recipient MHC II I-Ab recognized by the Y-Ae antibody
Introduction
The adaptive immune response against an allograft is initiated against donor antigens presented in two different ways—via the direct and indirect pathways. The direct pathway involves the recognition by recipient T cells of intact donor major histocompatibility complex (MHC) molecules presented by donor antigen presenting cells (APCs). The indirect pathway of allorecognition is more conventional, involving the uptake of donor MHC molecules and other nonself proteins (minor antigens) by recipient APCs, which are processed into allopetides, and presented by recipient APCs in the context of self-MHC molecules, allowing recognition by self-restricted T cells.
In normal immune responses, CD4+ and CD8+ T cells interact by recognizing MHC class II and I respectively on the same APC. It has previously been shown that indirectly activated CD4+ T cells can either help (1) or regulate (2) directly activated CD8+ T cells, despite the fact that they recognize MHC molecules on different APCs (recipient vs. donor). Bystander activation, or alternatively, a 4-cell model involving the interaction of CD4+ and CD8+ T cells recognizing MHC class II on recipient APC, and MHC class I on donor APC respectively, has been proposed to explain this conundrum (1). However, this would involve complex co-ordination between all the participating cell types, including the juxtapositioning of recipient and donor APCs. The recently proposed semidirect pathway of alloantigen presentation as a result of intercellular MHC transfer between donor and recipient cells provides a simpler mechanism (3). Although exchange of MHC class II molecules between donor and recipient cells has been described following vascularized organ transplantation (4), the coexpression of recipient MHC molecules presenting donor derived alloeptides (indirect presentation), and donor MHC class I and/or II MHC molecules (direct presentation), a key requirement for the semidirect alloantigen presentation pathway, has not been demonstrated.
The transfer of cell surface molecules, including MHC classes I and II, between cells has been demonstrated both in vitro and in vivo (reviewed in Refs. 5 and 6). We have previously shown that cells expressing both donor and recipient MHC class II molecules can be found in the spleens of transplant recipients (4). If both donor MHC molecules and recipient MHC class II molecules presenting a donor peptide are expressed on the same APC, this would allow indirectly activated T cells to interact with directly activated T cells through the traditional 3-cell model.
Here, we utilized the Y-Ae antibody, which recognizes the donor MHC class II I-Ed derived 52-68 peptide presented in the context of recipient MHC II I-Ab (7) (abbreviated here as Y-Ae molecule), and antibodies against an intact donor MHC class I and II molecules to identify cells presenting donor peptides through both the indirect and direct pathways to provide evidence of the semidirect pathway of allopresentation in vivo.
Material and Methods
Mice
All animals were between the age of 8 and 12 weeks and used in accordance with the Animals (Scientific Procedures) Act 1986. Female C57BL/6 (H-2b), DBA/2 (H-2d), BALB/c (H-2d) and FVB (H-2q) mice were purchased from Harlan Limited (Bicester, UK). All mice were kept under specific pathogen-free conditions. Mouse renal and cardiac transplantation were performed as described previously (8,9).
Histological analysis
At various time points after transplantation, grafted organs and spleens from C57BL/6 recipients were harvested in optimal cutting temperature compound (Raymond A Lamb Ltd., Eastbourne, UK) and snap-frozen in liquid nitrogen. Five micrometer thick sections were cut and stained with the appropriate antibodies: anti-I-Ad (clone AMS-32.1), antimouse Ea52-68 peptide bound to I-Ab (Y-Ae) (clone eBioY-Ae), anti-H-2Kd (clone SF1–1.1), anti-CD11c (clone N418), anti-CD68 (clone FA-11), anti-CD19 (clone 1D3), anti-CD40 (clone 3/23) and anti-CD86 (clone GL1). Antibodies were biotinylated (anti-I-Ad, anti-Y-Ae) or biotinylated secondaries were used (polyclonal goat antirat [CD68, CD19, CD40, CD86], mouse antihamster cocktail [CD11c]), except anti-Y-Ae and anti-H-2Kd, which were conjugated to FITC. All antibodies were purchased from Pharmingen (San Diego, CA, USA) except anti-Y-Ae (ebioscience, Hatfield, UK), anti-CD11c (both Cambridge Bioscience, Cambridge, UK) and anti-CD68 (Serotec, Oxford, UK). Cells were labeled by addition of streptavidin conjugated to phycoerythrin (PE) (Pharmingen), or aminomethylcoumarin (AMCA) (Vector Laboratories, Burlingame, CA, USA), and excess biotin/streptavidin was blocked between each antibody using an avidin/biotin blocking kit (Vector Laboratories). Staining was visualized using a Leica microscope with three fluorescence filters (Leica Microsystems, Wetzlar, Germany) and digital overlay was carried out using ACT-1 and LUCIA G software (both Nikon Corporation, Tokyo, Japan). Positive cells were counted in 20 random high-power fields (HPFs, ×400) of each sample by two independent observers masked to the experimental conditions. Results were expressed as means ± SE.
Confocal microscopy was performed using 15 μm thick sections, a Nikon Eclipse TE2000-U microscope (Nikon Corporation) with an argon (wavelength 488 nm) and a helium neon laser (wavelength 543 nm). Conventional images and z stacks were taken with EZ-C1 3.10 software (Nikon Corporation).
Statistics
Student's t-test was used to test for differences in percentages of cells staining positive for various markers.
Results
Coexpression of antigens of the direct and indirect pathways on the same APC
Donor MHC class I and Y-Ae molecules: Using H-2d to H-2b mouse kidney allograft recipients, 8 days after transplantation, sections of recipient spleens were stained for the expression of the donor MHC class I molecule Kd and the donor MHC class II I-Ed 52-68 peptide presented in the context of recipient MHC II I-Ab (Y-Ae). Cells positive for both were seen, demonstrating the existence of the semidirect pathway of allopresentation in vivo (Figures 1A–C). Approximately 25% of Y-Ae+ cells also expressed H-2Kd, linking the direct and indirect pathway (of 0.6 ± 0.09 Y-Ae+ cells per HPF, 0.15 ± 0.04 also expressed H-2Kd) (Figure 2). Spleens of C57BL/6 recipients of 3rd party FVB allografts did not show any staining for the Y-Ae molecule (data not shown).
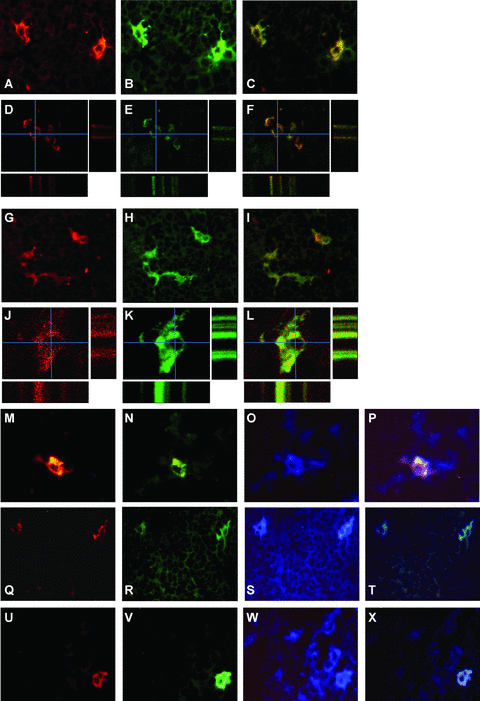
Immunohistochemistry on frozen sections of spleens of C57BL/6 kidney transplant recipients. Staining for recipient MHC class II presenting a donor peptide (Y-Ae, PE) (A), donor MHC class I (H-2Kd, FITC) (B) and digital overlay showing double-positive cells (C). Confocal microscopy showing colocalization of Y-Ae (PE) (D) and donor MHC class I (H-2kd, FITC) (E) and digital overlay (F). Main panels: cross-section of double-positive cells, demonstrating the presence of donor H-2Kd and Y-Ae molecules on the cell surface. Bottom panel: z-stack taken through the cell at the position of the horizontal blue line. Right panel: z-stack taken through the cell at the position of the vertical blue line. No staining could be seen within the cytoplasm of the cells. Staining for donor MHC class II(I-Ad, PE) (G), Y-Ae (FITC) (H) and digital overlay showing double-positive cells (I). Confocal microscopy showing colocalization of donor MHC class II (I-Ad, PE) (J), Y-Ae (FITC) (K) and digital overlay (L). Main panels: cross-section of a double-positive cell, demonstrating the presence of donor I-Ad and Y-Ae molecules on the cell surface. Bottom panel: z-stack taken through the cell at the position of the horizontal blue line. Right panel: z-stack taken through the cell at the position of the vertical blue line. No staining could be seen within the cytoplasm of the cell. (M–P) Determination of the lineage of double-positive cells. Spleen sections were stained for donor MHC class II (PE) (M), Y-Ae (FITC) (N) and CD11c (AMCA) (O), with the digital overlay (P) showing a triple-positive cell. (Q–X) Determination of the activation state of double-positive cells. Spleen sections were stained for donor MHC class II (PE) (Q, U), Y-Ae (FITC) (R, V) and CD40 (S) or CD86 (W) (AMCA), with the digital overlays (T, X) showing triple-positive cells. Original magnifications ×400; except (D–F) and (J–L), ×600.
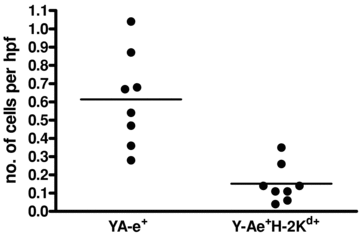
Presence of donor MHC class I and Y-Ae double-positive cells in spleens of kidney transplant recipients 8 days after transplantation. Spleen sections were stained for Y-Ae and the donor MHC class I molecule H-2Kd.
The donor MHC class I molecule and recipient Y-Ae molecule can only take part in the antigen presentation process if they are on the cell surface of the APC. To investigate this, confocal microscopy was carried out on spleen sections (Figures 1D–F). The main panels show a cross-section of the cell. The bottom panel shows a z-stack taken through the cell at the point of the horizontal blue line, while the right panel shows a z-stack taken through the cell at the point of the vertical blue line. Both the donor MHC class I and the Y-Ae molecules were seen expressed only on the surface of cells as a thin fluorescent rim and not within the cytoplasm, and therefore were available for interactions with CD8+ and CD4+ T cells from the direct and indirect pathways respectively.
MHC class II and Y-Ae molecules: Staining spleens of transplant recipients 8 days after transplantation for the donor MHC class II molecule I-Ad and Y-Ae revealed cells expressing both molecules (Figures 1G–I). These cells were present after BALB/c kidney, DBA/2 kidney and DBA/2 heart transplantation, at all time points analyzed (Figure 3). The percentage of I-Ad+ cells which also expressed Y-Ae peaked at 44.17 ± 13.41%, but was generally below 20% of cells (Figure 3A). The percentage of Y-Ae+ cells which also expressed I-Ad was much higher, generally between 30% and 40%, and peaking at 59.07 ± 21.56% (Figure 3B). This difference was explained by the relative frequencies of I-Ad+ and Y-Ae+ cells, with at least double the amount of I-Ad+ cells compared with Y-Ae+ cells at all time points (Figure 3C), even surprisingly at later time points, where the indirect pathway becomes dominant (10) as the direct pathway response wanes (11). This would mean that Y-Ae+ cells are more likely to encounter an I-Ad+ cell than vice versa, increasing the transfer of MHC in this direction. Confocal microscopy confirmed that both molecules were expressed on the cell surface (Figures 1J–L).
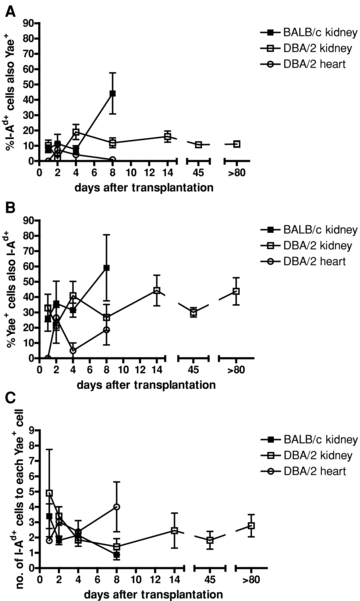
Percentages of double-positive cells in spleens of BALB/c kidney (▪), DBA/2 kidney (□) and DBA/2 heart (°) transplant recipients. (A) The percentage of donor MHC class II (I-Ad) positive cells also positive for Y-Ae. (B) The percentage of Y-Ae+ cells also positive for I-Ad. The differences in the percentages of double-positive cells in the I-Ad+ and Y-Ae+ populations were explained by the ratio of I-Ad+ to Y-Ae+ cells (C). n = 4–6 for each time point.
Cell types involved in direct and indirect presentation
Cells expressing both directly and indirectly presented donor antigens can only link the two pathways if they are capable of interacting with recipient T cells to initiate an alloimmune response i.e. they must be APCs. To answer this question, we stained for I-Ad, Y-Ae, plus either CD11c (dendritic cells), CD19 (B cells) or CD68 (macrophages) (Figures 1M–P).
The majority of double-positive cells were found to be dendritic cells, with some macrophages and a smaller proportion of B cells. In the case of dendritic cells and macrophages, a similar proportion of double-positive cells were positive for CD11c and CD68 respectively as single positive Y-Ae+ or I-Ad+ cells. With respect to B cells, a larger proportion of double-positive cells were CD19+ than the single positive Y-Ae+ population (Figure 4).
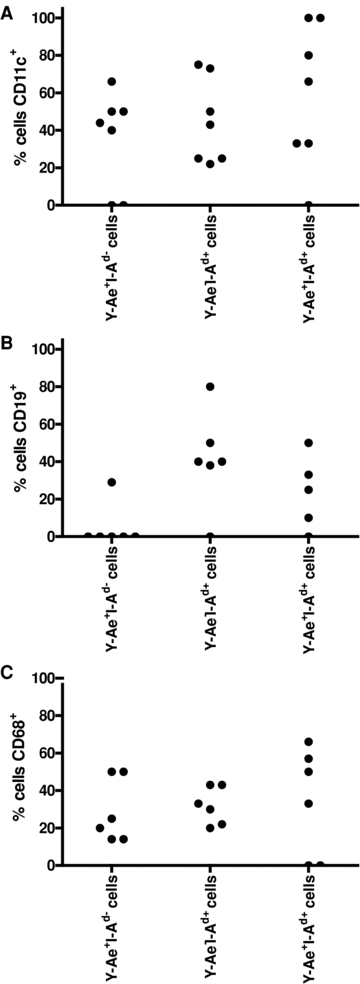
Determination of the lineages of double-positive cells. Spleen sections of kidney transplant recipients were stained for donor I-Ad, Y-Ae and either CD11c (to identify DCs) (A), CD19 (specific for B cells) (B) or CD68 (expressed on macrophages) (C). The percentages of Y-Ae+I-Ad−, Y-Ae−I-Ad+ and Y-Ae+I-Ad+ double-positive cells expressing each lineage marker were calculated.
Activation status of cells involved in direct and indirect presentation
For APCs presenting antigen through the direct and indirect pathways to initiate an effective T cell alloresponse, they must also express costimulatory molecules. To determine this, spleen sections were stained for I-Ad, Y-Ae, plus either CD40 or CD86 (Figures 1Q–X). The vast majority of I-Ad and Y-Ae double-positive cells also expressed CD40 and CD86 (90 ± 10% and 95 ± 5% respectively) (Figure 5), suggesting that they were capable of stimulating T cells. In fact, the percentage of cells expressing these molecules was significantly higher in the double-positive population than in either the Y-Ae+ only (13.2 ± 8.1% and 12.8 ± 4.1% positive for CD40 and CD86 respectively) or I-Ad+ only (32 ± 5.2% and 40.2 ± 4.4% positive for CD40 and CD86 respectively) populations, suggesting that the Y-Ae/I-Ad double-positive cells have a more activated phenotype.
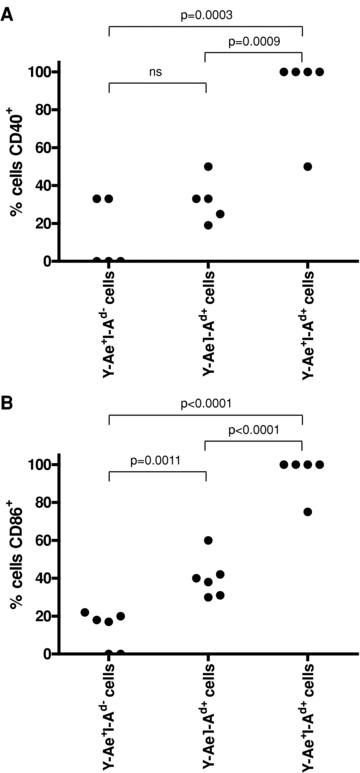
Determination of the activation states of double-positive cells. Spleen sections of kidney transplant recipients were stained for donor I-Ad, Y-Ae and either CD40 (A), or CD86 (B). The percentages of Y-Ae+I-Ad−, Y-Ae−I-Ad+ and Y-Ae+I-Ad+ double-positive cells expressing each costimulatory molecule were calculated.
Discussion
Our data provide evidence for the linkage of the direct and indirect pathways of allopresentation in vivo, through cells that express both donor MHC molecules, and recipient MHC class II molecules expressing a donor MHC class II peptide. In the case of donor MHC class II molecules, this would allow interaction of directly and indirectly activated CD4+ T cells. This would mean that CD4+CD25+ regulatory T cells, which are thought to be activated mainly through the indirect pathway (12), regulate directly activated CD4+ effector T cells. Cells expressing both molecules were APCs, and also expressed the costimulatory molecules required to initiate an effective alloimmune response. Cells shown by our experiments to express both donor MHC class I molecules and a donor peptide presented on recipient MHC class II molecules provide evidence for the existence in vivo of the semidirect pathway of allopresentation, whereby indirectly activated CD4+ T cells could provide help for directly activated CD8+ T cells.
The number of Y-Ae+ cells was always less than the number of I-Ad+ cells. This is despite the known decrease of the direct pathway of allopresentation late after transplantation as the donor passenger leukocytes are deleted (11), and the indirect pathway takes over (10). This discrepancy may be due to the fact that we only stained for one donor peptide/recipient MHC complex, which may account for only a small proportion of the indirect response, or the persistence of donor MHC class II molecules due to their transfer onto recipient cells.
Due to the deletion of donor APC, it may be that at later time points the direction of MHC class II transfer is more likely to be from donor to recipient cells. Although we did not look specifically at the direction of MHC class II transfer, we have previously shown that donor and recipient MHC class II are transferred in a bidirectional manner (4), and there is evidence to suggest that this is also the case here. In confocal microscopy (Figures 1J–L), the Y-Ae-FITC staining is much stronger than the I-Ad-PE staining, suggesting that a recipient cell has acquired donor MHC class II molecules. In contrast, in Figures 1M and N, the I-Ad-PE staining is stronger than the Y-Ae-FITC staining, suggesting that in this case a donor passenger leukocyte has acquired Y-Ae from a recipient cell.
The level of expression of the transferred MHC molecule cannot be determined accurately in vivo using the methods we have employed here. However, the level of expression by the ‘recipient’ cell is generally thought to be between 5% and 16% of that of the cell donating the MHC molecule (13).
We have demonstrated that APCs are capable of forming a link between the direct and indirect pathways of antigen presentation, through transfer of MHC molecules, including self-MHC class II molecules that present a donor derived allopeptide. This provides physical proof that the two pathways of antigen presentation can be linked, which could be the mechanism through which CD4+ T cells of the indirect pathway regulate CD8+ T cells of the direct pathway.
Disclosure
The authors of this manuscript have no conflicts of interest to disclose as described by the American Journal of Transplantation.


