Diffusion Tensor Imaging of Guillain-Mollaret Triangle in Patients with Hypertrophic Olivary Degeneration
Conflict of Interest: There are no conflicts of interest.
J Neuroimaging 2011;21:145-151.
ABSTRACT
The aim of the study is to analyze diffusion tensor imaging (DTI) characteristics of the Guillain-Mollaret triangle (GMT) in patients with hypertrophic olivary degeneration (HOD) and to investigate their correlation with previously reported histopathology. DTI was performed in 10 patients diagnosed with HOD. Fractional anisotropy, apparent diffusion coefficient, axial diffusivity, and radial diffusivity were measured in the inferior olivary nucleus (IO), the central tegmental tract, the red and the dentate nuclei, and the superior cerebellar peduncle of HOD patients and compared to age, sex, and side-matched 10 neurologically normal population. The prominent finding on DTI in affected IO was an increase in radial diffusivity compatible with demyelination. While conventional magnetic resonance imaging did not show any sign of involvement in the other components of GMT, DTI demonstrated signal changes in all anatomical components of the GMT. Main DTI findings in GMT of patients with HOD were an increase in radial diffusivity representing demyelination and an increase in axial diffusivity that is reflective of neuronal hypertrophy. DTI parameters can reflect the spatiotemporal evolution of transneuronal degeneration associated with HOD in a manner consistent with the known pathologic stages of HOD.
Introduction
Hypertrophic olivary degeneration (HOD), usually characterized by symptomatic palatal tremor, is a rare and unique type of transneuronal degeneration involving the inferior olivary (IO) nucleus, which occurs secondary to lesions in the components of the Guillain-Mollaret triangle (GMT).1 GMT is composed of the contralateral dentate nucleus, the ipsilateral red nucleus, and the inferior olivary nucleus.1 The ipsilateral central tegmental tract, the contralateral superior cerebellar peduncle, and the inferior cerebellar peduncle form the connecting pathways of these three structures.1 Lesions anywhere on this network may result in HOD. On conventional magnetic resonance imaging (MRI), signal intensity changes in the IO are typically observed about 1 month after lesion onset in the GMT.2–5 IO gradually increases in size, reaching a peak at about 8.5 months.2 From this stage on, the size remains stable until the 24th month. Thereafter, IO gradually starts to decrease in size. Olivary hyperintensity on T2 weighted images usually persists for years.2 But even at a very late stage conventional MRI rarely demonstrates changes in the central tegmental tract, the superior cerebellar peduncle, the dentate, and red nucleuses, if they are not host of the inciting lesion.6 In contrast, post-mortem studies of HOD reveal that there is an ongoing dynamic process, starting just after the occurrence of the inciting lesion and extending several years thereafter.4,5
Although conventional MRI is a valuable tool in the diagnosis of HOD, it is not sensitive to dynamic histopathological changes known to occur in these patients. Therefore, we have hypothesized that these complex changes in patients with HOD, including hypertrophic changes in neurons, axonal degeneration, demyelination, and astrocytic hypertrophy, could be investigated by DTI.7 The aim of the study is to assess the pattern of DTI parameters in GMT of patients with HOD, and to relate the directional diffusivities with the known underlying pathologic stages of HOD.
Materials and Methods
Patients
Ten patients (3 female and 7 male) who were diagnosed as HOD according to clinical symptoms and MRI findings at our hospital between January 2005 and June 2009 were selected for the study. Mean patient age was 49 (range 16–77). Internal review board of our hospital approved the study, and written informed consent was obtained from all subjects. Conventional MRI and DTI were performed in all patients. DTI could not be performed at standard intervals for every patient due to different timing of admission to the hospital and of initial diagnosis. In one patient, MRI and DTI were obtained three times: 21 days and 11 and 23 months after occurrence of the inciting lesion. Another patient was studied 5 times after the onset of disease: at 8, 12, 32, 38, and 44 months. In the remaining 8 patients, DTI was performed only once. The time interval between inciting lesion and DTI of patients ranged from 21 days to 60 months. Demographic and clinical profiles of patients with HOD are summarized in Table 1.
| Patient no | Age/sex | Inciting lesion | Palatal Tremor | Location of HOD | Hypertrophy in IO | Time of DTI and MRI |
|---|---|---|---|---|---|---|
| 1 | 56/M | Right DN resection due to hemangiopericytoma | Present | Left | Present | 8th, 12nd, 32nd, 38th and 44th months |
| 2 | 51/M | Left CCT/SCP hematoma | Present | Bilateral, dominant in the left IO | Absent in the right | |
| Present in the left | 24th month | |||||
| 3 | 77/M | Right DN infarct | Present | Left | Absent | 21st month |
| 4 | 77/F | Left DN haemorrhage | Absent | Right | Absent | 60th month |
| 5 | 41/M | Left CCT/SCP cavernoma | Present | Bilateral, dominant in the left IO | Absent in the right present in the left | 21st days, 11th and 23rd months |
| 6 | 18/M | Left CCT/SCP resection due to pilocytic astrocytoma of brainstem | Absent | Bilateral, dominant in the left IO | Absent | 36th month |
| 7 | 51/F | Right DN infarct | Present | Left | Present | 24th month |
| 8 | 41/M | Left CCT resection during the surgery of pontine cavernoma | Present | Left | Present | 4th month |
| 9 | 61/M | R DN hematoma | Absent | Left | Absent | 36th month |
| 10 | 16/F | L CCT cavernoma | Absent | Left | Absent | 3rd month |
- M = male; F = female; DN = dentate nucleus; SCP = superior cerebellar peduncle; CCT = central tegmental tract; RN = red nucleus; IO = inferior olive; HOD = hypertrophic olivary degeneration; DTI = diffusion tensor imaging; MRI = magnetic resonance imaging.
Thirteen affected GMT were studied from 10 patients (both triangles from 3 patients). Thirteen GMTs were used from control subjects, which were selected from age, sex, and side matched 10 neurologically normal population.
Data Acquisition
All MRI examinations were performed in a 3T scanner (Trio, Siemens, Erlangen, Germany) using 8-channels head coil. Axial Turbo Spin Echo (TSE) T2, TSE T1, fluid-attenuated inversion recovery, sagittal, and coronal TSE T2 were obtained.
Single shot spin echo echo planar imaging (EPI) sequence was used to obtain diffusion weighted images (DWI). Sixty slices covering the whole brain were acquired with 2-mm × 2-mm × 2-mm isotropic resolution, time of repetition (TR) = 10,100 ms, time of echo (TE) = 100 ms, bandwidth = 1,300 Hz/pixels, field of view (FOV) = 256 × 256 mm, and scan time = 11.35 minutes. Parallel imaging was used with acceleration factor 2. The b-factor was set to 0 and 700 s/mm2. For generating the diffusion tensor, 60 uniformly distributed directions over the unit sphere were used.
Data Analysis
 (1)
(1) (2)
(2) (3)
(3) (4)
(4)Placement of ROI
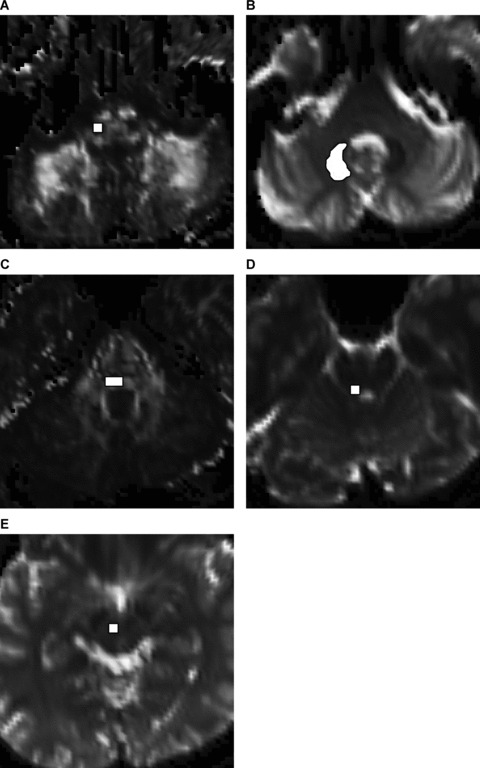
Using the FA maps, FA color maps and EPI T2 weighted images (b = 0 DWI), ROIs were placed manually on IO, the central tegmental tract, the superior cerebellar peduncle, the red nucleus, and the dentate nucleus of patients and the control subjects on consensus by two experienced radiologist (A.D., 16 years experience, and E.K., 8 years experience). The DWI datasets were chosen for ROIs selection, instead of other structural imaging data, to avoid any potential for misregistration related to patient motion and inconsistent geometric distortions between EPI and non-EPI sequence MR imaging. Furthermore, 2-mm isometric voxel DTI datasets allowed identification of different compartments of the brain stem.8 The size and the location of ROIs were standardized for each anatomical region. EPI T2, FA, and color FA were displayed alternatively to guide the selection of ROIs. Referring to anatomical knowledge, ROIs were placed on axial slices at five levels. Each ROI consisted of one slice only. In order to avoid variance in a subject at different time points or in different subjects, we chose nearly the same slice in each level to place ROIs. At each level, the shape and the area of ROIs were standardized to include a major part of relevant anatomical region and exclude any adjacent tissue. Only for pathological appearing IO on MRI, ROI was adjusted according to the size of the pathology. The first level at medulla through the inferior cerebellar peduncle was used for ROI of IO with four voxels (32 mm3) (Fig 1A). IO was easily defined as hypointense oval-shaped structure in FA map and as heterogeneous color in the color FA map.8 The second level at pons through the middle cerebellar peduncle was used for ROI of the dentate nucleus with 26 voxels (208 mm3). The dentate nucleus was clearly defined on EPI T2 as a hypointense structure with a characteristic shape (Fig 1B). The third level at pons through the fifth nerve entry zone was used for ROI of the central tegmental tract with 8 voxels (64 mm3) (Fig 1C). The fourth level through the upper part of pons was used for ROI of the superior cerebellar peduncle with 4 voxels (32 mm3) (Fig 1D). The fifth level through the upper part of midbrain was used for ROI of the red nucleus with 4 voxels (32 mm3) (Fig 1E). The ROI averages were then used to compare the change of DTI parameters in GMT in diseased and control locations.

(A) Positioning of ROI for FA, ADC, axial, and radial diffusivity on the right inferior olivary nucleus. (B) Positioning of ROI for FA, ADC, axial, and radial diffusivity on the right dentate nucleus. (C) Positioning of ROI for FA, ADC, axial, and radial diffusivity on the right central tegmental tract. (D) Positioning of ROI for FA, ADC, axial, and radial diffusivity on the right superior cerebellar peduncle. (E) Positioning of ROI for FA, ADC, axial, and radial diffusivity on the right red nucleus.
Statistical Analysis
Primarily, the difference in DTI parameters (FA, ADC, λ//, λ⊥) of IO in patients and control subjects were investigated by analysis of variance (ANOVA). Later, the DTI parameters in the rest of GMT were compared to control subjects by ANOVA. In this group the affected IO and location of the inciting lesion were excluded from statistical analysis. Bonferroni corrections were performed after ANOVA.
To investigate the dynamical progress of DTI parameters, FA, ADC, λ//, and λ⊥ were measured from IO of patient 5 during follow-up examinations and one-sample t-tests were used with the control data for each measurement.
Statistical calculations were performed in Matlab (Mathworks, Natick, MA). In all tests, difference was considered statistically significant at P < .05.
Results
MRI
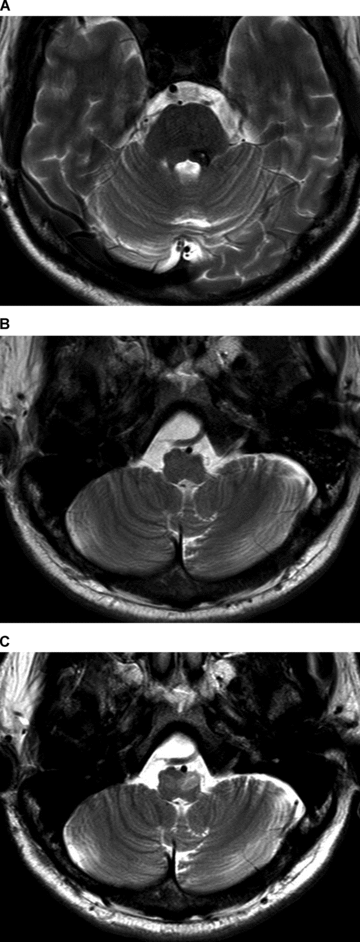
Conventional MRI demonstrated HOD and the inciting lesions in all examinations except the initial examination of patient 5 on the 21st day which showed only the inciting lesion, but not the signal changes in IO (Fig 2). While all IO with HOD demonstrated hyperintensity on T2 weighted images, only 5 out of 13 showed hypertrophy. IO displayed isointensity or hypointensity on T1 weighted images except in patient 3 whose T1 weighted images showed hyperintensity. We noticed that there were curved linear hyperintensities in 8 out of 13 IO with HOD on T2 weighted images (Fig 3). None of the conventional MRIs obtained from the patients with HOD revealed any sign of changes in GMT, except in IO and in location of inciting lesions.

(A) There is a hypointense lesion with central punctate hyperintensity in the left central tegmental tract extending to the left superior cerebellar peduncle compatible with pontine cavernoma on axial T2 weighted image. (B) On the early scan obtained 21 days after onset, axial T2 weighted image does not show any sign of HOD in IOs. (C) On the late scan obtained 11 months after onset, there is prominent hyperintensity with hypertrophy of the left IO compatible with HOD on axial T2 weighted image at the same level as the early scan. Also, there is slight hyperintensity of the right IO without hypertrophy.

Hyperintensity without hypertrophy of bilateral IOs compatible with HOD is seen. There is a curved hyperintensity in the central part of bilateral IOs.
DTI
DTI data derived from IO with HOD demonstrated several important findings when compared to controls (Fig 4). Radial diffusivity (λ⊥) showed the most significant difference (P < .001), which indicated an increase of 24%, followed by significant increase of 17% in ADC (P < .01). The decrease of FA by 36% and the increase of axial diffusivity (λ//) by 7% were not statistically significant.

DTI parameters in IO for patients with HOD and control subjects. All parameters (except FA, it is dimensionless) are given in the stated unit. Error bars indicate the standard errors. Statistical significances are displayed as *P < .05, **P < .01, ***P < .001.
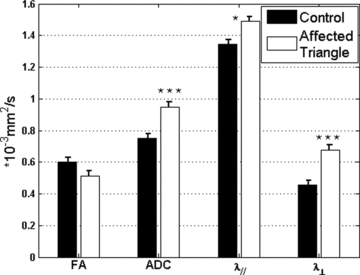
For the analysis excluding the IO and the inciting lesions, DTI parameters in the remaining regions of GMT also clearly demonstrated important findings (Fig 5). The most sensitive DTI parameters were radial diffusivity (λ⊥) by 48% increase (P < .001) and ADC by 26% increase (P < .001), followed by axial diffusivity (λ//) by 11% increase (P < .05). FA has shown 14% decrease with respect to control average. All changes (except FA) were observed to be statistically significant.

DTI parameters in affected GMT without inciting lesions and IOs. Error bars indicate standard errors. All parameters (except FA, it is dimensionless) are given in the stated unit. Statistical significances are displayed as *P < .05, **P < .01, ***P < .001.
DTI data derived from the early examination of patient 5 demonstrated the involvement of the IO before the appearance of any sign of HOD in conventional MRI. Initial DTI examination of patient 5 (on the 21st day) showed statistically significant increases, 18% in λ⊥ (P < .001), 14% in ADC (P < .001) and 10% in λ// (P < .01) and a 24% decrease in FA (P < .001) in left IO (dominant site) compared with controls. The DTI parameters continued to change progressively until the second examination; ADC, λ//, and λ⊥ increased 17%, 9%, and 23% with respect to the initial scan values. FA decreased 37% with respect to the initial scan correspondence. But in the right non-dominant IO of the patient 5, initial DTI showed decrease of 38% in FA (P < .001) and 15% in λ// (P < .01). There were only slight differences in ADC and λ⊥ (mostly 5%). In the second scan, 40% decrease in FA (P < .001) and 6% increase in ADC (P < .01) and 13% increase in λ⊥ (P < .01) were observed when compared with controls.
Discussion
In patients with a typical clinical presentation, the diagnosis of HOD can easily be confirmed by MRI demonstration of the inciting lesion. However, in certain cases radiological findings on MRI can be more subtle and difficult to demonstrate.1–3 Auffray-Calvier et al9 have shown a curved central hyperintensity in IO, 7 months after the onset of HOD. In our series, we observed the curved hyperintensity in 62% of cases, which we believe reflects the macroscopic laminar shape of IO, and is very helpful to support the diagnosis of HOD in complicated cases. Additionally, most radiological studies on HOD have dealt only with IO, which is only a component of a network forming the substrate of the disease. Despite the lack of morphological changes detectable on conventional MRI, all of our patients had demonstrable changes on DTI.
There are a few publications correlating radiological and histopathological findings in GMT of patients with HOD.3,6 We have hypothesized that the time course of histopathological changes in HOD could be studied in detail using DTI. This hypothesis is based on the similarities between wallerian and transneuronal degenerations. “Wallerian degeneration” refers to the histopathological changes in the distal segment of the transected axons and “transneuronal degeneration” refers to transsynaptic degeneration of axons associated with a lesion in either the afferent or efferent connection to the involved neuron.10“Wallerian degeneration” starts with disintegration of axonal structures within days after injury, followed by degradation of myelin and finally fibrosis and atrophy of the affected fibers.10 Radiological correlates of these histopathological changes have been investigated with DTI in humans and animals.11–15 Due to the similarities in the underlying pathology, we expected similar DTI changes during the course of the disease, except for the olivary hypertrophy, which is unique to HOD. In DTI, the most commonly used parameters are fractional anisotropy (FA) and apparent diffusion coefficients (ADC), which provide information on the arrangement of tissue cytoarchitecture, but lack specificity for the underlying pathology.7,16,17 Recently, other DTI parameters, derived from three directional diffusivities which have been described as λ// (axial diffusivity) and λ⊥ (radial diffusivity), were proven as capable of elucidating specific pathology leading to changes in diffusion anisotropy.11–12,16–20 Animal studies using DTI showed that individual eigenvalues are more specific markers of myelination and axonal morphology than FA and ADC.11,16–19 These studies have suggested that demyelination increases diffusion perpendicular to the direction of fibers (radial diffusivity, λ⊥) with minimum effect on the eigenvalue which reflects the diffusion along the fiber (axial diffusivity, λ//). On the contrary, axonal damage results in decreased λ// with relatively small effect on λ⊥. Astrocytic hypertrophy increases λ// just opposite to axonal damage.18 Furthermore, studies both on humans and animals have described the early and late DTI findings of wallerian degeneration. While axial diffusivity decreases in early wallerian degeneration, radial diffusivity increases in the late phase of it, as a result of axonal degeneration and demyelination respectively.11–12,14–15
Autopsy studies have revealed that HOD is a reactive, continuing process that takes months to years in evolution. During this period conventional MRI only reflects gross morphologic changes in a fraction of patients. However, our study has demonstrated that DTI could detect dynamic changes in IO in two of our patients who could be followed by multiple examinations. The time-course of neuropathological changes that are observed in HOD has been previously reported.4,5 Although electron microscopic changes were detected a few days after disruption of GMT, histopathological changes were reported to appear 12–15 days after the inciting lesion.4,21,22 Nishie et al,4 in their autopsy study, reported neuronal hypertrophy starting at 21 days, peaking at 6–7 months, and decreasing over the next 2 years. Axonal degeneration was first detected 21 days after the onset and progressed gradually. Demyelination was also detected initially at 21 days and myelin almost completely disappeared at 7 months from the ribbon of IO and at 29 months from amiculum and hilus. Astrocytic hypertrophy with an enlarged gemistocytic cytoplasm started 21 days after onset and reached a peak 6 months after onset. In cases surviving more than 2 years, fibrillary astrocytes were more abundant than the gemistocytic variety.4
In the late phase of HOD, the most prominent DTI finding in our study was an increase in radial diffusivity in all components of GMT, demonstrating demyelination in accordance with the previous histopathologic studies. Due to statistically insignificant changes, investigating only the FA value can mislead in the late phase.
It can be postulated that neuronal hypertrophy, in collaboration with astrocytic hypertrophy, can increase λ//. This assumption can explain the increase in λ// alongside the major increase in λ⊥ demonstrating demyelination with neuronal/astrocytic hypertrophy in GMT until the 24th month. Significant DTI changes were detected even in the early phase of HOD, although only one patient was available for examination by DTI in the first month of the disease. In the early phase, non-dominant HOD without macroscopic hypertrophy of IO on late scan, which is thought to reflect less severe involvement than the dominant HOD, demonstrates a decrease in axial diffusivity compatible with axonal degeneration, dominant HOD with macroscopic hypertrophy of IO on late scan shows increase in both radial and axial diffusivities compatible with demyelination and astrocytic/neuronal hypertrophy. One single patient is certainly not enough to draw conclusions; however, findings demonstrated herein indicate the potential of DTI in radiological imaging of HOD.
Conclusions
In our study cohort, DTI showed dynamic signal changes in all anatomical components of the GMT, which correlated well with the histopathological changes previously demonstrated in patients with HOD. Our findings demonstrate the utility of axial diffusivity and radial diffusivity measurements for the evaluation of HOD. Main DTI findings were a decrease in axial diffusivity (which is consistent with known axonal degeneration) followed by increases in axial diffusivity (reflective of neuronal/astrocytic hypertrophy) and radial diffusivity (consistent with demyelination). The capability to non-invasively track the temporo-spatial progression of transneuronal degeneration in HOD supports the potential diagnostic value of DTI in this rare disease entity, which needs to be validated prospectively with larger patient populations.
The authors wish to thank Mehmet Hacihanefioglu, MD, for his assistance in collecting the data and Burak Güçlü, PhD, for his assistance in the statistical analysis. We would also like to thank Koray Ozduman, MD, for his assistance in preparing the manuscript.


