Letter to the Editor
Letter Regarding:
Allen, B. M., Hack, C. E., & Clewell, H. J. (2007). Use of Markov Chain Monte Carlo analysis with a physiologically based pharmacokinetic model of methylmercury to estimate exposure in U.S. women of childbearing age. Risk Analysis, 27(1), 947–959.
Allen et al. (2007) used a pharmacokinetic model and a Bayesian updating process to “back-calculate” a population distribution of methylmercury (MeHg) intake data collected from the 1999–2000 National Health and Nutrition Survey (NHANES). We note that they used exposure estimates from one of our publications to generate the prior estimates of a log-normal characterization for the distribution of MeHg intake in U.S. women of childbearing age, yielding a geometric mean (GM) of 0.8 μg/day with a geometric standard deviation (GSD) of 1.67. Uncertainty in these prior estimates was given a “reasonably vague” uncertainty distribution, “with 95% of the distribution extending from 0.08 to 7.60 μg/day.” After their “updating” process, Allen et al. arrived at a central population intake estimate of GM of 2 μg MeHg/day and GSD of 0.37, with much narrower confidence intervals (CIs) for both parameters. We note that the arithmetic means (i.e., the population average) of the prior and posterior intake estimates are reasonably close (3.2 μg MeHg/day for the prior vs. 2.3 μg MeHg/day for the posterior), but the population variations in MeHg intake for the two estimates are dramatically different.
Allen et al. (2007) did not mention that we provided CIs for our 2002 intake estimates. In particular, the median value of 0.8 was given a confidence range of 0.7–0.8 μg/day, while the 95th percentile (used to calculate the GSD) ranged from 10.0 to 12.8 μg/day. Those CIs were also generated through the Monte Carlo simulation based on an exposure assessment model that reflects the levels of mercury in fish and several surveys of fish consumption. Since our CIs are not consistent with a GSD of 0.37, we would like to present some relatively simple descriptive statistics to support our belief that our exposure model provides a better approximation.
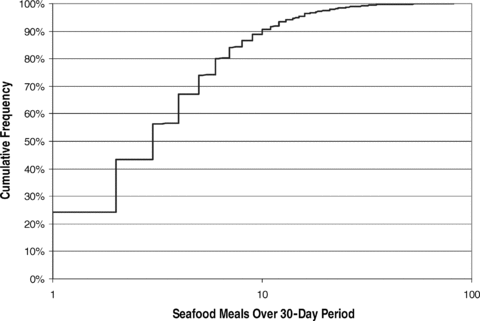
First, we note that the geometric variations for seafood consumption frequency (see Fig. 1), mercury concentration, and seafood serving size are all in excess of 0.9 (see Table I). Multiplying these three distributions together (obtained from the square root of the sum of the squares) yields a distribution with a GSD of 1.7. Our model is much more complicated and does not use log-normal distributions for any of those measures, but it gives roughly the same result. Although strong negative correlations might produce a somewhat lower variation, we know from the existing consumer surveys (i.e., Continuing Survey of Food Intake by Individuals (CSFII) and NHANES) that people eating large amounts of seafood do not always choose species low in mercury. Therefore, we cannot imagine how a reasonable exposure could be constructed that yields a GSD much lower than ours. Or to put it another way, in light of many well-documented observations of wide variation in seafood consumption behavior on the part of women in the United States, it does not seem at all possible that MeHg intake would have such a small variation. As a result, since our estimate was not “uninformed,” we do not believe using a “vague prior” for the uncertainty ranges for the MeHg population intake parameters were reasonable.

Results from NHANES 30-day seafood frequency survey.
| Measurement | GSD | Reference | Notes |
|---|---|---|---|
| Seafood consumption frequency | 0.90 | CDC (2002) | NHANES 1999–2000 30-day survey; does not include subjects who reported eating no fish |
| MeHg concentration, market-weighted | 1.10 | Carrington and Bolger (2004) | Distribution fit to data in Table 2; reflects variation across species, but not variation within each species |
| Seafood serving size | 0.90 | USDA (1998) | Raw statistic—no demographic weighting |
| Total pharmacokinetic variation | 0.13 | Sherlock et al. (1984) | Assuming linearity with dose—all four groups combined |
| Total pharmacokinetic variation | 0.24 | Birke et al. (1972); Sherlock et al. (1984) | Birke dosimetry is not as good—additional variations may reflect measurement error |
| Blood mercury in adult women | 1.10 | NHANES 1999–2000 | The GSD is still 1.1 if data from the 2002 and 2004 surveys are included |
Second, we note that the GSD for blood mercury levels from women of childbearing age in the United States is about 1.1 (see Table I). This variance is less than our estimate for MeHg intake, but after correcting for the influence of body weight, which correlates with intake, our model predicts a distribution that is quite close to the NHANES survey (see Carrington & Bolger, 2002; Carrington et al., 2004). Given the fact that the GSD in blood is roughly the same as that of many of the measures influencing exposure, there does not seem to be a lot of unexplained variance left for pharmacokinetic variation. Indeed, the results from Sherlock et al. (1984) suggest that this is not the case (see Table I). Since Allen et al. (2007) used NHANES and Sherlock et al.'s study (1984) to condition their model, we wonder if the updated model is consistent with the data it was derived from. That is, (1) does it predict a GSD of roughly 0.2 for blood levels with a fixed exposure to MeHg, and (2) does it predict a GSD of approximately 1.1 for adult women in the United States? Since the variation in intake in the Allen et al. model is quite small, it seems to us that either the total pharmacokinetic variation in the model must be large or the variation in the predicted blood and hair levels must be small.
NOTE
Allen et al. were offered the opportunity to comment but declined.


