SEQUENCE AND STRUCTURAL ANALYSIS OF κ-CARRAGEENAN-DERIVED OLIGOSACCHARIDES BY TWO-DIMENSIONAL NUCLEAR MAGNETIC RESONANCE1
Received 10 March 2009. Accepted 28 January 2009.
Abstract
κ-Carrageenan was hydrolyzed with mild hydrochloric acid and separated into a series of oligosaccharides, the sequences and structures of which were investigated by double-quantum filtered correlation spectroscopy (DQF-COSY), total correlation spectroscopy (TOCSY), heteronuclear multiple-quantum coherence (HMQC), and heteronuclear multiple-bond correlation (HMBC) techniques, respectively. The chemical structures and conformations of the individual sugar residues were identified, as well as the sequential connectivity of the oligosaccharides. The interresidue nuclear Overhauser effects (NOEs)/rotating frame Overhauser effects (ROEs) revealed an ordered helical structure of the carrageenan oligosaccharide chains. Therefore, a general two-dimensional (2-D) NMR methodology for the unambiguous sequence and structure analysis of κ-carrageenan-derived oligosaccharides was established in this study.
Abbreviations:
-
- 1-D
-
- one dimensional
-
- 2-D
-
- two dimensional
-
- DQF-COSY
-
- double-quantum filtered correlation spectroscopy
-
- HMBC
-
- heteronuclear multiple-bond correlation
-
- HMQC
-
- heteronuclear multiple-quantum coherence
-
- NOE
-
- nuclear Overhauser effect
-
- NOESY
-
- nuclear Overhauser effect spectroscopy
-
- ROE
-
- rotating frame Overhauser effect
-
- ROESY
-
- rotating frame Overhauser effect spectroscopy
-
- TOCSY
-
- total correlation spectroscopy
Marine polysaccharides, such as carrageenan, have been widely used in the food industry due to their thickening and gelling properties, and recent studies have shown their antiviral activities against herpes simplex (Carlucci et al. 2004, McCarthy 2007, Roberts et al. 2007), papillomavirus (Buck et al. 2006), and dengue virus (de S.F-Tischer et al. 2006) and their effects on microspore embryogenesis (Lemonnier-Le Penhuizic et al. 2001). Carrageenans consist of a linear repeating glycosidic backbone of galactose linked by alternating 3-O-linked β-d-Galp (G) and 4-O-linked α-Galp (d). The latter unit often occurs as 3,6-anhydrogalactose (AnG). Carrageenans are classified into 13 types denominated by Greek letters as their prefixes. Only three types of carrageenans are widely exploited as important additives in various applications due to their exceptional physicochemical properties (i.e., κ-, ι-, and λ-carrageenan). They have different disaccharide building blocks, -[G4S-AnG]n-, -[G4S-AnG2S]n-, and -[G4S-D2S6S]n-, respectively. The structural complexity and high viscosity of these macromolecules cause additional difficulties in structural analysis of carrageenan polysaccharides. Degradation of polysaccharide is a valuable technique that has been used in the structural characterization and sequence determination of carrageenans, as well as an aid in NMR assignments. Especially, the bioactivities of carrageenan oligosaccharides, such as anticancer effects (Yuan et al. 2006), have greatly fueled the current interest in structure-activity relationship studies. Preparation of oligosaccharides from carrageenan by mild-acid hydrolysis (Caram-Lelham 1995, Yu et al. 2002), reductive hydrolysis (Gonçalves et al. 2005), and carrageenase degradation (Guibet et al. 2007) has been widely used. The structure of the intact carrageenan has been studied using 1H, 13C-NMR spectroscopy and traditional chemical analysis (van de Velde et al. 2002, Bosco et al. 2005). The main structure of some oligosaccharides has already been studied using different techniques (e.g., NMR spectroscopy and the electro-spray–collision induced dissociation–mass spectroscopy/mass spectroscopy [ES-CID-MS/MS] method; Knutsen and Grasdalen 1992, Ueda et al. 2001, 2004, Yu et al. 2002, 2006), combined with molecular modeling. However, the fine structures and the complete assignments remain unsolved and also lack the direct evidence of the linkage sequence of each monosaccharide.
NMR is one of the most widely applied experimental methods in studying structures and dynamics of biomolecules (Wüthrich 1986, Cavanagh et al. 1996, Clore and Gronenborn 1998). In the past several decades, the rapid development in NMR methodology and technique has enabled the determination of high-resolution three-dimensional (3-D) structures of proteins and nucleic acids of small to medium sizes, as well as the dynamics of these biomolecules (Bax 1994, Clore and Gronenborn 1998, Wider and Wüthrich 1999). The successful application of advanced NMR techniques to proteins and nucleic acids relied heavily on the 13C, 15N, 2H isotope labeling of the relevant biomolecules through gene expressions (Bax 1994, Gardner and Kay 1998). Various 3-D and four-dimensional (4-D) NMR experiments have been developed to resolve congested NMR signals into additional dimension(s), simplifying the process of the assignment of NMR signals. Unfortunately, most of these 3-D and 4-D NMR methods could not be applied to carbohydrates, due to difficulties in the isotope labeling of carbohydrate molecules (Duus et al. 2000). Therefore, the NMR methodology was very limited while being applied to carbohydrates and involved mainly the conventional 2-D experiments and some 3-D experiments for natural abundance samples (Duus et al. 2000).
In the present study, we used various kinds of 2-D NMR spectra acquired on the high-field NMR instruments to make the full assignment of the sequence and structure of the oligosaccharides prepared from κ-carrageenan by mild-acid hydrolysis.
Materials and Methods
Preparation of κ-carrageenan oligosaccharides. The oligosaccharides were prepared from polysaccharide of κ-carrageenan, which was extracted from Kappaphycus striatum (F. Schmitz) Doty ex P. C. Silva (originated in the Philippines) and fractionated with KCl solution (Yu et al. 2007). Mild-acid hydrolysis of κ-carrageenan polysaccharide (5 g) was carried out with 0.1 M HCl (500 mL) at 60°C for 3 h. The partial hydrolysis was terminated by neutralization with 1 M NaOH. The hydrolyzed product was desalted on a Sephadex G10 column (2.6 cm × 100 cm, 55–165 μm, Amersham Biosciences, Uppsala, Sweden) with elution by double-distilled water and monitored by a refractive index (RI) detector (Gilson 132 RI, Paris, France). The desalted oligosaccharide mixture was separated on an ÄKTA-FPLC with a Superdex30 column (3.5 cm × 85 cm, 30 μm, Amersham Biosciences) that eluted by 0.2 M NH4HCO3 at a flow rate of 0.8 mL·min−1 and detected online by an RI detector (Fig. 1). The oligosaccharide fraction from peak a, b, and c (referring to carr-A, B, and C in the following text) was used for NMR studies, respectively.
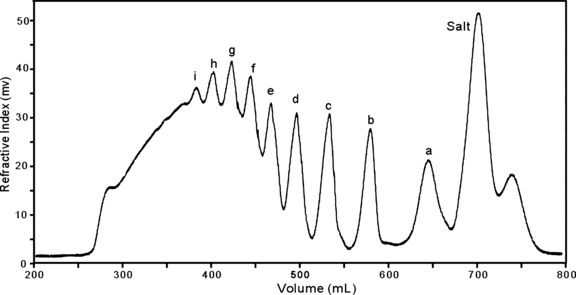
Low-pressure gel permeation chromatography of κ-carrageenan-derived oligosaccharides on Superdex30 column.
NMR analysis. All NMR data were recorded on a VARIAN Unity-Inova 600 MHz spectrometer (VARIAN Inc., Palo Alto, CA, USA) with a 5 mm triple-resonance gradient probe. The concentration of the carrageenan samples was between 10 and 20 mM in the solvent of 2H2O. One-dimensional (1-D) 1H and 2-D DQF-COSY, nuclear Overhauser effect spectroscopy (NOESY), rotating frame Overhauser effect spectroscopy (ROESY), TOCSY, and 1H-13C HMQC, HMBC spectra were recorded at 25°C. The spin lock time of ROESY was 100 ms. The mixing time of NOESY spectra was 200 ms and 500 ms. A series of TOCSY spectra were recorded with a spin lock time varying from 50 to 150 ms. The 1H chemical shifts were referred to the 1HOD signal at 4.76 ppm. The 13C chemical shifts were externally referenced to DSS (sodium 4,4-dimethyl-4-silapentane-1-sulfonate).
NMR data were processed and analyzed with Mestrec software (Mestrelab Research SL, Bajo, Santiago de Compostela, Spain).
The 2-D NMR spectroscopy applied to carrageenan studies could be classified into two categories, through-bond correlation spectroscopy and through-space correlation spectroscopy. Through-bond correlation spectroscopy included DQF-COSY, TOCSY, and 1H-13C HMQC, HMBC. Through-space correlation spectroscopy included NOESY and ROESY.
Through-bond correlation spectroscopy was applied to identify the individual sugar spin systems in carrageenan samples. The homonuclear 1H-1H three-bond and two-bond correlations in the same sugar spin system could be identified in DQF-COSY. The homonuclear 1H-1H long-range correlations through the magnetization relaying mechanism could be identified in TOCSY. The 13C resonances could be assigned in 1H-13C HMQC, HMBC, based on the assignment of the 1H resonances. The assignment of the 1H resonances could be further confirmed in 1H-13C HMQC, HMBC.
Through-space correlation spectroscopy, together with 1H-13C HMBC, provided the important glycosidic linkage information between the different sugar spin systems. The through-space correlation spectroscopy also revealed conformational information of the carrageenan molecules.
Results and Discussion
NMR assignment of carr-A. By observation of the anomeric region of the 1H-13C HMQC spectrum (Fig. 2) of carr-A, six cross-peaks could be separated from the nonanomeric resonances leading to anomeric 1H chemical shifts (4.4–5.8 ppm) and anomeric 13C chemical shifts (95–110 ppm). The cross-peak at (4.972 ppm, 100.424 ppm) is considered the signal of a trace of impurity after analysis of all spectra. Thus, five anomeric protons and carbons could be identified, corresponding to five spin systems labeled S1, S2, S3, S4, and S5 according to the decreasing chemical shifts of the anomeric protons.
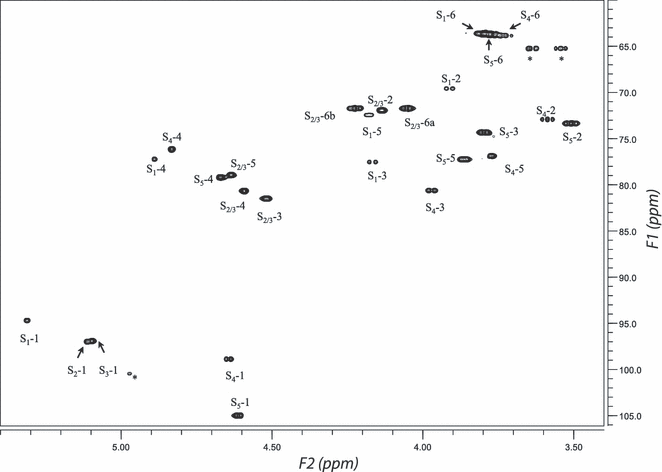
1H-13C HMQC spectrum of carr-A. The cross-peaks were labeled by their respective spin systems and resonance positions (e.g., S1-1 was the resonance peak at position 1 of the spin system S1). HMQC, heteronuclear multiple-quantum coherence.
DQF-COSY, TOCSY, HMQC, and HMBC spectra were used in the analysis of these spin systems. The proton connectivities in these spin systems are shown in the DQF-COSY (Fig. S1 in the supplementary material). Moreover, the TOCSY spectrum reveals remote signal connectivities, which support the assignment made by means of the DQF-COSY spectrum (Fig. S2 in the supplementary material). With the identification of the 1H resonances, the 13C signals in these three spin systems could be easily obtained from the HMQC (Fig. 2) and HMBC spectra (Fig. 3). The 1H and 13C chemical shifts identified from these spectra have been listed in Table 1.
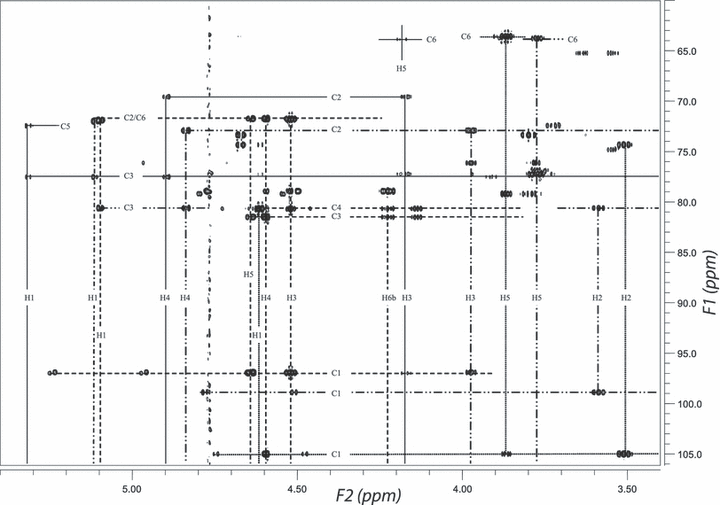
1H-13C HMBC spectrum of carr-A. The resonances from individual spin systems were labeled by the curve: — (S1), –·– (S2), ––– (S3), –··– (S4), ······ (S5), respectively. HMBC, heteronuclear multiple-bond correlation.
| Compound | Spin system | Nucleus | 1 | 2 | 3 | 4 | 5 | 6a | 6b |
|---|---|---|---|---|---|---|---|---|---|
| carr-A | S1 | 1H | 5.310 | 3.910 | 4.167 | 4.893 | 4.182 | 3.793 | 3.720 |
| 13C | 94.72 | 69.61 | 77.50 | 77.24 | 72.46 | 63.86 | |||
| S2 | 1H | 5.113 | 4.136 | 4.517 | 4.591 | 4.635 | 4.224 | 4.053 | |
| 13C | 97.05 | 71.94 | 81.52 | 80.61 | 78.93 | 71.69 | |||
| S3 | 1H | 5.095 | 4.136 | 4.517 | 4.591 | 4.635 | 4.224 | 4.053 | |
| 13C | 96.92 | 71.93 | 81.52 | 80.61 | 78.93 | 71.69 | |||
| S4 | 1H | 4.646 | 3.588 | 3.972 | 4.833 | 3.768 | 3.768 | ||
| 13C | 98.87 | 72.97 | 80.61 | 76.21 | 76.98 | 63.78 | |||
| S5 | 1H | 4.610 | 3.503 | 3.798 | 4.670 | 3.862 | 3.798 | 3.786 | |
| 13C | 104.95 | 73.36 | 74.39 | 79.18 | 77.24 | 63.59 | |||
| carr-B | S1 | 1H | 5.314 | 3.914 | 4.168 | 4.891 | 4.180 | 3.798 | |
| 13C | 94.70 | 69.57 | 77.53 | 77.20 | 72.45 | 63.62 | |||
| S2 | 1H | 5.111 | 4.136 | 4.522 | 4.598 | 4.642 | 4.218 | 4.056 | |
| 13C | 96.99 | 71.94 | 81.50 | 80.70 | 78.96 | 71.74 | |||
| S3 | 1H | 5.098 | 4.136 | 4.522 | 4.598 | 4.642 | 4.218 | 4.056 | |
| 13C | 96.97 | 71.94 | 81.50 | 80.70 | 78.96 | 71.74 | |||
| S4 | 1H | 4.645 | 3.589 | 3.972 | 4.834 | 3.770 | 3.760 | ||
| 13C | 98.91 | 72.92 | 80.62 | 76.14 | 76.91 | 63.69 | |||
| S5 | 1H | 4.612 | 3.509 | 3.800 | 4.673 | 3.863 | 3.780 | ||
| 13C | 105.21 | 73.37 | 74.34 | 79.21 | 77.24 | 63.71 | |||
| S6 | 1H | 4.653 | 3.596 | 4.005 | 4.855 | 3.813 | 3.780 | ||
| 13C | 104.77 | 71.71 | 80.44 | 76.03 | 77.08 | 63.71 | |||
| carr-C | S1 | 1H | 5.312 | 3.907 | 4.167 | 4.892 | 4.179 | 3.784 | 3.725 |
| 13C | 94.69 | 69.58 | 77.48 | 77.22 | 72.43 | 63.88 | |||
| S2 | 1H | 5.108 | 4.128 | 4.519 | 4.596 | 4.641 | 4.219 | 4.050 | |
| 13C | 96.89 | 71.91 | 81.49 | 80.71 | 78.90 | 71.65 | |||
| S3 | 1H | 5.097 | 4.128 | 4.519 | 4.596 | 4.641 | 4.219 | 4.050 | |
| 13C | 96.89 | 71.91 | 81.49 | 80.71 | 78.90 | 71.65 | |||
| S4 | 1H | 4.643 | 3.594 | 3.990 | 4.832 | 3.766 | 3.789 | 3.745 | |
| 13C | 98.84 | 71.65 | 80.45 | 76.05 | 76.83 | 63.75 | |||
| S5 | 1H | 4.61 | 3.503 | 3.789 | 4.670 | 3.862 | 3.789 | 3.745 | |
| 13C | 105.05 | 73.33 | 74.36 | 79.16 | 77.22 | 63.48 | |||
| S6 | 1H | 4.658 | 3.610 | 4.014 | 4.852 | 3.815 | 3.801 | ||
| 13C | 104.79 | 71.65 | 80.45 | 76.05 | 77.09 | 63.49 | |||
The long-range 1H-13C correlations observed in HMBC confirmed the 1H and 13C assignments made above (Fig. 3). In addition, the long-range 1H-13C correlations between H1 and C5, H5 and C1 are observed within all the five spin systems, indicating that all sugar residues are pyranose.
The three-bond 1H-1H coupling constants and intraresidue NOEs provide important clues to identify the sugar types and conformations of the spin systems. In S1, 3JH1-H2∼3.9 Hz, 3JH2-H3∼9.7 Hz, 3JH3-H4∼3.9 Hz, and 3JH4-H5 is very small; in S4 and S5, 3JH1-H2∼7.8 Hz, 3JH2-H3∼9.7 Hz, 3JH3-H4∼3.9 Hz, and 3JH4-H5 is very small. The coupling constants suggest that S1 is an α-d-Gal-based unit and that S4 and S5 are β-d-Gal-based units. The values 1JC,H∼170 Hz in S1 and ∼ 161Hz in S4 and S5 support the configuration of these residues. H4 in S1, S4, and S5 are at high frequencies, far away from the nonanomeric region, due to the sulfate substituent. The observed intraresidue NOE contacts for S4 and S5 (Table 2) are consistent with the chair conformation of β-d-Gal indicated in Figure 4. It is difficult to confirm the conformation of α-d-Gal for S1 by intraresidue NOEs, due to the proton signal degeneracies and weak signals.
| Spin system | S1 | S2 | S3 | S4 | S5 |
|---|---|---|---|---|---|
| NOEs | H2-H3 | H1-H2 | H1-H2 | H3-H4 | H1-H3 |
| H3-H4 | H1-H6a | H1-H6a | H3-H5 | H1-H5 | |
| H2-H3 | H2-H3 | H4-H5 | H3-H4 | ||
| H5-H6b | H5-H6b | H4-H5 | |||
| H6a-H6b | H6a-H6b |
- aNOE relations for carr-B and carr-C are similar to those given for carr-A.
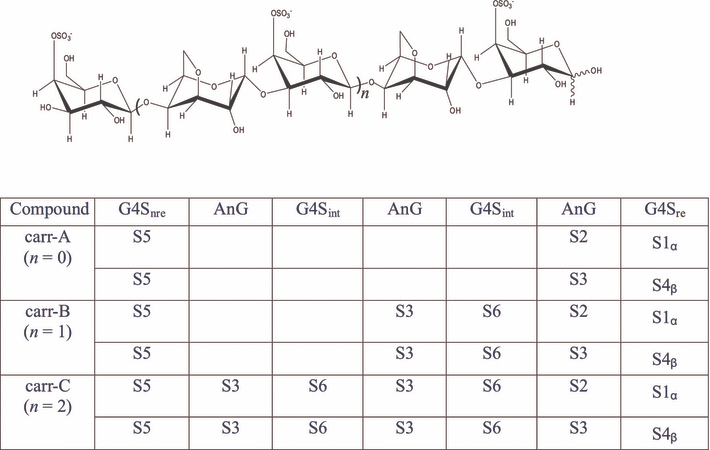
Spin system and sequences of carr-A, carr-B, and carr-C. AnG stands for 3, 6-anhydrogalactose. G4S stands for 4-O-sulfogalactose; the subscripts “nre,”“int,” and “re” represent the “nonreducing,”“internal,” and “reducing” end, respectively.
For S2 and S3, not all the coupling constants could be observed. However, 3JH1-H2∼3.0 Hz, and 1JC,H∼167 Hz, indicating an α-configuration of S2 and S3; the long-range H6-C3 and H3-C6 correlations in HMBC (Fig. 3) indicate the existence of a 3,6-oxo-bridge. Due to the oxo-bridge between position 3 and position 6 in S2 and S3, 3JH3,H4 got smaller, H3 and H4 only giving a weak cross-peak in TOCSY and no correlations in DQF-COSY. The NOE signals from H6b at 4.035 ppm to H5, from H6a at 4.224 ppm to H1 both in S2 and S3 were observed, revealing the chair conformation of S2 and S3 (Fig. 4).
In conclusion, all the sugar spin systems including their chemical structures and conformations could be assigned and identified for carr-A, mainly based on through-bond connectivities, coupling constants, and intraresidue NOEs in various 2-D NMR spectra.
Long-range correlation HMBC spectra supplemented by NOESY/ROESY data are used to identify the sequential connectivity of the five spin systems.
The HMBC spectra show that C1 of S2 is coupled to the H3 of S1, the H1 of S2 is coupled to the C3 of S1, consequently, S2-(1→3)-S1, and as no C-H correlations with other spin systems is observed for S1, S1 must be the reducing end of the α-chain.
C1 in S3 and H3 in S4, H1 in S3 and C3 in S4 are correlations across the glycosidic linkage that revealed S3-(1→3)-S4, and S4 could be assigned as the reducing end of the β-chain.
The α, β-equilibrium gives rise to the slight difference in the anomeric proton signals of S2 and S3. On the other hand, the other proton signals and all the carbon signals are coinciding. As a result, the cross-peaks between the C1 in S5 and H4 in S2/S3 and the correlations from H1 in S5 to C4 in S2/S3 could indicate the following linkage: S5-(1→4)-S2 and S5-(1→4)-S3 or any of the two. However, as no other cross-linkage correlations are observed, we believe that it is both.
The interresidue NOE contacts from H3, H4 in S1 to H1 in S2; from H3, H4 in S4 to H1 in S3 could be identified in ROESY and NOESY. Due to the similar chemical shift values, NOE contacts from H1 of S5 to H4 of S2/S3 were not observed. NOE signals obtained from the NOESY spectrum corroborated the assigned sequences deduced from the HMBC experiments.
All the fragments mentioned above suggest the following sequence: S5-(1→4)-S2-(1→3)-S1, and S5-(1→4)-S3-(1→3)-S4 equal to β-d-Galp4S-(1→4)-α-d-AnGalp-(1→3)-α-d-Galp4S, and β-d-Galp4S-(1→4)-α-d-AnGalp-(1→3)-β-d-Galp4S (Fig. 4).
The integral of a well-separated proton signal in each spin system in the 1-D proton spectrum, H1 in S2 and S3, H4 in S1, S4, and S5, revealed that the intensity of S1 is equal to that of S2, S4 is equal to S3, and the intensity of S5 is equal to the sum of S1 and S4, or S2 and S3. The integrals supported the two sequences made above and suggested that S5 consists of two degenerate spin systems due to mutarotation. The ratio could be estimated to ∼ 33%α and 67%β.
NMR assignment of carr-B. Comparing the anomeric region of carr-B with that of carr-A in HMQC, a new cross-peak at 4.646 ppm and 104.82 ppm was observed, corresponding to a new spin system called S6 (Fig. S3 in the supplementary material), and other spin systems (S1, S2, S3, S4, and S5) corresponding to the spin systems in carr-A. The 1H and 13C chemical shifts assigned for carr-B have been listed in Table 1.
In addition, the long-range 1H-13C correlations between H1 and C5, H5 and C1 are observed for S6, indicating that S6 is also a pyranose.
The new spin system has coupling constants as seen for a β-d-Gal (see previous discussion). The intraresidue NOE contacts (Table 2) are consistent with the chair conformation of β-d-Gal in Figure 4.
HMBC and ROESY spectra were used for the sequence assignment. Fragments S3-(1→3)-S4, S2-(1→3)-S1 were deduced as before. Furthermore, C1 of S5 is coupled to H4 of S3/2, H1 of S5 is coupled to C4 of S3/2, indicating the following two possible fragments, S5-(1→4)-S3/2, and as no other correlations across the glycosidic linkage were observed for S5, it must be the nonreducing end of carr-B.
The starting sequence S5-(1→4)-S2 could be extended further as S5-(1→4)-S2-(1→3)-S1. It is an identical sequence to the sequence S5-(1→4)-S2-(1→3)-S1 identified in carr-A. Since this component is not expected to appear in carr-B, we could rule out the possibility of this sequence.
The starting sequence S5-(1→4)-S3 was extended as S5-(1→4)-S3-(1→3)-S6-(1→4)-S2/S3, by the correlations from H1 of S3 to C3 of S6, C1 of S3 to H3 of S6, C1 of S6 to H4 of S2/S3, and H1 of S6 to C4 of S2/S3. Combined with the sequential segments S3-S4 and S2-S1, two linkage sequences could be obtained as seen in Figure 4.
The interresidues NOE contacts, from H3, H4 in S1 to H1 in S2; from H3, H4 in S4 to H1 in S3; from H3, H4 in S6 to H1 in S3, could be identified in ROESY and NOESY. The observed NOEs corroborated the assigned sequences deduced from the HMBC experiments.
The integral on H1 in S1 and H4 in S4 gave the ratio of the two chains ∼33%α and 67%β, the sum of the integral of H1 in S2 and H1 in S3 was double of that of H4 in S6 or S5, and the intensity of S2, S3, S5, S6 was about 0.34/1.6/0.98/1.0, which was inconsistent with the ratio α and β equilibrium, and again supported the sequence linkage made above. As a result, the two sequences could be obtained: S5-(1→4)-S3-(1→3)-S6-(1→4)-S3-(1→3)-S4, that is, β-d-Galp4S-(1→4)-α-d-AnGalp-(1→3)-β-d-Galp4S-(1→4)-α-d-AnGalp-(1→3)-β-d-Galp4S(β-chain); and S5-(1→4)-S3-(1→3)-S6-(1→4)-S2-(1→3)-S1, that is, β-d-Galp4S-(1→4)-α-d-AnGalp-(1→3)-β-d-Galp4S-(1→4)-α-d-AnGalp-(1→3)-α-d-Galp4S (α-chain).
NMR assignment of carr-C. There were no obvious differences comparing the TOCSY, DQF-COSY, HMQC, HMBC, and ROESY spectra of carr-C with those of carr-B. The identification of the six spin systems and the interresidue C, H correlation patterns in HMBC were all the same as in carr-B.
However, comparing the integrals of the proton spectra, carr-C gave a difference and made possible the sequence assignment. The intensity of H1 in S1 and H4 in S4 gave the ratio of ∼33%α- and 67%β-chain. The sum of the integral of H1 in S2 and H1 in S3 was 3-fold that of H4 in S5, and the ratio of the intensity of S2, S3, S5, S6 is ∼0.33/2.5/1.7/1.0, suggesting the appearance of a new S3 and S6 spin system in carr-C compared with carr-B. The repeating S3-S6 fragment makes seven residues in the two sequences. As a result, two sequences could be obtained: S5-(1→4)-S3-(1→3)-S6-(1→4)-S3-(1→3)-S6-(1→4)-S3-(1→3)-S4, that is, β-d-Galp4S-(1→4)-α-d-AnGalp-(1→3)-β-d-Galp4S-(1→4)-α-d-AnGalp-(1→3)-β-d-Galp4S-(1→4)-α-d-AnGalp-(1→3)-β-d-Galp4S (β-chain); and S5-(1→4)-S3-(1→3)-S6-(1→4)-S3-(1→3)-S6-(1→4)-S2-(1→3)-S1, that is, β-d-Galp4S-(1→4)-α-d-AnGalp-(1→3)-β-d-Galp4S-(1→4)-α-d-AnGalp-(1→3)-β-d-Galp4S-(1→4)-α-d-AnGalp-(1→3)-α-d-Galp4S (α-chain).
A similar interresidue NOE pattern was observed for carr-C as for carr-B, which corroborated the assigned sequences deduced from the HMBC experiments.
Structure comparisons of carr-A, carr-B, and carr-C. Most of the resonance peaks in carr-A appear at approximately the same chemical shifts as in carr-B; the same is true for the peaks in carr-B as compared to carr-C (see Table 1). The homonuclear coupling patterns also remain mostly conserved, comparing carr-A, carr-B, and carr-C.
The conserved proton chemical shifts and coupling patterns imply the conserved conformations of individual sugar rings in the carrageenan oligomers, independent of the chain length. For carr-A, five spin systems are identified for the three different sugar units. For carr-B, only one additional sugar spin system is identified as compared to carr-A, although there are two additional sugar residues. For carr-C, no new sugar spin system is identified as compared to carr-B, although there are again two additional sugar units, which are assigned to the existing S3-S6 repeating sequence (Fig. 4). In both carr-B and carr-C, the intensity of the NOE signal from H1 in S3 to H4 in S6 is about 2-fold of that from H1 in S3 to H3 in S6, indicating a similar dihedral angle across the glycosidic bond between S3 and S6 in carr-B and carr-C. The above observations indicate that the carrageenan oligosaccharide chain adopts an ordered helical secondary structure with a conserved repeating sequence S3-S6.
The NOE ratio between H1 in S3 to H4 in S4 and H1 in S3 to H3 in S4 has a value of ∼5–10 for carr-B and carr-C, which implies a different interresidue contact between S3 and S4 than between S3 and S6. A similar observation was made for the NOE ratio between H1 in S2 to H4 in S1 and H1 in S2 to H3 in S1. Therefore, in both the α- and β- chain of carr-B and carr-C, the galactose at the reducing end adopts a configuration different from the rest of the galactoses in the oligosaccharide chain. The NOE ratio between H1 in S3 to H4 in S4 and H1 in S3 to H3 in S4, in carr-A, has a similar magnitude as that in carr-B and carr-C.
The galactose at the reducing end has a free end at position 1 and is thus less constrained than the galactose units in the middle of the oligosaccharide chain. Therefore, it is understandable that the reducing-end sulfated galactose adopts a configuration different from the nonterminal sulfated galactoses. In fact, the intraresidue NOEs of S4 are significantly weaker than the corresponding proportion of that of S5 and S6, indicating some kind of conformational averaging. The other terminal galactose is the one at the nonreducing end (spin system S5). Due to the similarity in chemical shifts, no interresidue NOE could be observed at the nonreducing end in order to judge its configuration.
A detailed conformational analysis of the carrageenan oligosaccharides requires molecular modeling with structural restraints from NOEs, coupling constants, and so forth. Therefore, it is out of the scope of our current work. However, based on the qualitative NOEs and coupling constant patterns, some important structural features of the carrageenan oligosaccharides could be drawn in our work.
In conclusion, a complete sequence and structure assignment by NMR is achieved for several carrageenan oligosaccharides prepared by mild-acid hydrolysis. In general, the carrageenan oligosaccharide chain adopts an ordered helical structure. The terminal sugar residues have quite different structural features than the nonterminal ones.
This study was supported in part by the International Science and Technology Cooperation Program of China (2007DFA30980), and the authors would like to thank DANIDA (Danish Agency for Development Assistance) for providing a fellowship to support this project.


