Epilepsia 2006;47:1465–1476
The authors of this manuscript were incompletely listed as Elena Urrestarazu, Jeffrey D. Jirsch, Pierre LeVan, and Jeffery Hall. The correct list of authors should read “Elena Urrestarazu, Jeffrey D. Jirsch, Pierre LeVan, Jeffery Hall, Massimo Avoli, Francois Dubeau and Jean Gotman.”
In this same article, Figure 8 should have been printed in color. The corrected figure is printed below, along with its figure legend.
[
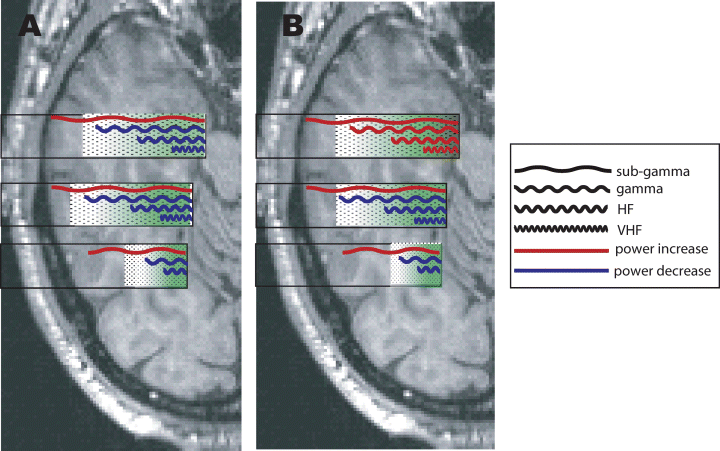
Schematic representation of the most frequent patterns of changes. The illustration shows the region of the temporal lobe but similar results were found in other regions. Each rectangle represents one electrode bundle (top, amygdala; middle, hippocampus; lower, posterior hippocampus, or parahippocampus). The changes in different frequency bands are represented by sinusoids at different frequencies (see box on figure). The lengths of the sinusoids indicate the spatial extent of the changes in the bundle. The green shaded region represents the extent of the spike in each bundle. Darker green areas indicate the locations where the spikes are most prominent.
(A) Widespread increase in subgamma power represented by the long red sinusoid and spatially graded decrease in gamma, HF, and VHF, represented by the progressively shorter blue sinusoids. The VHF decrease is only present in the region where the spike is largest (dark green shading);
(B) A different pattern was often seen in the temporal lobe, with a decrease in high frequencies in the hippocampus but an increase in the amygdala. ]


