Goodwill impairment as a reflection of investment opportunities
We acknowledge the helpful comments from an anonymous reviewer, Keryn Chalmers, Julie Cotter, Jane Hamilton, Peter Wells, participants at the 2006 Accounting and Finance Association of Australia and New Zealand Annual Conference and the 2006 European Accounting Association Annual Congress and seminar participants at Monash University, the University of Melbourne and the University of Tasmania. The authors gratefully acknowledge financial support from the Accounting and Finance Association of Australia and New Zealand.
Abstract
We exploit a unique opportunity to examine whether goodwill impairment write-offs reflect firms’ investment opportunities during the first years of the US goodwill impairment accounting regime. We find that impairment write-offs are negatively associated with firms’ underlying investment opportunities. We also find associations between goodwill impairment write-offs and traditionally applied leverage, firm size and return on assets variables, although the leverage and firm size results are less robust. The results support the International Accounting Standards Board and Financial Accounting Standards Board contention that an impairment test regime can reflect firms’ underlying economic attributes, while simultaneously indicating that managers use discretion to reduce contracting costs.
1. Introduction
In this paper, we exploit a unique opportunity to examine whether, in their early years of implementing the goodwill impairment test reporting regime, managers of US firms use their goodwill impairment write-off discretion to reflect firms’ underlying investment opportunities (IOS). Commencing with its implementation through SFAS 142 Goodwill and Other Intangible Assets in 2002, goodwill impairment has rapidly become the primary international goodwill reporting regime, replacing countries’ various goodwill amortization policies.1 However, although previous research has found that there is an association between firms’ IOS and accounting for its financial reporting goodwill amortization analogue (e.g. Skinner, 1993), we are unaware of any study that investigates whether goodwill impairment write-off levels are associated with firms’ IOS after controlling for other contracting incentives.2 As such, our study responds to the Fields, Lys and Vincent (2001) call for a more integrated approach to examining accounting choice decisions by considering multiple incentives concurrently.
Watts (2003a,b) argues that reliance on unverifiable fair value estimates, such as those required by SFAS 142, can increase managerial manipulation potential. Prior studies show that goodwill impairments are negatively associated with stock returns suggesting that SFAS 142 is beneficial in providing a framework for managers to convey future cash flow information to the market (Chen et al., 2004; Li et al., 2005). However, these findings can alternatively be explained by arguments that impairments are utilized as a big bath strategy, or by management's inability to avoid losses despite SFAS 142's manipulation potential (Ramanna, 2008). In contrast, Ramanna (2008) provides evidence suggesting that firms’ lobbying positions on SFAS 142 depend on their ability to manipulate goodwill accounting discretion. By assessing the IOS/goodwill impairment loss write-off association in the presence of other contracting incentives, the present study can provide valuable empirical evidence regarding the claimed benefits of the impairment test regime as reflections of economic substance; hence, assessing the merits of the International Accounting Standards Board (IASB), Financial Accounting Standards Board (FASB), and other countries’ goodwill standards.3
In particular, we present arguments that are consistent with the underlying rationale of Bens's (2006) explanation of Beatty and Weber (2006) findings that opportunistic incentives influence managers’ decision to record a transitional non-operating goodwill impairment loss at the time of SFAS 142 adoption. Beatty and Weber (2006) hypothesize that the greater the rate at which operating earnings are capitalized into share prices, the more likely managers are to overstate the transitional non-operating goodwill impairment loss charge to avoid future impairments. This is because future impairments would have a more negative effect on share prices since they would be included in operating earnings rather than as a non-operating charge which the market tends to discount (Bens and Heltzer, 2005). Bens's (2006) alternative argument assumes that firms with high rates of earnings capitalization are high P/E firms that generally have high IOS. He argues that firms with high IOS experienced a ‘reversal of fortune’ prior to adopting SFAS 142. Their share prices dropped significantly in the early 2000s, thereby making them appropriate candidates to report (transitional) goodwill impairment losses in 2002 to reflect their economic status.
In contrast to Beatty and Weber (2006), we limit our focus to the goodwill impairment losses that managers write off as operating expenses ‘above-the-line’ in 2002 and in 2003 and 2004. With the benefit of extra years of data, we are able to test whether firms manage their operating earnings via goodwill impairment loss recognition in ways that reflect the firms’ IOS. We also test whether the goodwill impairment loss write-offs appearing as operating expenses in 2002–2004 are associated with traditional contracting explanations of accounting discretion.
Although Smith and Watts (1992) argue that accounting choice is likely to vary cross-sectionally as a function of firms’ IOS, prior research investigating the association between IOS measures and accounting choices yields mixed results (e.g. Skinner, 1993; Pincus and Wasley, 1994; Gupta, 1995; Bradbury et al., 2003). Gupta (1995) concludes that his and prior studies’ inability to find an association between firms’ IOS and accounting policy choice reflects either that the relation is weak or requires better empirical proxies. Addressing this issue, Bradbury et al. (2003) use more refined measures of goodwill amortization aggressiveness and IOS in the New Zealand environment, where goodwill accounting was relatively unregulated. They find that firms with high IOS reflected that economic value by amortizing the accounting analogue, goodwill, less rapidly than firms with low IOS.
We investigate whether the tenor of these findings applies to the new goodwill impairment test reporting regime. In doing so, we focus on an accounting policy that has a strong link to the firm's IOS instead of investigating a general association between IOS and a range of accounting choices.4 Goodwill impairment reflects diminution of economic goodwill and, therefore, the firm's IOS. Accordingly, we predict a negative association between firms’ IOS and their reported goodwill impairment losses. This impairment loss write-off strategy enables financial statements to reflect firms’ relative levels of IOS. Our choice of accounting policy enables us to specifically predict the direction of the association between our investment opportunity measure reflecting economic goodwill and accounting for goodwill.
Consistent with our hypothesis that managers exercise accounting discretion to reflect underlying economic attributes, we find that as firms’ IOS increase, managers write off less goodwill impairment losses. This association is economically significant, with one standard deviation increase in IOS associated with a reduction in goodwill impairment loss charge of around 10 per cent of total assets. We also find significant associations between goodwill impairment write-offs and traditionally applied leverage, firm size and return on assets. However, the leverage and firm size associations are not as robust. Together with their economic performance, leverage and firm size, firms’ IOS generally explain more than 53 per cent of the variation in their reported goodwill impairment in the 2002–2004 reporting periods. Our results are consistent with, but stronger than, prior research findings of associations between US firms’ IOS and contracting variables and their goodwill amortization methods (Skinner, 1993).5 They are also consistent with findings of associations between traditional contracting variables and goodwill amortization (Skinner, 1993) or the decision whether to record a goodwill impairment transitional item at the time of SFAS 142 adoption or delay the recognition of such an impairment to appear as a normal operating item in the future (Beatty and Weber, 2006). We also find the association between IOS and the impairment loss write-off increases while the association with contracting incentives decreasing as time progresses. Economic performance is consistently the most dominant factor.
We provide evidence that adds to the credibility of financial statements as reports of economic attributes and that lends support to the FASB's contention that SFAS 142 allows firms to reflect their underlying economic attributes. This is important to users of financial statements, including researchers who use financial statement data as proxies for underlying economic characteristics. Our findings can help to explain why accounting for intangibles is associated with future profitability (see Henning et al., 2004) and with the market value of equity (see Barth and Clinch, 1998; Godfrey and Koh, 2001).
The rest of the present paper is structured as follows. Section 2 develops the general hypothesis to be tested. Section 3 discusses the sample selection, model and variable measurement. Section 4 presents the results and Section 5 concludes.
2. Hypothesis development
Early studies on the empirical link between IOS and accounting choice find that accounting discretion is exercised to align the interests of lenders, shareholders, managers and customers (e.g. Watts, 1977; Zimmer, 1986). Skinner (1993) expands the industry and institutional settings of this research and reports a relation between IOS and several accounting policy choices for a large sample of US firms ranging across multiple industries. He first links firms’ IOS to their accounting policies and then examines the incremental contribution of the IOS to contracting variables in explaining whether firms’ depreciation, inventory and goodwill accounting policies are income increasing or income decreasing. In doing so, he explains how IOS influence contractual specifications and, hence, why the contracting effects are indirect IOS effects.
This line of argument is consistent with the explanation of IOS impacts on the existence of debt contracts (Myers, 1977) and their specifications to reduce agency costs (Smith and Warner, 1979). Skinner (1993) finds that firms’ IOS are related to the nature of the firms’ contracts, and that traditional wealth-transferring contracting explanations for accounting policy choice are important. He finds a weaker direct relation between IOS and goodwill amortization. Using a less regulated reporting environment, a sample with greater variation in IOS, and more refined variable measures, Bradbury et al. (2003) find stronger associations between goodwill amortization and firms’ IOS.
Adopting another approach, Pincus and Wasley (1994) contend that firms in the same industry face similar IOS and can be expected to make similar accounting changes at around the same time. They find little industry and temporal clustering of voluntary accounting changes for their large cross-industry sample of firms. However, Pincus and Wasley (1994) do not allow for IOS differences, within industry, as firms move between growth, steady state or decline phases.
Godfrey (1994) finds that firms’ voluntary foreign currency accounting policies vary across firms in ways that reflect their underlying economic foreign currency risk exposures and the associated IOS. The policies also vary for the same firms over time in ways that reflect changes in their IOS. In contrast, Gupta (1995) finds only weak support for the view that firms’ partial or comprehensive income tax allocations reflect the firms’ IOS. However, his results provide general support for the managerial opportunism contracting perspective.
With few exceptions, prior investigations of associations between firms’ IOS and their accounting policy choices do not develop strong linkages between IOS and the accounting decisions. These studies usually draw on the general argument that IOS are difficult to measure and their value is highly subject to future managerial discretion so accounting-based clauses and covenants are unlikely to feature in management and debt contracts for firms with high growth options (Myers, 1977; Skinner, 1993). Nonetheless, managers would reasonably expect that financial reporting that accurately reflects their firms’ economic characteristics could usefully guide capital markets, if only by confirming information already available to the markets. This argument is consistent with findings that there is an association between the amounts that US firms wrote off as impairment losses prior to SFAS 142 and economic goodwill proxies (Henning et al., 2004). It is also consistent with the value relevance literature that finds an association between R&D or goodwill accounting and stock prices or returns (e.g. Barth and Clinch, 1996, 1998; Godfrey and Koh, 2001).6
Goodwill impairment loss recognition requires accounting discretion where the relation between the goodwill impairment write-off and the underlying IOS is intuitive but difficult to observe. At acquisition, purchased goodwill is the difference between the price paid for a firm and the fair value of the net assets acquired. It is the accounting analogue of the firm's IOS arising from synergies and other firm-specific advantages. After its initial recording, goodwill is difficult to measure objectively and there is, therefore, a high level of discretion available to managers in determining the amount to write off as an impairment loss.
The FASB claims that impairment tests will improve financial reporting and ensure that financial statements better reflect the underlying economic attributes of the firm. As such, examining the association between investment opportunity sets and goodwill accounting under the SFAS 142 requirements represents an ideal setting to establish whether managers use accounting discretion to reflect the underlying economic attributes of the firm.
Formally, the research question that we address is: Do firms’ goodwill impairment losses reflect the firms’ underlying IOS? To the extent that managers exercise their accounting discretion to reflect firms’ underlying economic attributes, we hypothesize that:
H1: The higher (lower) their investment opportunities, the less (more) firms write off as goodwill impairment.
3. Research design
3.1. Sample
If goodwill reporting were symmetrical, we would expect firms with high growth opportunities to sometimes write up their goodwill. However, under SFAS 142 goodwill might be written down as it is impaired but it might not be written up as it improves. Therefore, we focus on only those firms with impairment write-downs since it is impossible to establish which firms recording no impairment would, if allowed, have recorded goodwill enhancements.7 The sample comprises all Compustat firms reporting non-zero goodwill impairment losses and that have sufficient data to construct our variables in fiscal years 2002–2004. This results in 575 firm-year observations for 491 firms. Our sample mimics closely the industry distribution of Compustat firms with goodwill balances that do not report impairment losses over 2002–2004 (see Panel A of Table 1).
|
Panel A: Sample industry distribution |
||||||||||||
|---|---|---|---|---|---|---|---|---|---|---|---|---|
| Our sample | Compustata | |||||||||||
| All years | 2002 | 2003 | 2004 | All years | 2002 | 2003 | 2004 | |||||
| N | % | N | % | N | % | N | % | % | % | % | % | |
| Agriculture, forestry and fishing (01–09) | 0 | 0.00 | 0 | 0.00 | 0 | 0.00 | 0 | 0.00 | 0.14 | 0.24 | 0.12 | 0.06 |
| Mining (10–14) | 4 | 0.70 | 2 | 0.79 | 1 | 0.60 | 1 | 0.65 | 0.86 | 1.14 | 0.79 | 0.71 |
| Construction (15–17) | 1 | 0.17 | 1 | 0.40 | 0 | 0.00 | 0 | 0.00 | 0.39 | 0.41 | 0.42 | 0.32 |
| Manufacturing (20–39) | 329 | 57.22 | 139 | 55.16 | 102 | 60.71 | 88 | 56.77 | 58.41 | 57.71 | 58.24 | 59.13 |
| Transportation, communications, electric, gas and sanitary services (40–49) | 16 | 2.78 | 8 | 3.17 | 6 | 3.57 | 2 | 1.29 | 2.42 | 2.69 | 2.55 | 2.08 |
| Wholesale trade (50–51) | 19 | 3.30 | 7 | 2.78 | 4 | 2.38 | 8 | 5.16 | 3.53 | 4.08 | 3.58 | 3.05 |
| Retail trade (52–59) | 43 | 7.48 | 16 | 6.35 | 13 | 7.74 | 14 | 9.03 | 9.45 | 10.37 | 9.03 | 9.16 |
| Financial, insurance and real estate (60–67) | 8 | 1.39 | 4 | 1.59 | 2 | 1.19 | 2 | 1.29 | 1.02 | 1.06 | 0.97 | 1.04 |
| Service (70–88) | 146 | 25.39 | 70 | 27.78 | 38 | 22.62 | 38 | 24.52 | 23.36 | 21.96 | 23.88 | 23.91 |
| Other | 9 | 1.57 | 5 | 1.98 | 2 | 1.19 | 2 | 1.29 | 0.43 | 0.33 | 0.42 | 0.52 |
| Total | 575 | 100% | 252 | 100% | 168 | 100% | 155 | 100% | 100% | 100% | 100% | 100% |
|
Panel B: Dependent and control variables |
|---|
| Goodwill impairment loss (GWIL) = goodwill impairment loss before tax (#368)/total assets (#6) |
| SIZE = log (market value of equity, MVE, #199 × #25) |
| LEV = total debt (#34 + #9)/(total assets – goodwill (#6–#204)) |
| Return on assets (ROA) = (income before extraordinary items + goodwill impairment loss (#18 + #368))/(total assets – goodwill (#6–#204)) |
| Stock returns (RETt) = firms’ stock return over current fiscal year (Δpricet (#199)/pricet) |
|
Panel C: Investment opportunities variables used to construct investment opportunity set factor score |
|
|---|---|
| 1. | Investment intensity (INVINTt) |
 |
|
| where, i = t – 2 to t | |
| 2. | Geometric mean annual growth rate of market value of assets (MVAGRt) |
 where n = max{1, 2, 3}, for which data are available where n = max{1, 2, 3}, for which data are available |
|
| MVA = market value of assets | |
| = total assets (#6) – common equity (#60) + market value of equity (MVE, #199 × #25) – goodwill (#204) | |
| 3. | Market-to-book value of assets (MKBVAt) |
 |
|
| 4. | R&D expenditure to total assets (R&Dt) |
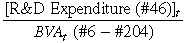 |
|
| 5. | Market-to-book value of equity (MKBVEt) |
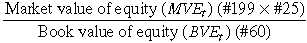 |
|
| 6. | Earnings-to-price ratio (EPt) |
 |
|
- a Compustat firms with goodwill balances in 2002–2004.
- Note: We convert the data item for goodwill impairment loss (#368) to positive figure before using it in the variable construction above.
- Note: We convert the data item for goodwill impairment loss per share (#307) to positive figure before using it in the variable construction above.
It is important statistically that our sample includes only firms disclosing reported goodwill impairment losses because we do not otherwise control for the materiality of the accounting write-off since doing so introduces endogeneity whereby both the dependent variable and an independent variable are functions of the goodwill impairment amount.8 In order to ensure a range of IOS, we do not exclude firms that are start-up, nor do we exclude firms in financial distress.
In untabled tests we find that our sample firms have a significantly lower median IOS measure than other Compustat firms that have goodwill balances but that do not report impairment losses over 2002–2004 (medians of –0.3101 and –0.1913, respectively; Wilcoxon p < 0.0001). This is consistent with the general theme of the present paper whereby firms with lower IOS are expected to write off more goodwill impairment losses than firms with high IOS. However, the two groups have similar IOS means (means of –0.0439 and 0.0057, respectively; p = 0.1756).
3.2. Dependent variable
We measure goodwill impairment loss (GWIL) as the firm's reported goodwill impairment loss before tax (#368) divided by total assets (#6). Our focus is on the application of the goodwill impairment loss reporting regime rather than upon how reporting is affected by a change in accounting policy per se. Hence, we do not include 2002 ‘below-the-line’ transitional goodwill impairment loss write-offs in our goodwill measurement. We deflate the goodwill impairment loss by total assets rather than earnings to avoid the statistical issues that arise from using a small, and sometimes negative, denominator.
3.3. Control variables
Panel B of Table 1 summarizes the dependent and control variable definitions. All variables are winsorized at the 1 per cent and 99 per cent levels.9 To ensure that the accounting treatment of goodwill and goodwill impairment losses do not influence our tests and findings, our control variables exclude capitalized goodwill from total asset measures and exclude goodwill impairment losses from earnings measures where relevant.10
The existence of debt contracts can provide managers with opportunistic reporting incentives to increase assets and income to reduce leverage ratios or relax interest coverage constraints. Accounting for goodwill has a smaller impact on debt covenant compliance than many other accounting policies because debt covenants often exclude intangibles from their leverage ratio constraints (Dichev and Skinner, 2002). The impairment test reporting regime can significantly impact on interest coverage constraints though, as the absence of an amortization charge increases the earnings numerator while the impairment loss reduces it. As any debt covenants are only likely to be relevant where firms have significant debt, we use a leverage measure to control for debt contracting incentives to manage the amount of goodwill impairment loss reported in any given year. Leverage is measured as total debt divided by total assets less goodwill (LEV). Traditional debt contracting arguments suggest that LEV is negatively associated with goodwill impairment losses since firms would be expected to try to maximize their earnings when they are close to their debt covenants. We do not use an earnings-based variable since Dichev and Skinner (2002) find considerable variation in the specification and level of earnings-based debt covenants.
Consistent with prior research, we control for firm size with the variable SIZE, measured as the natural logarithm of the market value of equity. We expect firm size to be positively associated with goodwill impairment losses if larger firms have incentives to lower earnings to avoid attracting potential political attention (Watts and Zimmerman, 1978).11 We acknowledge that firm size can proxy for many underlying firm attributes (Ball and Foster, 1982). However, this does not deny its suitability as a proxy for firms’ public visibility and their exposure to potential political costs, and while our sample firms are significantly smaller than the Compustat population (p < 0.01 for the pooled sample or p < 0.10 for individual years), SIZE can still proxy for political visibility within the sample. Since SIZE is used as a control variable, its capacity to control for other factors, such as the quality of management, legal and accounting services or potential economies of scale in operations, assists in separating the association of goodwill impairment amounts with firms’ IOS from a range of other potential associations.
We expect firms that are performing well are less likely to have goodwill impairment losses. As such, we expect both returns on assets and stock returns to be negatively associated with goodwill impairment losses. A contrary argument is that the managers of firms with poor returns are likely to attempt to manage earnings upwards to disguise their poor performance. If this argument holds, then the association would be positive. We measure return on assets (ROA) as (income before extraordinary items plus goodwill impairment losses) divided by (total assets less goodwill); and we measure stock returns (RET) over the firms’ current fiscal year.
3.4. Measuring investment opportunities
Consistent with Gaver and Gaver (1993) and Baber et al. (1996), we factor analyse six variables that the prior literature uses to capture a firm's underlying IOS. Baber et al. (1996) find these variables to be the variables that best describe firms’ IOS. They are: (i) investment intensity (INVINT) from years t – 2 to t; (ii) geometric growth in the market value of assets (MVAGR) from years t – 2 to t; (iii) market-to-book value of assets (MKBVA) at the end of year t; (iv) R&D expense to total assets (R&D) at the end of year t; (v) market-to-book value of equity (MKBVE) at the end of year t; and (vi) earnings-to-price ratio (EP) at the end of year t. Panel C of Table 1 describes how each variable is measured. Consistent with the measurement of our control variables, we exclude capitalized goodwill from total asset measures and goodwill impairment losses from earnings measures where relevant.12
The factor analysis on these variables yields one factor, IOS, which explains 93 per cent of the common variance underlying the six measures. Investment intensity (INVINT), R&D expense (R&D), market-to-book value of assets (MKBVA) and market-to-book value of equity (MKBVE) are the main variables loading positively on IOS. The remaining two proxies have only minor loadings on IOS. Given the loading patterns, we interpret the IOS factor as being positively related to firms’ IOS: as firms’ growth opportunities increase, so does the magnitude of the firm's IOS factor.
3.5. Model specifications
To test our hypothesis, we model firms’ goodwill impairment losses as a function of their IOS and control variables, as shown in model 1.
GWIL = α0 + β1IOS + β2SIZE + β3LEV + β4ROA + β5RET + ∑ βtYRt + ɛ
()The variables are defined as follows, with Compustat data item numbers indicated in parentheses:
| GWIL= | goodwill impairment loss, measured as goodwill impairment loss before tax (#368)/total assets (#6) |
| IOS = | IOS factor derived from six investment opportunity measures (see Table 1) |
| SIZE = | firm size, measured as natural logarithm of market value of equity (MVE, #199 × #25) |
| LEV = | leverage, measured as total debt (#34 + #9)/total assets – goodwill (#6 –#204) |
| ROA= | return on assets, measured as income before extraordinary items + goodwill impairment loss (#18 + #368)/total assets – goodwill (#6 –#204) |
| RET = | firm's stock return for the current fiscal year |
| YRt= | year-based dummy variables |
4. Results
4.1. Descriptive statistics
Table 2 reports the descriptive statistics (Panel A) and the correlation matrix (Panel B). Our sample firms exhibit large variation in the amount of reported goodwill impairment losses (GWIL), with a standard deviation of 0.6295 and an interquartile difference of nearly 18 per cent of total assets. Such variation facilitates examination of competing incentives in managers’ goodwill impairment discretion. Goodwill impairment losses represent a mean of around 25 per cent of reported earnings (losses) before extraordinary items and a median of around 16 per cent. The mean reported goodwill impairment loss is approximately 24 per cent of total assets and the median reported goodwill impairment loss is approximately 5 per cent of total assets.
|
Panel A: Descriptive statistics |
||||||||||||||
|---|---|---|---|---|---|---|---|---|---|---|---|---|---|---|
| Variables | Pooled (n = 575) | 2002 (n = 252) | 2003 (n = 168) | 2004 (n = 155) | Test of differences t-test p-valuesc | Test of differences Wilcoxon p-valuesc | ||||||||
| Mean (SD) | Median | Mean (SD) | Median | Mean (SD) | Median | Mean (SD) | Median | 2002 vs. 2003 | 2002 vs. 2004 | 2003 vs. 2004 | 2002 vs. 2003 | 2002 vs. 2004 | 2003 vs. 2004 | |
| GWIL | 0.2357 | 0.0482 | 0.3629 | 0.0918 | 0.0889 | 0.0316 | 0.1878 | 0.0285 | 0.0001 | 0.0131 | 0.0542 | 0.0001 | 0.0001 | 0.8175 |
| (0.6295) | (0.7900) | (0.1546) | (0.6176) | |||||||||||
| IOS | –0.0439 | –0.3101 | –0.0811 | –0.3209 | –0.0672 | –0.2777 | 0.0419 | –0.3181 | 0.8744 | 0.2085 | 0.2933 | 0.2964 | 0.1188 | 0.5153 |
| (0.9207) | (0.9176) | (0.8262) | (1.0181) | |||||||||||
| SIZE | 5.0508 | 4.9044 | 4.4302 | 4.2761 | 5.5327 | 5.2977 | 5.5373 | 5.4484 | 0.0001 | 0.0001 | 0.9876 | 0.0001 | 0.0001 | 0.9786 |
| (2.6869) | (2.6113) | (2.6408) | (2.5847) | |||||||||||
| LEV | 0.3138 | 0.2030 | 0.3299 | 0.1738 | 0.2890 | 0.2244 | 0.3145 | 0.2216 | 0.2909 | 0.7209 | 0.5217 | 0.3948 | 0.4827 | 0.9938 |
| (0.4087) | (0.4700) | (0.3213) | (0.3868) | |||||||||||
| ROA | –0.7827 | –0.2733 | –1.1389 | –0.6164 | –0.4651 | –0.2042 | –0.5477 | –0.0954 | 0.0001 | 0.0001 | 0.4377 | 0.0001 | 0.0001 | 0.0462 |
| (1.2219) | (1.4340) | (0.7504) | (1.1088) | |||||||||||
| RET | 0.1214 | –0.1988 | –0.3276 | –0.5687 | 0.7273 | 0.2289 | 0. 1946 | –0.0275 | 0.0001 | 0.0001 | 0.0015 | 0.0001 | 0.0001 | 0.0001 |
| (1.3944) | (1.0243) | (1.7940) | (1.1451) | |||||||||||
| Others | ||||||||||||||
| GW a | 453.6000 | 10.1700 | 374.6500 | 3.7300 | 506.3000 | 16.2100 | 524.8500 | 24.8000 | 0.3045 | 0.2581 | 0.9012 | 0.0002 | 0.0005 | 0.9136 |
| (1305.6700) | (1260.3200) | (1322.5500) | (1360.2200) | |||||||||||
| GWIL (% of income)b | –0.2523 | –0.1640 | –0.2900 | –0.2277 | –0.1131 | –0.1377 | –0.3419 | –0.1314 | 0.0719 | 0.6282 | 0.0735 | 0.0042 | 0.0842 | 0.5328 |
| (0.9998) | (0.7697) | (1.1027) | (1.1873) | |||||||||||
|
Panel B: Correlation matrix (n = 575) |
|||||
|---|---|---|---|---|---|
| Pearson (Spearman) correlation coefficients are reported below (above) the diagonal | |||||
| IOS | SIZE | LEV | ROA | RET | |
| IOS | –0.0422 | 0.1155 | –0.2610 | 0.0205 | |
| 0.3128 | 0.0056 | < 0.0001 | 0.6231 | ||
| SIZE | –0.1699 | –0.0109 | 0.5893 | 0.3157 | |
| < 0.0001 | 0.7946 | < 0.0001 | < 0.0001 | ||
| LEV | 0.2630 | –0.2079 | –0.0205 | 0.0909 | |
| < 0.0001 | < 0.0001 | 0.6246 | 0.0294 | ||
| ROA | –0.5192 | 0.4531 | –0.3522 | 0.4582 | |
| < 0.0001 | < 0.0001 | < 0.0001 | < 0.0001 | ||
| RET | 0.1476 | 0.0794 | 0.0720 | 0.1083 | |
| 0.0004 | 0.0570 | 0.0845 | 0.0094 | ||
Much more goodwill is written off as impairment losses relative to total assets in 2002 than in other years. The median GWIL values for 2003 and 2004 are around 0.03, but the 2002 median value is more than three times this measure (0.09). This is possibly because many firms wrote off large amounts in 2002 either because (i) they availed themselves of the opportunity to write off some impairment below the line (Beatty and Weber, 2006), or (ii) they reported more conservatively during 2002, a year of corporate governance reforms. The amounts written off in 2003 and 2004 do not differ significantly from each other and the median goodwill balance at year-end is lower in 2002 than in either 2003 or 2004, consistent with this interpretation. In general, we find firms that report goodwill impairment losses in 2002 are smaller and have worse accounting and stock return performances than those firms reporting goodwill impairment losses in other years.
As the descriptive statistics in relation to ROA indicate, firms reporting goodwill impairment generally are not profitable – just under 75 per cent of sample firms report a loss. Although the firms experience better capital market returns on average, more than half of the sample experience negative returns. Despite their poor accounting and stock return performance, firms reporting goodwill impairment losses do not appear to have been financially distressed. Indeed, the mean reported leverage (LEV) is around 31 per cent, and the third quartile is approximately 42 per cent.
For variables that concurrently enter into our model, the highest correlation coefficient reported in Panel B of Table 2 is 0.52 (0.59) for Pearson (Spearman) correlations. This is below 0.8 and unlikely to lead to multicollinearity (Kennedy, 1992). Diagnostic tests confirm this conclusion with the highest VIF being 2.28.
4.2. Multiple regression results: pooled analysis
Column 1 of Table 3 reports the results from the pooled regression. We adopt ordinary least-squares (OLS) regression for ease of interpretation. Given that the sample selection creates a truncated series, we also re-run the main tests using maximum likelihood truncated regressions (Greene, 2000). The unreported results lead to inferences about our variable of interest, IOS, that are qualitatively similar to those drawn from the main OLS regression results reported in the remainder of this section.
| Variables | Expected sign | Pooled | 2002 | 2003 | 2004 |
|---|---|---|---|---|---|
| (1) | (2) | (3) | (4) | ||
| Constant | –0.1639 | –0.3069 | –0.0248 | –0.0972 | |
| p-value | (0.0031) | (< 0.0001) | (0.3960) | (0.3354) | |
| IOS | – | –0.1049 | –0.1148 | –0.0538 | –0.1241 |
| p-value | (0.0008) | (0.0407) | (0.0011) | (0.0044) | |
| SIZE | + | 0.0153 | 0.0133 | 0.0063 | 0.0185 |
| p-value | (0.0011) | (0.0474) | (0.0203) | (0.1082) | |
| LEV | – | 0.1538 | 0.3977 | –0.0810 | –0.4106 |
| p-value | (0.0800) | (0.0091) | (0.0174) | (0.0167) | |
| ROA | – | –0.4095 | –0.4047 | –0.1909 | –0.5616 |
| p-value | (< 0.0001) | (< 0.0001) | (< 0.0001) | (0.0002) | |
| RET | – | –0.0072 | –0.0294 | 0.0138 | 0.0468 |
| p-value | (0.2330) | (0.0632) | (0.0754) | (0.0679) | |
| Year dummies | Yes | – | – | – | |
| Adjusted R2 | 0.5351 | 0.5761 | 0.5648 | 0.5674 | |
| N | 575 | 252 | 168 | 155 | |
| Wald tests, χ2: | |||||
| IOS = 0 | 10.1000 | 3.0600 | 9.6600 | 7.0500 | |
| p-value (two-tailed) | (0.0015) | (0.0801) | (0.0019) | (0.0079) | |
| SIZE = LEV = 0 | 11.9800 | 8.6800 | 7.5500 | 4.8100 | |
| p-value (two-tailed) | (0.0025) | (0.0130) | (0.0229) | (0.0904) | |
| ROA = RET = 0 | 94.1600 | 105.2100 | 37.6600 | 18.9500 | |
| p-value (two-tailed) | (< 0.0001) | (< 0.0001) | (< 0.0001) | (< 0.0001) | |
| SIZE = LEV = ROA = RET = 0 | 94.8500 | 107.4300 | 51.9300 | 21.3100 | |
| p-value (two-tailed) | (< 0.0001) | (< 0.0001) | (< 0.0001) | (0.0003) | |
- * p-values are two-tailed unless directional predictions are provided, and are based on White heteroscedacity consistent standard errors. Variable definitions as described in Table 1.
Consistent with expectations, higher IOS is strongly associated with lower reported impairment losses (p < 0.01). Furthermore, the findings are economically significant, where a standard deviation increase in IOS is associated with a decrease in goodwill impairment write-offs of around 10 per cent of total assets. The model's explanatory power is high at 53.5 per cent.
Firm size (SIZE) is positively associated with goodwill impairment write-offs (p < 0.01). This is consistent with political cost arguments that larger firms report greater impairment losses to lower their reported earnings and, hence, their exposure to public scrutiny. Given the high-profile corporate financial scandals occurring around this period and the associated corporate governance emphasis, it is likely that managers of larger firms would be especially keen to avoid apparent over-reporting of assets and earnings and be seen to be reporting conservatively. Alternatively, it could arise because large firms can afford to engage the most highly reputable providers of legal and other services and, in turn, highly reputable legal, accounting and auditing advisors’ viewed their reputations as being at stake in the post-Enron Sarbanes–Oxley environment of 2002.
It is interesting to note in this regard that the coefficient on SIZE is insignificant for 2004. Given that SIZE is a control variable, we do not investigate reasons for this result further. The SIZE result translates to a standard deviation increase in firm size being associated with an increase in goodwill impairment write-offs of around 4 per cent of total assets. In contrast, we do not observe significant associations between leverage (LEV) and goodwill impairment write-offs in the pooled sample (p > 0.05). The lack of a statistical association between firms’ leverage and the amount of goodwill impairment write-offs in pooled regression results (Column 1) might reflect the significant but opposite signs of the LEV coefficients across years, being positive in 2002 and negative in 2003 and 2004. Wald test results indicate that the leverage and size traditional contracting variables are jointly significantly different from zero (χ2 = 11.98, two-tailed p = 0.0025) although it appears that the SIZE variable drives this outcome.
The negative association between accounting returns (ROA) and the amount of goodwill impairment write-offs by firms (p < 0.01) suggests that firms with better performance write off less goodwill impairment. A standard deviation increase in ROA is associated with a decrease in goodwill impairment write-offs of 50 per cent of total assets. However, we find no evidence that stock returns are associated with goodwill impairment write-offs (p > 0.05). Wald tests indicate that the ROA and RET economic performance variables are jointly different from zero (χ2 = 94.16, two-tailed p < 0.0001) although the ROA variable is likely to drive this outcome.
Our pooled sample results suggest that under the impairment test regime, goodwill impairment discretion is driven largely by firms’ underlying economic attributes (both IOS and economic performance) while traditional wealth-transferring contracting factors have less, but significant, influence. These findings support the FASB's contention that the non-amortization, impairment test regime enables managers to reflect firms’ economic attributes in financial statements.
4.3. Multiple regression results: yearly regression analysis
In addition to the pooled regression analysis, we also perform yearly analysis to examine whether the influence of various incentives and factors are similar in the year of SFAS 142 introduction (2002) and the immediately subsequent years (2003 and 2004). Columns 2–4 of Table 3 report the yearly regression results.
There is an interesting pattern in the way that results for 2002 differ from the results for 2003 and 2004. For example, while the IOS variable is consistently negative across all years (p < 0.05), it is more statistically significant in 2003 and 2004 than in 2002. The contrast between the associations in the year of SFAS 142 introduction and subsequent years (2003 and 2004) is more evident for LEV. LEV is positively associated with impairment write-offs in 2002, contrary to expectation, and becomes negatively associated with impairment write-offs in the subsequent years. This is despite similar distributions of LEV across the years.13 The Wald tests indicate that the joint statistical significance of SIZE and LEV also diminishes from 2002 to 2004.
The positive sign on the LEV coefficient in 2002 is puzzling. A potential explanation is that given most sample firms report losses in 2002, they are likely to have already breached earnings-based private debt covenants, despite their low leverage. Dichev and Skinner (2002) find that private debt covenants are set tightly, that private debt covenant breaches are common, and that they are used as ‘trip wires’ and are not necessarily associated with financial distress. Firms with higher leverage might use above-the-line goodwill impairment write-offs to ‘clear the decks’ in the first year of SFAS 142 application to reduce the effects of future period impairment write-offs on private debt covenants. This is consistent with goodwill impairment written off in 2002 (approximately 36 per cent of total assets) being greater than the amounts written off in 2003 and 2004 (approximately 9 and 19 per cent of total assets, respectively).14 Without access to private debt agreements, we are unable to investigate this explanation further. Another potential perverse explanation is that in 2002, firms with higher leverage were especially careful to appear not to be manipulating earnings, given the scrutiny of accounts – particularly where earnings management incentives existed – pursuant to the outfall from corporate financial scandals.
The coefficient on the ROA economic performance variable is consistently negative across all years (p < 0.01) while RET is insignificant (p > 0.05). The Wald tests show that economic performance is jointly significant at the 1 per cent level across all years, largely driven by accounting returns.
For 2002, the association between goodwill impairment loss write-offs and IOS is economically significant, being around 11 per cent of total assets. For SIZE, the economic effect is around 4 per cent of total assets, and for LEV it is around 19 per cent of total assets. The ROA association with the amount of goodwill impairment losses written off is highly significant economically, at approximately 58 per cent of total assets.15
In subsequent years (2003 and 2004), IOS appears to be slightly more dominant in its association with goodwill impairment write-offs than the traditional contracting incentives, although the ROA economic performance variable remains the most economically significant. For this period, the economic effect of the IOS association is around 4 per cent (13 per cent) of total assets in 2003 (2004); for SIZE the 2003 effect is about 2 per cent of total assets; for LEV it is around 3 per cent (16 per cent) of total assets in 2003 (2004); and for ROA the economic effect is around 14 per cent (62 per cent) of total assets in 2003 (2004).
Overall, our yearly regression analysis provides evidence that the influences of various incentives and factors differ between the year of SFAS 142 introduction (2002) and the immediate subsequent years 2003 and 2004. Although economic performance measured as return on assets remains the most dominant factor across all years, the IOS effects increase their significance both statistically and economically in subsequent years. Wealth-transfer incentives appear strongest in 2002 and although still statistically significant at times, any likely wealth-transfer effects diminish in subsequent years. The opportunity provided by the transition arrangements associated with SFAS 142 introduction in 2002,16 in combination with the intense scrutiny of 2002 financial statements in the aftermath of various large-scale scandals and as the Sarbanes–Oxley Act came into effect, means that the 2003 and 2004 regression results are more likely to reflect ongoing reporting incentives.
4.4. Additional tests
Given that we focus on firms that have chosen to report goodwill impairment losses, we perform two additional tests to ensure our findings are not driven by this choice. First, we perform the same tests using Tobit regressions for a sample of firms with goodwill balances irrespective of whether they report impairment losses during the sample period. We use Tobit regressions because the dependent variable is censored at zero. Untabulated results from these tests yield results and conclusions that are qualitatively similar to those reported in Table 3 for both pooled and yearly regressions. The IOS variable of interest has the expected sign and similar significance levels. All other variables have similar signs and significance levels for the respective years, as reported in Table 3.
Second, we adopt the Heckman two-stage selection model to ensure self-selection does not drive our findings. In the Heckman tests, we use a sample of firms with goodwill balances irrespective of whether they report impairment losses during the sample period, as used in the Tobit regressions above. In the first stage, we obtain consistent estimates for γ from a Probit regression of a dummy variable, IMPAIR, on a set of control variables. We then use these estimates to calculate the inverse Mills ratio to include in the second stage regression. The second stage models are the same as model 1 described earlier plus the inverse Mills ratio. Specifically,
Selection model (Probit regression):
IMPAIR = γ0 + γ1LI + γ2SIZE + γ3LEV + γ4ROA + γ5RET + γ6LOSS + µ
Regression model (OLS):
GWIL = α0 + β1IOS + β2SIZE + β3LEV + β4ROA + β5RET + β6IMR + ∑ βtYRt + ɛ
()where:
| IMPAIR= | 1 if a firm incurred a goodwill impairment loss charge, and 0 otherwise |
| LI= | an indicator variable identifying firms likely to incur goodwill impairment loss charges (1 if the difference between market value of equity and book value of equity is less than the goodwill balance, and 0 otherwise) |
| LOSS= | 1 if a firm reported a loss, and 0 otherwise |
| IMR= | inverse Mills ratio |
All remaining variables are as defined previously. Taking potential self-selection bias into consideration does not alter our main findings and conclusions. Hence, we do not table the results. Specifically, the effects of IOS on goodwill impairment write-offs are both statistically and economically significant. Similarly, the yearly regression influences of various incentives and factors differ between the year of SFAS 142 introduction (2002) and subsequent years in a manner similar to those reported in Table 3. That is, the wealth-transfer incentives appear strongest in 2002 but diminish in subsequent years, while the influence of IOS increases across years.
In untabulated tests, we also examine potential industry effects on our main findings by including industry fixed effects in model 1. Including the industry fixed effect yields qualitatively similar results to those reported in Table 3 for both pooled and yearly regressions. The variable of interest (IOS) has the expected sign with marginally improved significance levels. All other variables have similar signs and significance levels for the respective years reported in Table 3.
In other untabulated tests, we examine whether prior IOS affects the impairment loss, in addition to the current year's IOS. Including prior IOS does not affect our main findings, and prior IOS is not statistically significant. These findings suggest our main findings are unlikely to be driven by a correlated omitted problem in the form of lagged IOS.
We also examine whether the results apply consistently across loss-making firms, the majority of our sample. The untabulated results are qualitatively similar to those of our full sample. Therefore, the present study also contributes to our understanding of the reporting behaviour of loss-making firms.
We also examine the association between auditor identity and firms’ goodwill impairment losses. First, using the 2002 sample, we examine whether former Arthur Andersen clients report different impairment loss levels from those reported by clients of other auditors. Next, using our pooled 2002–2004 sample and regressions for the individual 2002–2004 years, we examine whether Big Four auditors’ clients have systematically different impairment loss levels from those of non-Big Four clients (Big Four effect). We examine the Arthur Andersen effect (γ1) using model 2 while we examine the Big Four effect (γ2) using model 2a:
GWIL = α0 + β1IOS + β2SIZE + β3LEV + β4ROA + β5RET + ∑ βtYRt + γ1AA + ɛ
()GWIL = α0 + β1IOS + β2SIZE + β3LEV + β4ROA + β5RET + ∑ βtYRt + γ2BIG4 + ɛ
()where: AA is equal to 1 if Arthur Andersen is the auditor in 2001, and 0 otherwise; BIG4 is equal to 1 if a firm is audited by a Big Four auditor, and 0 otherwise. All other variables are as defined previously.
Out of our 252 observations in 2002, 26 (10 per cent) were former Arthur Andersen clients. Overall, 435 (76 per cent) of our total sample firm-year accounts were audited by Big Four auditors. In unreported tests, the main results reported in Table 3 persist with the same signs and significance levels under both models 2 and 2a. We find no evidence of an overall Arthur Andersen effect (γ1 = –0.0537; p = 0.4265), and BIG4 is only significant for 2003, where Big Four clients have significantly greater reported goodwill impairment losses than non-Big Four clients (γ2 = 0.0534; p = 0.0348).
5. Conclusion
The present study finds a strong negative association between US firms’ IOS and goodwill impairment write-offs in the first years after SFAS 142 introduction. Therefore, the goodwill accounting practices in the initial impairment regime years appear to match firms’ economic circumstances. The impairment regime enables firms with more (less) IOS, or economic goodwill, to reduce goodwill balances less (more) in order to report higher (lower) balances in the accounting analogue account, goodwill. Our results are consistent with managers making accounting decisions to reflect firms’ IOS. Hence, they support arguments for allowing accounting flexibility within regulation.
Furthermore, we find that not only is there a strong negative association between firms’ IOS and the amount of goodwill impairment they report, but there is also a negative association between the firms’ accounting returns and their reported goodwill impairment amounts. Again, this is consistent with expectations that firms faring well economically have less reason to record large impairment losses.
Overall, our findings support the arguments underpinning the introduction of SFAS 142 as a means of providing information relevant to users of financial statements. These findings are supplemented by evidence that the amount of goodwill written off is associated with firm size and leverage. However, these relations are not as stable as the associations between goodwill impairment loss write-off levels and IOS and ROA. Overall, the results indicate that accounting discretion is likely to be exercised in ways that are complex, reflecting incentives both to provide information about the firm's economic opportunities and to manage contractual and political payoffs, particularly when there are once-off opportunities to do so (see Holthausen, 1990; Watts and Zimmerman, 1990).
It is possible that the most important contribution of the present study is to substantiate the general integrity of a component of financial statements as a reflection of firms’ economic attributes. This is important to financial statement users, including researchers who use financial statement data to proxy economic characteristics. Our results imply that, at least in their initial years of adopting SFAS 142, managers generally use the flexibility allowed within the goodwill impairment reporting regime to reflect the economic value of underlying economic investment opportunities.