Vowel processing evokes a large sustained response anterior to primary auditory cortex
Abstract
The present study uses electroencephalography (EEG) and a new stimulation paradigm, the ‘continuous stimulation paradigm’, to investigate the neural correlate of phonological processing in human auditory cortex. Evoked responses were recorded to stimuli consisting of a control sound (1000 ms) immediately followed by a test sound (150 ms). On half of the trials, the control sound was a noise and the test sound a vowel; to control for unavoidable effects of spectral change at the transition, the roles of the stimuli were reversed on the other half of the trials. The acoustical properties of the vowel and noise sounds were carefully matched to isolate the response specific to phonological processing. As the unspecific response to sound energy onset has subsided by the transition to the test sound, we hypothesized that the transition response from a noise to a vowel would reveal vowel-specific processing. Contrary to this expectation, however, the most striking difference between vowel and noise processing was a large, vertex-negative sustained response to the vowel control sound, which had a fast onset (30–50 ms) and remained constant throughout presentation of the vowel. The vowel-specific response was isolated using a subtraction technique analogous to that commonly applied in neuroimaging studies. This similarity in analysis methodology enabled close comparison of the EEG data collected in the present study with relevant functional magnetic resonance (fMRI) literature. Dipole source analysis revealed the vowel-specific component to be located anterior and inferior to primary auditory cortex, consistent with previous data investigating speech processing with fMRI.
Introduction
A major goal in cognitive neuroscience is understanding how and where language is processed in the brain. The present study investigates the suitability of a novel approach to the study of speech sound processing in human auditory cortex using electroencephalography (EEG). Both EEG and magnetoencephalography (MEG) have become widely used in the study of speech and language processing as their millisecond temporal resolution enables investigation of the temporal properties of the brain response. A popular tool for the study of auditory processing using electrophysiological techniques is the mismatch negativity (MMN), which is a brain response elicited by a rare (deviant) stimulus occasionally presented in a sequence of frequent (standard) stimuli (see, e.g. Näätänen et al., 1978; Alho, 1995; Näätänen & Alho, 1995; Picton, 1995; Picton et al., 2000). The amplitude and topography of the MMN have been shown to depend upon the nature and salience of the acoustic or perceptual difference introduced in the deviant stimulus and the paradigm has been applied to the study of many sound features, including speech sound processing (Näätänen et al., 1997; Schulte-Körne et al., 1998, 2001; Rinne et al., 1999; Koyama et al., 2000; Shtyrov et al., 2000; Jaramillo et al., 2001; Pulvermüller et al., 2001, 2004; Eulitz & Lahiri, 2004).
An alternative approach for the study of feature-specific processing utilizes the ‘continuous stimulation paradigm’ (CSP) which involves preceding a test sound, which possesses the feature of interest, with a control sound that does not possess the feature, but whose acoustical properties match those of the test sound as far as possible. It is assumed that the response elicited by the transition from the control to the test sound reflects processing specific to the test feature as the response to sound energy onset has subsided and those neurons responsible for processing the features common to both the test and the control sound have adapted (Arlinger et al., 1982; Jones et al., 1991; Jones, 2003; Krumbholz et al., 2003; Ungan & Özmen, 1996; May et al., 1999; Ungan et al., 2001). An advantage of the CSP over the MMN approach is that recording times may be reduced; in the MMN paradigm, the standard stimulus must be presented on ∼ 80% of the trials in order to generate a reliable mismatch response, despite the fact that it is primarily the response to the deviant that is of interest.
Independent of the specific stimulation paradigm, the selection of an appropriate baseline stimulus is imperative in the study of speech processing to ensure appropriate interpretation of data with regard to speech- or language-specific processing (Scott & Wise, 2004). The current study carefully matched speech and nonspeech sounds such that the perception of the two sounds differed whilst the acoustic properties of the stimuli remained as consistent as possible. The use of such carefully matched stimuli together with the CSP revealed that the processing of vowel sounds is associated with a sustained response with an exceptionally short latency generated by an independent source anterior and inferior to that activated by nonspeech sounds.
Materials and methods
Participants
Fifteen participants (eight female, seven male, age range 23–40 years) took part in this study after giving written informed consent. All subjects were strongly right-handed, as assessed by a revised version of the Edinburgh inventory (Oldfield, 1971), and had no history of audiological or neurological disease. The experimental procedures conformed with the Code of Ethics of the World Medical Association (Declaration of Helsinki) and were approved by the Ethics Committee of the University of Nottingham Medical School.
Data acquisition
Auditory evoked potentials were recorded in an acoustically shielded room with an equidistantly arranged 61-channel EEG cap (Easy Cap; Falk Minow Services, Munich, Germany). Data were recorded continuously at a sampling rate of 500 Hz and were high-pass filtered on-line at 0.1 Hz. The participants watched a self-chosen silent movie during the recording. The quality of the EEG recording was monitored throughout and the data were stored on the computer for off-line processing. Three additional skin electrodes were positioned around the left eye to enable eye movement correction. The ground electrode was placed on a midline position on the forehead and, for on-line monitoring, data were referenced to an additional midline electrode in the occipital region, a little superior to the Inion.
Stimuli
The stimuli consisted of a 1000-ms ‘control’ sound and a 150-ms ‘test’ sound; on half of the trials the control sound was a randomly filtered noise and the test sound was a vowel, and for the remaining half of the trials the reverse was true (Fig. 1). The acoustic properties of the noise and vowel sounds were matched as far as possible, whilst still creating the perception of a vowel in one case but not the other. The vowel sounds consisted of noise, bandpass-filtered around the first three canonical formant frequencies of one of the vowels /a/, /e/, /i/ or /o/. Each of the three pass-bands had a bandwidth of ±10% around the respective formant frequency and was weighted according to a sloping (−6 dB per octave) spectral profile. The noise sounds were similarly filtered around three frequencies. However, in this case, each of the three frequencies was selected randomly from the range set by the lowest and highest frequency values of the respective formant for the four vowels, and the bandwidth of the filter pass-band increased to ±30% around the selected filter frequency. The larger bandwidth was used as a precaution to minimize the chance of the noises sounding like a vowel. The larger bandwidth also made the noises sound less like nonspeech human utterances (e.g. burps). The spectral change response at the transition was very similar for the noise-to-vowel stimulus and the vowel-to-noise stimulus (see Results), indicating that this difference in bandwidth had no significant effect on the response. Both vowel and noise sounds were multiplied with a periodic envelope mimicking the glottal pulse signal. The shape of each glottal pulse was approximated by a gamma function with a fast attack and an exponential decay with a half-life of 2.5 ms; the pulses were repeated at a rate of 100 Hz. The control and test sounds were gated on and off with a 5-ms cosine-squared ramp. At the transition from the control to the test sound the ramps overlapped, so that the envelope of the composite stimulus remained flat. The overall intensity of the sound remained constant throughout, at 65 dB SPL. The vowel sounds created a somewhat degraded (pathological), but highly identifiable, perception of the respective vowel. The pathological character of the vowels was due to the fact that they were produced using a filtered-noise rather than a complex-tone carrier. The sound quality of the noise could change considerably from trial to trial, depending on the randomly selected filter frequencies; however, the noise sounds were judged by the experimenters never to appear vowel- or speech-like. Although the vowel and noise stimuli were as acoustically similar as possible, we expected the unavoidable change in spectral composition from control to test sound to elicit a transition response in itself, independent of the sounds' perceptual attributes. Thus, both the transition from noise to vowel and from vowel to noise were presented to dissociate any neural activity specific to the perception of a vowel from the unspecific spectral change response present in both transitions.
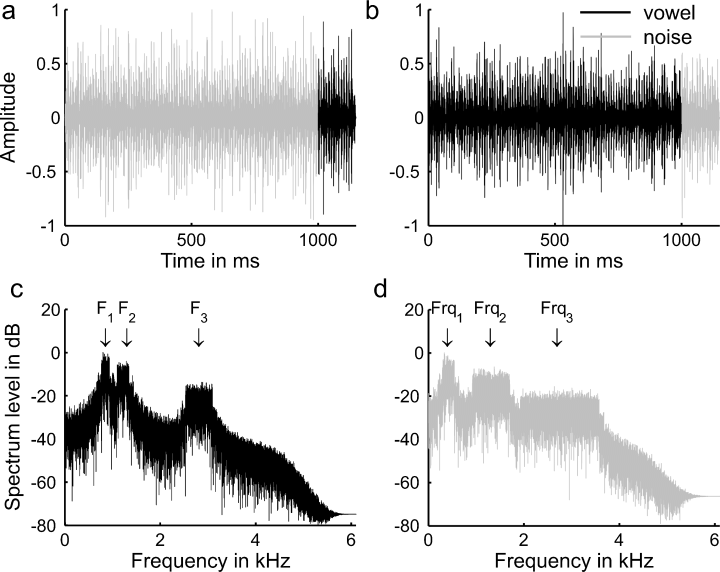
Temporal waveform of a noise that becomes a vowel (panel a; an /a/ in this example) and a vowel that becomes a noise (panel b). Panels (c) and (d) show the long-term spectra of a vowel (/a/) and a noise, respectively. The three formant frequencies around which the vowel sound was filtered are indicated by downwards arrows and are labelled F1, F2 and F3 (panel c) and the three random frequencies selected for the noise are labelled Frq1, Frq2 and Frq3 (panel d). Note the difference in bandwidth of the frequency bands between the vowel and noise.
The stimuli were generated digitally with a sampling rate of 12.2 kHz and a 24-bit resolution using Tucker Davis Technologies (TDT, Florida, USA) System 3 and Matlab. They were passed through a headphone amplifier (HB7, TDT) and presented diotically through headphones (K240 DF; AKG, Vienna, Austria). The stimuli were generated afresh throughout the experiment using new noise samples for every trial. The interstimulus interval (ISI; from end of one stimulus to onset of the next) was 1000 ms. Presentation of noise-to-vowel transitions were randomly interleaved with vowel-to-noise transitions, with each type of stimulus being presented a total of 600 times. Responses to individual vowel types were not analysed separately; rather, responses to all vowel sounds were pooled for each of the two types of transition. Comparing responses to different vowels would not have been meaningful in the current study, because any differences between the responses would have been confounded with the spectral differences between the corresponding vowels. Presentation of the stimuli occurred in three blocks of equal length, between which subjects had a short break.
Data processing and source analysis
The continuous raw data files were corrected for eye blink artefacts with the use of the Gratton et al. (1983) algorithm implemented by the BrainVision Analyser software (Brain Products, GmbH, Munich, Germany) and re-referenced to the average of all 61 channels. Data exceeding a max − min difference of 150 µV within 100 ms were considered artefactual and a 500-ms window surrounding the artefact was removed from subsequent analysis. After low-pass filtering at 35 Hz (with a 48 dB/octave slope), the data were divided into 2000-ms epochs, including a 500-ms prestimulus period, and baseline-corrected to the 200-ms period before the onset of the control stimulus. The epochs for each condition were then averaged for each subject, and the grand average across participants calculated for each stimulation condition. Equivalent dipole source analysis was employed to estimate the location of the neural generators of the responses (BESA 5.1; Gräfelfing, Germany) using a four-shell ellipsoidal volume conductor as head model. Further details of the dipole analysis are given in the Results section (Source modelling).
Results
Contrary to our initial expectation that vowel-specific processing would be reflected in the transition response, the most apparent difference between the responses elicited by the noise-to-vowel and vowel-to-noise stimuli was in the vertex-negative sustained response elicited by the respective sounds. Figure 2a and b shows that both the initial control portion and, to a lesser degree, the (much shorter) test portion of the stimuli elicited a sustained response. The sustained response was considerably larger when the eliciting sound was a vowel rather than a noise. This difference in sustained response between vowel and noise sounds can be seen particularly clearly in the time period from ∼ 400–1000 ms after stimulus onset as, in this time period, the sustained response is not superposed by any transient responses. A paired t-test of the average root-mean-square (rms) amplitude of the individual responses to the vowel and noise sounds within this time range confirmed that the difference was highly significant (t14 = 5.06, P < 0.001; compare Fig. 2c).
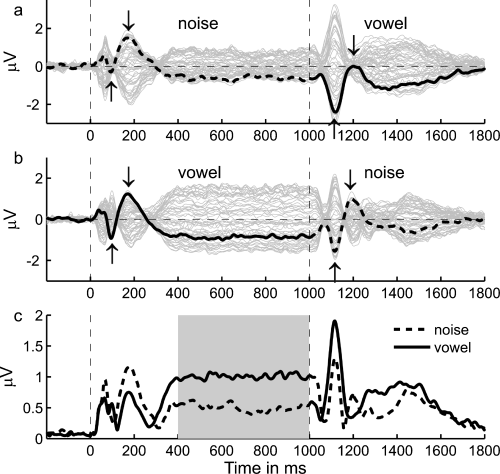
Grand-average evoked responses elicited by (a) the noise-to-vowel stimulus and (b) the vowel-to-noise stimulus from all 61 electrodes (grey traces). The recording from the vertex electrode (Cz) is shown in bold in these two panels. The root mean square (rms) amplitude, calculated across all channels, is shown in panel (c) for each stimulus. The response to the noise sound is represented by the dashed line and the response to the vowel sound represented by the solid line. The period from 400 to 1000 ms after stimulus onset, during which the difference in the size of the sustained responses elicited by the two kinds stimuli can be seen most clearly, is highlighted in grey in panel (c).
Transient responses were elicited both by the onset of the control sound and by the transition from the control to the test sound (see Fig. 2). The general morphology of these onset and transition responses differed considerably from one another. The onset response to both the noise (Fig. 2a) and vowel (Fig. 2b) sounds was triphasic, comprising a vertex-positive deflection peaking at ∼ 55 ms after sound onset (P1), a negative deflection peaking at ∼ 95 ms (N1) and another positive deflection peaking ∼ 177 ms (P2; the vertex channel, Cz, is shown in bold in Fig. 2a and b). In contrast, the transition response appeared to consist of only two deflections, a negative deflection peaking at ∼ 117 ms after the transition (henceforth referred to as tN1), followed by a positive deflection peaking at ∼ 208 ms (tP2). The negative deflections in both the onset and the transition response (N1 and tN1) were significantly larger in amplitude when the response was elicited by a vowel rather than a noise (N1: t14 = −2.45, P = 0.014; tN1: t14 = −4.19, P < 0.001; see upward pointing arrows in Fig. 2a and b). Conversely, there was a trend for the positive deflections (P1, P2 and tP2) to be smaller in amplitude for the vowel than the noise sounds; this trend was significant for the P2 and tP2 (P2: t14 = 1.92, P = 0.038; tP2: t14 = 3.50, P = 0.002; see downward pointing arrows). This pattern of results suggests that the differences between the transient (onset and transition) responses to the noise and vowel sounds were a consequence of the difference in the sustained responses elicited by the two types of stimuli (superposed on the transient responses), rather than representing actual differences in the transient responses themselves. This conjecture was confirmed by the difference between the responses for the two stimulus conditions shown in Fig. 3, which was generated by subtracting the response to the noise-to-vowel stimulus (Fig. 2a) from that to the vowel-to-noise stimulus (Fig. 2b). An enlarged view of the difference response around sound onset (Fig. 3b) reveals that the difference in sustained response between vowel and noise sounds (red line) began within the time range of the P1 (between 30 and 50 ms after stimulus onset) and had almost reached its full amplitude within the time range of the N1 (∼ 100 ms). Like the sustained parts of the original responses (black lines), the difference response then remained remarkably constant up to the transition, after which it switched its sign with a dynamic that was similarly fast and early as that of its onset (see Fig. 3c).
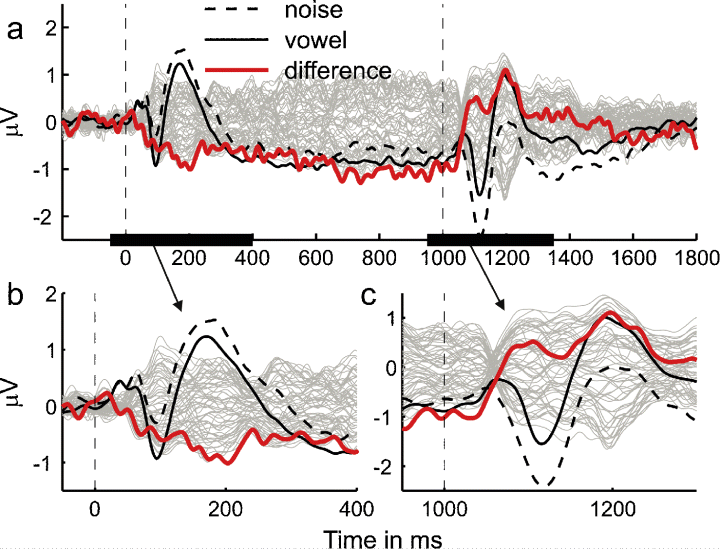
The grand-average of the response specific to the vowel over and above that to the noise (i.e. the difference response) is shown in grey for all channels. The channel with the largest difference response between 400 and 1000 ms after stimulus onset is highlighted in red. The vertex signal (Cz) of the original responses to the noise-to-vowel and vowel-to-noise stimuli are shown in black; as in Fig. 2c, the dashed line represents the response to a noise and the solid line represents the response to a vowel. Panels (b) and (c) show an enlarged view of the time ranges around stimulus onset and transition (indicated by the bold lines on the abscissa of panel a).
In addition to the difference in size of the sustained responses generated by the noise and vowel sounds, the channel traces in Fig. 2a and b also indicate a difference in the topography of the two responses. The bold trace illustrates the signal recorded from the vertex channel; this represents the largest (most negative) sustained response to the noise (Fig. 2a), but not to the vowel sound (Fig. 2b). Figure 4a and b, which shows the scalp distribution of the noise and vowel sustained responses, averaged over the period from 400 to 1000 ms after stimulus onset, reveals that the sustained response to the vowel (Fig. 4b) exhibited a more anterior topography than the response to the noise (Fig. 4a). This suggests that the larger sustained response to the vowel was generated by an additional source, located more anterior to the source of the sustained response to the noise. The topography of this additional source, which would be assumed to represent processes specific to the perception of vowels, is reflected in the scalp distribution of the difference between the vowel and noise responses (again, averaged over the 400–1000-ms time window), shown in Fig. 4c.
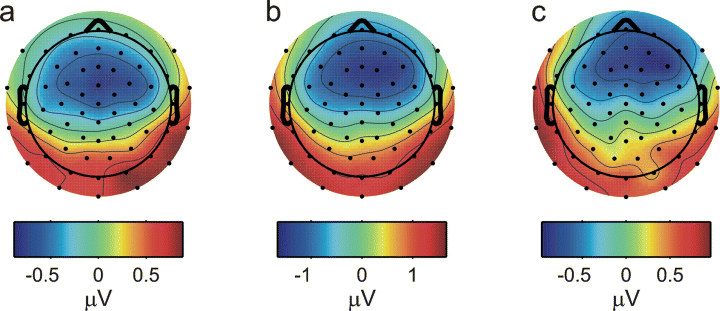
Scalp distributions of the grand-average sustained response averaged over 400–1000 ms after stimulus onset to (a) the noise and (b) vowel control sounds. The scalp distribution of the grand-average difference response (vowel − noise) averaged over the same time region is shown in panel (c).
Source modelling
Equivalent dipole modelling was used to estimate the source locations of the noise- and vowel-evoked sustained responses (BESA 5.1; see above). Using an approach similar to that of Gutschalk et al. (2002), we first determined the source of the noise-evoked sustained response by fitting the locations and orientations of two dipoles, one in each hemisphere, to the grand-average sustained response to the noise control sound within the time window from 400 to 1000 ms after stimulus onset (Fig. 2a). The locations of the dipoles were constrained to be mirror-symmetric about the mid-sagittal plane. Their orientations were unconstrained; this means that the dipoles would reflect not only tangential but also radial contributions to the activity. In auditory EEG data, the symmetry constraint is introduced to avoid obtaining biologically implausible solutions, which often come about because the scalp distribution of a bilateral response from auditory cortex looks similar to the distribution of a response from a single source in the centre of the head. In the current case, however, the symmetry constraint would not strictly have been necessary, as re-running the analysis without it yielded practically identical results. Based on previous findings (Gutschalk et al., 2002, 2004), it was assumed that the noise-evoked sustained response represented an unspecific response to the presence of sound energy and that it would thus also be active during the vowel sounds. Using the same procedure, two other dipoles were then fitted to the grand-average difference response (i.e. the difference between the vowel- and noise-evoked sustained responses; see Fig. 3) within the same time window to reflect the additional sustained activity generated by the vowel, over and above the unspecific noise response. The two sets of dipoles were then combined to a four-dipole model (with two dipoles in each hemisphere); within the fit window, the residual variance of the dipole model was 2.86% for the noise-sustained response and 1.34% for the vowel-sustained response. This model was used as a spatial filter to derive the activation time-course of each of the four sources (source waveforms) for the two stimulus conditions separately for each individual.
Based on the scalp distributions of the noise-evoked sustained response (Fig. 4a), we expected the source of the unspecific, energy-related response (reflected by the noise response) to be located within the region of the auditory cortex on the supra-temporal plane. In contrast, the scalp distribution of the difference response (Fig. 4c), representing the additional vowel-specific response, suggests a more anterior source, possibly outside the ‘classical’ (unimodal) auditory areas. This was indeed found to be the case, with the dipoles fitted to the noise response (shown in black in Fig. 5) located in the region of the auditory cortex on the supra-temporal plane, and the dipoles fitted to the difference response (shown in grey) located 15 mm anterior and 19 mm inferior to the noise dipoles. The location of the difference dipoles is consistent with activity arising from supra-temporal areas anterior to the primary auditory cortex, within the region of the planum polare.
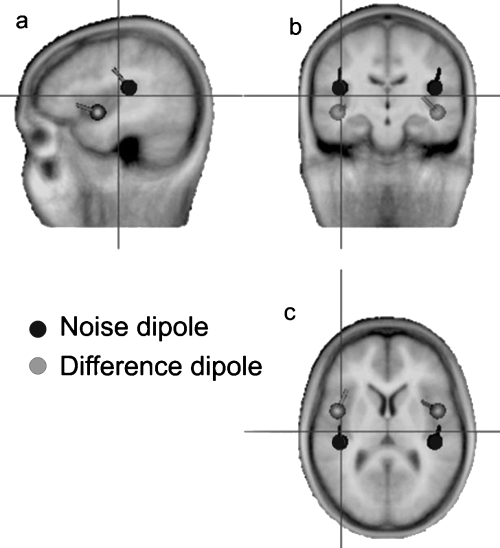
Locations and orientations of the noise (black) and difference (grey) dipoles fitted to the grand average data. The dipoles are shown projected to (a) a sagtittal, (b) coronal and (c) horizontal plane of an average brain (see crosshair). The noise and difference dipoles had approximate Talairach coordinates of ± 42.3, −25.7, 16.6, and ± 39.8, 9.4, 0.2 mm, respectively.
Figure 6 shows the grand average source waveforms for the noise dipoles (Fig. 6, upper panels, a and b) and the difference dipoles (Fig. 6, lower panels, c and d) to the noise-to-vowel and vowel-to-noise stimuli; the left and right panels show the results for the dipoles in the left and right hemispheres, respectively. In order to estimate each of the dipoles' source strengths for the noise- and vowel-evoked sustained responses, the mean amplitude of the respective source waveform was calculated over the time window 400–1000 ms after stimulus onset (highlighted in grey in Fig. 6) for each individual; these average source amplitudes are presented in Fig. 7. The source strength of the noise dipoles during the noise- and vowel-evoked sustained responses was practically identical (compare black bars across Fig. 7a and b), confirming the assumption that the noise dipoles represent a unspecific source common to the two types of sound. In contrast, the difference dipoles exhibited a large sustained response to the vowel but not the noise sounds (compare grey bars). This indicates that the increased sustained response to the vowels was indeed due to an additional source, represented by the difference dipoles. The interaction between source type (noise vs. difference dipoles) and stimulus condition (noise vs. vowel) in Fig. 7 was significant (F1,29 = 5.87, P = 0.022).
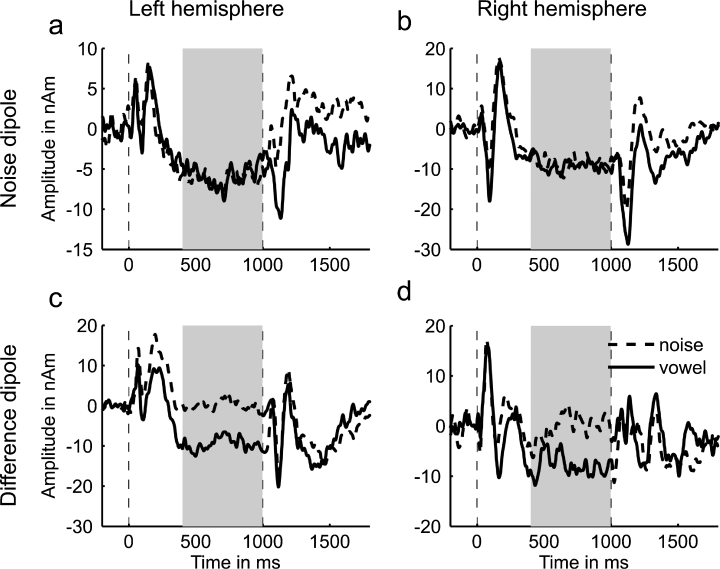
Grand-average source waveforms for each of the four dipoles. The source waveforms for the noise dipoles are shown in the top panels (a and b) and those for the difference dipoles are shown below (panels c and d). The left and right panels show responses from the left- and right-hemisphere dipoles, respectively. As in previous figures, the dashed lines represent the response to the noise and the solid lines the response to the vowel. Stimulus onset and the transition from one sound to the other are indicated by dashed vertical lines. The shaded area indicates the area over which source amplitudes were averaged for further analysis.
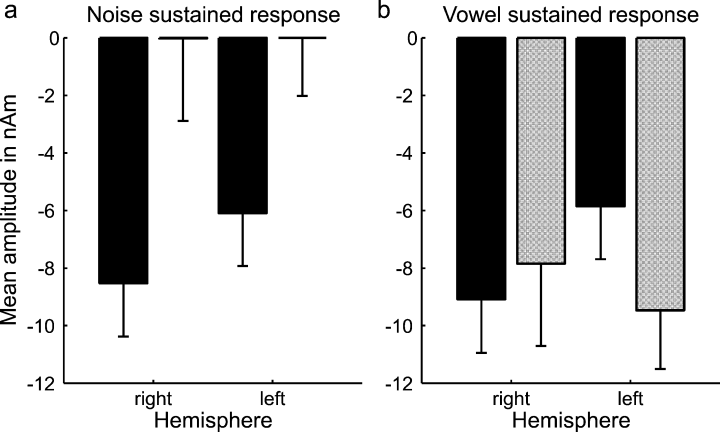
Mean (and SEM) source strengths (averaged over 400–1000 ms after stimulus onset, see grey shaded area in Fig. 6) of the noise (solid bars) and difference dipoles (shaded bars) for (a) the noise- and (b) vowel-evoked sustained responses, shown for the left and right hemispheres.
Hemispheric differences
It is often assumed that processes relating to speech perception are lateralized towards the left hemisphere. However, the literature on this question remains highly controversial (for a recent review, see Shtyrov et al., 2005). In the current data, there was a general trend for the unspecific, energy-related sustained response, reflected by the noise dipoles, to be larger in the right hemisphere than the left (see black bars in Fig. 7). This effect is also evident in the scalp distribution of the original channel data, where the response to the noise sounds is skewed towards the right hemisphere (Fig. 4a). This is particularly visible at positive polarity (highlighted in red). Interestingly, neither the scalp distribution nor the source strengths for the vowel-specific sustained response, represented by the difference between the vowel- and noise-evoked responses (Fig. 4c and grey bars in Fig. 7b), show this pattern. Here, the trend was for the response to be larger in the left hemisphere than the right. However, this trend did not reach statistical significance across the whole data set. A closer inspection of the data prompted us to consider the effects of gender on the lateralization of the vowel-specific response. We found that, whilst the interaction between gender and hemisphere did not reach statistical significance, t-tests showed that the vowel-specific response was significantly larger in the left hemisphere than the right for males (t6 = 2.832, P = 0.03) but not for females (t7 = −0.553, P = 0.598).
Discussion
This study applied the continuous stimulation paradigm to investigate the neural correlates of vowel perception in human auditory cortex. The speech (vowels) and nonspeech stimuli (noises) were carefully matched to ensure that any difference in the evoked responses to the two types of sounds could be attributed to ‘vowel-specific’ processing mechanisms, rather than acoustic differences between the sounds. We initially expected any vowel-specific response to be transient in nature and, similar to other feature-specific responses, such as the pitch onset response (Krumbholz et al., 2003) or the response to a change in interaural correlation (Chait et al., 2005), to be most obvious at the transition from the control to the test portion of the stimuli. However, we found that the main difference between the noise- and vowel-evoked responses was a large and rapid sustained response to the vowels, which was present during the control portion of the vowel-to-noise stimulus and, to a lesser degree, also the test portion of the noise-to-vowel stimulus. This vowel-specific sustained response began within the time window of the P1 deflection in the transient response at sound onset (30–50 ms after sound onset) and lasted throughout stimulus presentation. Due to this sustained response, the negative deflections in the transient responses to the onset of the vowel control sounds and the transition from a noise to a vowel appeared enhanced, and the positive deflections diminished relative to the corresponding deflections in the respective noise-evoked responses.
Eulitz et al. (1995) similarly found a large sustained negativity following prolonged (600 ms) presentation of vowel sounds. However, in their study subjects performed a task in which they were asked to detect a particular vowel, and so increased attention or vigilance during the vowel compared to the control stimuli could not be excluded as the cause of this sustained response. Evidence that the amplitude of the sustained response increases when subjects attend to auditory stimuli (Picton et al., 1978; Hari et al., 1989; Sieroka et al., 2003) would support the attention-related explanation of the response. In contrast, as all stimuli in the present study were presented passively whilst subjects watched a silent movie, we are confident that the vowel-evoked sustained response was a result of stimulus-related differences rather than attentional discrepancies between stimulus conditions.
The selection of an appropriate baseline against which to compare responses evoked by speech sounds is an issue of concern in the study of speech and language processing, as it can be difficult to separate the effects of phonological processing from effects due to more basic (nonphonological) perceptual and acoustic differences between the test and control stimuli (Scott & Wise, 2004). In the current experiment, the general properties of the noise sounds almost exactly matched those of the vowel sounds, and the actual spectral composition of both types of sounds was randomised from trial to trial (by randomly presenting one of four different vowels in the case of the vowels, and by randomising the ‘formant’ frequencies in the case of the noises). Thus, it seems justified to interpret the differences between the noise- and vowel-evoked responses in the current study on the basis of the phonological differences between the sounds, because the other differences were varied randomly from trial to trial.
One approach for the study of speech-specific processing is to conduct cross-lingual studies, which exploit the fact that different languages comprise different speech sounds (Dehaene-Lambertz, 1997; Näätänen et al., 1997; Winkler et al., 1999; Dehaene-Lambertz et al., 2000). Rather than presenting speech and nonspeech sounds to individual participants, responses to identical sounds are compared across participants with different linguistic backgrounds. As the stimuli are acoustically identical, issues regarding appropriate baselines are avoided. Typically, a control sound is chosen which is a prototypical speech sound in the native language of both groups of subjects, whilst the test sound is a prototypical speech sound in the language of one group of participants but not the other. For example, Näätänen et al. (1997) conducted an MMN experiment on Finnish and Estonian participants, in which the standard (/e/) and all deviants (/ö/, /õ/ and /o/) were prototypical speech sounds in Estonian, and all but the deviant /õ/ were prototypical speech sounds in Finnish. The amplitude of the MMN in Estonian participants depended only on the size of the frequency difference between standard and deviant sounds. In the Finnish participants, the same pattern was true for the prototypical speech sounds; however, the MMN was considerably smaller to the deviant /õ/, which was not perceived as a speech sound by these participants. That the MMN is larger to familiar speech sounds (Dehaene-Lambertz, 1997, 2000; Näätänen et al., 1997; Winkler et al., 1999), and to words compared to pseudo-words (Pulvermüller et al., 2001, 2004; Shtyrov & Pulvermüller, 2002; Endrass et al., 2004) has been interpreted in terms of the activation of a ‘language-specific’ memory trace in addition to the activation resulting from the acoustical properties of the sound. The current study indicates the existence of a phonology-specific vertex-negative sustained response. Such a phonology-related response may explain the enhanced size of the MMN to language-relevant stimuli, as it would enhance the amplitude of the negative deflections to speech deviants relative to nonspeech deviants.
The scalp distribution maps and the results of the source analysis indicate that the vowel-specific sustained response was generated by a different neuronal population to that responsible for the sustained response to the noise. The dipole location for the noise-evoked sustained response was consistent with activity within the region of auditory cortex on the supra-temporal plane. In contrast, the dipole location for the vowel-specific ‘difference’ response indicated activity further anterior and inferior, probably in the region of the planum polare or, less probably, the superior temporal sulcus. The difference dipole seems too anterior to be in the region of the ‘classical’ (unimodal) auditory cortex. The planum polare has previously been implicated in processes associated with language comprehension (Friederici et al., 2000a,b; Meyer et al., 2000) as well as music processing (Koelsch et al., 2002). Phonology-specific activity anterior to primary auditory regions is inconsistent with conventional neuroanatomical models of language processing, which stress the importance of the posterior extent of the superior temporal gyrus, including the planum temporale (PT; Wernicke, 1874; Geschwind & Levitsky, 1968; Braak, 1978; Foundas et al., 1994). However, it has since been suggested that the role of the PT may have been over-emphasized in traditional models of language (Binder et al., 1996, 1997), as much recent neuroimaging research has converged on the importance of relatively anterior and inferior regions for the processing of speech and language (Binder et al., 1996, 1997, 2004; Binder, 2000; Scott et al., 2000; Obleser et al., 2003, 2006; Scott & Johnsrude, 2003; Warren et al., 2006). These results are supported by findings that the processing of object-related sound features predominantly engage a pathway of areas anterior to primary auditory cortex (‘what’ pathway), whereas areas posterior to the primary auditory cortex, most importantly the PT, seem to be more responsive to changes in spatial sound attributes (‘where’ pathway; Rauschecker & Tian, 2000; Tian et al., 2001; Zatorre et al., 2004; Scott, 2005). Scott & Wise (2004) propose that regions posterior to primary auditory cortex, including the PT, are involved in the analysis of temporal patterns within sounds as opposed to the processing of speech sounds per se. This hypothesis is based on reports that the PT responds to sequences of sounds as simple as tones (Binder et al., 1996), and to signal-correlated noise (noise modulated with the temporal envelope of speech), which contains the temporal information mediated by speech but does not contain the corresponding spectral information necessary to recognize the words from which they were formed (Wise et al., 2001). Similarly, Jäncke et al. (2002) explain their finding that the PT responds more strongly to CV syllables than to tones, noises or vowels in the framework of Tallal and coworkers' hypothesis that the PT contains neurons that specialize in the processing of rapidly changing acoustic cues, irrespective of the speech-like qualities of the sounds (Tallal et al., 1993; but see also Schönwiesner et al., 2005). The data reported in the current study are consistent with these hypotheses, as the source of the response to the vowel sounds, which contained rich spectral information but little temporal variation, was found to be anterior to primary auditory cortex rather than on the PT. Scott (2005) suggests that the anterior stream becomes progressively more responsive to intelligible speech along its length, until areas specifically in left anterior superior temporal sulcus respond to intelligible speech (Scott et al., 2000; Narain et al., 2003). Our data indicate that there is a centre on the anterior supra-temporal plane, in the region of the planum polare, which is sensitive to the perception of simple phonemes. The sounds' vowel-like perceptual quality, in addition to their acoustic structure, was necessary for activation in this region, as the equally spectrally complex noises did not activate this area. However, this region appears to represent a relatively ‘low-level’ language area, as semantic content was not necessary to elicit activation. Recent functional magnetic resonance imaging (fMRI) data similarly indicate that activity is evoked in regions anterior to auditory cortex during the processing of simple vowel stimuli (Obleser et al., 2006). The subtraction technique employed in the current study to identify the ‘vowel-specific’ component of the response closely mirrors the technique commonly employed in fMRI studies, in which the response to a control stimulus is subtracted from that elicited by a test stimulus to reveal the response associated with processes invoked by the test but not the control stimulus. This similarity in analysis procedure allows close comparison between results obtained by the two complementary techniques, and may explain why the current EEG results show such high concordance with previous fMRI data.
The transition from a noise to a vowel and from a vowel to a noise produced a prominent transient response; however, the main difference between the responses to these two kinds of transition was due to the difference in the sustained response elicited by the vowel and the noise sounds, rather than a difference in the transient responses themselves. This suggests that the transient responses represent a spectral change response, similar to that elicited by a change in frequency or intensity of an otherwise continuous pure tone (see, e.g. Arlinger et al., 1982; for a review, see Näätänen & Picton, 1987) and show little or no sensitivity to phonological processing. In MMN studies, a sequence of discrete sounds is presented in relatively fast succession. Presenting a speech deviant in a sequence of different speech or nonspeech standards would be expected to be accompanied by a spectral change similar to the spectral change between the noise and vowel sounds in the current experiment. Unless a cross-lingual approach is used (Dehaene-Lambertz, 1997; Näätänen et al., 1997; Winkler et al., 1999; Dehaene-Lambertz et al., 2000) or more complex stimulus designs are applied (Pulvermüller et al., 2001; Shtyrov & Pulvermüller, 2002; Shtyrov et al., 2005), it would be difficult to dissociate the speech-specific components from the unspecific spectral change response. This may explain why the locus of the speech-related MMN has on occasion been reported to be close to Heschl's gyrus, within ‘classical’ (unimodal) auditory cortex (Alho et al., 1998; Shestakova et al., 2002). Indeed, fitting a dipole to the response elicited by the vowel sound in the current study gave rise to a dipole much closer to primary auditory cortex within the region of the anterior bank of Heschl's gyrus (data not shown); it was only by subtracting the response to the noise stimulus and fitting the dipole to the vowel-specific difference response that the anterior location of the vowel-specific response became apparent.
Evidence that language processing occurs predominantly in the left hemisphere was reported over a hundred years ago, when it was shown that left-hemisphere lesions lead to disturbances in speech production and perception (Broca, 1861; Wernicke, 1874). The findings of many, though not all, experimental studies conducted since this time have supported the hypothesis that the left hemisphere is specialized for the processing of language. What is more controversial, however, is the level at which the processing of speech sounds becomes lateralized. Some researchers have found a left hemisphere dominance for the passive processing of speech sounds (Rinne et al., 1999; Shtyrov et al., 2000), whilst others have found that attention to the speech sounds is required before lateralization is reliably detected (Poeppel et al., 1996). Other findings indicate that functional lateralization is not evident until phonemes are presented in the context of words, suggesting that it is the higher levels of speech perception that are left-lateralized rather than the processing of the acoustic properties of speech sounds (Pulvermüller et al., 2001; Shtyrov et al., 2005). Dipole source analysis was employed in the current study to determine the presence or otherwise of vowel-specific hemispheric lateralization in the absence of attention to the stimuli. The source analysis revealed that the nonspecific response to the noise stimulus tended to be larger in the right hemisphere than the left, and that the opposite was true for the vowel-sustained response represented by the difference dipole. Closer inspection of the data revealed that this trend was a consequence of a significant left hemisphere lateralization in the vowel-specific responses recorded from the male participants. In contrast, the responses recorded from female participants showed no trend towards leftward lateralization for the vowel response. While the interaction between gender and hemisphere did not reach statistical significance, these results suggest that there may be a link between gender and hemispheric lateralization in speech perception. Research into gender effects on the lateralization of language processing has shown mixed findings, seemingly dependent on the level of language processing investigated, but many studies have indicated that males do tend to show a greater degree of functional lateralization than females (see Kansaku & Kitazawa, 2001 for a review). One proposed explanation as to why this may be the case cites the interhemispheric connection delay (Ringo et al., 1994); the relative size of the isthmus of the corpus callosum, which contains commissural fibres connecting the language areas, has been shown to be larger in female than in male brains (Steinmetz et al., 1992; though see Bermudez & Zatorre, 2001), suggesting a greater efficiency and speed of interhemispheric connections between language areas, and thus a reduced need for functional lateralization, in females. Not all studies have found greater language-related lateralization in male brains, however. A study that would appear to be particularly relevant in the present context investigated the lateralization of vowel processing and, contrary to its initial hypothesis as well as the current results, found evidence that the evoked response to a vowel sound was left-lateralized in females but not males (Obleser et al., 2001). In that study, the analysis was restricted to the peak amplitude of the N1 response, and the large sustained fields elicited by the sounds were not considered. In addition, the subjects attended to the sounds and, as attention is known to interact with the processing of vowels (Hugdahl et al., 2003), it is possible that this interaction may have influenced the relationship between gender and lateralization of the evoked responses.
Conclusion
By presenting vowel sounds immediately after carefully matched noise sounds we hoped to isolate any vowel-specific neural processing from that elicited by the onset of sound energy, and from the features common to both noise and vowel sounds. We believe that we have isolated features of the neural response which are specific to the processing of speech sounds, though not necessarily in the way that we had anticipated. Rather than the transition response from a noise to a vowel revealing features of ‘vowel-specific’ processing, it was the sustained response, generated by the prolonged presentation of the vowel sound as the control stimulus, which provided the most striking vowel-specific response. Source analysis revealed that this vowel-specific response was located anterior to primary auditory cortex, and may form part of the anterior ‘what’ processing stream.
Acknowledgements
This research was supported by the Medical Research Council (UK) and Deafness Research UK.
Abbreviations
-
- CSP
-
- continuous stimulation paradigm
-
- EEG
-
- electroencephalography
-
- fMRI
-
- functional magnetic resonance imaging
-
- MEG
-
- magnetoencephalography
-
- MMN
-
- mismatch negativity
-
- PT
-
- planum temporale


