A novel RNA binding protein that interacts with NMDA R1 mRNA: regulation by ethanol
Abstract
Excitatory NMDA receptors are an important target of ethanol. Chronic ethanol exposure, in vivo and in vitro, increases polypeptide levels of NR1 subunit, the key subunit of functional NMDA receptors. In vitro, chronic ethanol treatment increases the half-life of NR1 mRNA and this observation is dependent on new protein synthesis. The present study was undertaken to locate cis-acting region(s) within the NR1 3′-untranslated region (UTR) and identify NR1 3′-UTR binding trans-acting proteins expressed in mouse fetal cortical neurons. Utilizing RNA gel shift assays we identified a 156-nt cis-acting region that binds to polysomal trans-acting proteins. This binding was highly specific as inclusion of cyclophilin RNA or tRNA did not interfere with cis–trans interactions. Importantly, the 3′-UTR binding activity was significantly up-regulated in the presence of ethanol. UV cross-link analysis detected three NR1 3′-UTR binding proteins and their molecular mass calculated by Northwestern analysis was ∼88, 60 and 47 kDa, respectively. Northwestern analysis showed a significant up-regulation of the 88-kDa protein after chronic ethanol treatment. The 88-kDa protein was purified and identified by tandem mass spectrometry as the beta subunit of alpha glucosidase II (GIIβ). That GIIβ is indeed a trans-acting protein and binds specifically to 3′-UTR of NR1 mRNA was confirmed by RNA gel mobility supershift assays and immuno RT-PCR. Western blotting data established a significant increase of GIIβ polypeptide in chronic ethanol-exposed fetal cortical neurons. We hypothesize that the identified cis-acting region and the associated RNA-binding proteins are important regulators of NR1 subunit gene expression.
Introduction
Functional NMDA receptors are heteromeric and require assembly of the NR1 subunit with members of the NR2 and/or the NR3 family (Luo et al., 1997; Das et al., 1998). The NR1 subunit has eight splice variants (Zukin & Bennett, 1995) and is the key subunit as functional NMDA receptors are not formed without it (Forrest et al., 1994). NMDA receptors play a pivotal role in normal physiological processes in the central nervous system (CNS) and are an important target of ethanol. Chronic exposure to ethanol induces a number of adaptive processes in the CNS, including an up-regulation of NMDA receptor number and function both in vivo and in vitro (Sanna et al., 1993; Hu & Ticku, 1995; Devaud et al., 2000; Nagy et al., 2003) with a concomitant increase in NR1 and NR2B polypeptide (Trevisan et al., 1994; Follesa & Ticku, 1996; Kumari, 2001) and NR2B mRNA levels (Follesa & Ticku, 1995). In vitro, chronic ethanol exposure increases the half-life of NR1 mRNA (Kumari & Ticku, 1998) and this half-life returns to control values upon inhibition of new protein synthesis in ethanol-treated fetal cortical neurons (FCN) (Kumari et al., 2003). These data allude to the importance of ethanol-mediated synthesis of protein(s) in the regulation of NR1 mRNA decay.
RNA–protein interactions are critical players in the regulation of gene expression, including regulation of mRNA decay. In many instances trans-acting proteins interact with defined cis-acting regulatory sequences within the 5′ or 3′ untranslated regions (UTRs). Several mRNA-binding proteins that have been identified (Pesole et al., 2001) are either key factors involved in the regulation of mRNA stability (Guhaniyogi & Brewer, 2001) or are associated with mRNAs during their transport from the nucleus to the cytoplasm or to their site of translation (Lawrence & Singer, 1986; Fulton, 1993; Shiina et al., 2005). To delineate the molecular determinants that regulate ethanol-mediated gene expression of the NR1 subunit, we initiated studies to detect possible RNA–protein interactions for NR1 3′-UTR. The NR1–3 and NR1–4 splice variants that are expressed in cultured mouse FCN (Kumari, 2001) have identical 3′-UTR sequences spanning 879 nt (present study). Using a RNA gel mobility shift assay, a 156-nt cis-acting region was defined within 879 nt. A single RNA–protein complex observed in RNA gel shift assays was resolved into three proteins by UV cross-linking. Their apparent molecular mass of ∼88, 60 and 47 kDa, respectively, was determined by Northwestern analysis. Northwestern analysis showed a significant increase in intensity of the 88-kDa protein−3′-UTR complex in ethanol-exposed FCN (50 mm, 5 days). Expression of NR1 3′-UTR-binding proteins in control FCN suggests their importance in the normal regulation of NR1 gene expression. The 88-kDa protein was purified and identified by tandem mass spectrometry as the beta subunit of alpha glucosidase II (GIIβ). RNA supershift assays and immunoprecipitation and RT-PCR (immuno RT-PCR) performed using GIIβ antibody confirmed the presence of GIIβ in the RNA–protein complex. Western blot analysis established the ethanol-mediated up-regulation of GIIβ in cultured FCN.
Materials and methods
Cell culture
FCN isolated from 14- to 15-day-old mouse fetuses were cultured as described (Kumari, 2001). Time-pregnant mice (strain C57 BL/6) purchased from Harlan (Indianapolis, IN, USA) were used in accordance with institutional guidelines, and procedures were approved by the animal welfare committee. Animals were killed by cervical dislocation and fetuses were recovered. Cerebral hemispheres dissected from fetuses under sterile conditions were processed to establish cortical neuronal cultures as described (Kumari & Ticku, 1998).
Preparation of polysomes
FCN cultured in the presence and absence of 50 mm ethanol for 5 days were used to prepare polysomal fractions according to the procedure described (Brewer & Ross, 1990). Aliquots of polysomes were stored at −80 °C until further use. Protein concentration in polysomes was determined by the Bradford method (Bradford, 1976). To verify the consistency of polysomal preparations we routinely confirmed, by Western blotting, ethanol-mediated up-regulation of NR1 protein in the polysomal fractions (Kumari, 2001). We also processed the polysomal preparations for examination under the electron microscope.
Anchored PCR amplification of 3′-UTR(s) of NMDA R1 splice variants expressed in cultured FCN
Poly(A)+ RNA was purified using total RNA from control and ethanol-treated (50 mm, 5 days) FCN. To amplify 3′ ends of the NR1 splice variants expressed in cultured FCN, 3′ rapid amplification of cDNA ends (RACE) was performed using poly(A)+ RNA and 3′ RACE system (Life Technologies; now Invitrogen, Carlsbad, CA, USA) according to the manufacturer's instructions. Briefly, the poly(A)+ RNAs were reverse transcribed using an adaptor-dT17 primer to synthesize the first strand of cDNA. Second strand of cDNA was synthesized using NR1 gene-specific forward primer (5′-CAGATGCAGCTGGCTTTTGCAG-3′– common to all NR1 splice variants) (Primer 1). The double-stranded cDNAs were then amplified using Pfu DNA polymerase (Stratagene, La Jolla, CA, USA) and an adaptor primer and NR1 gene-specific forward primer (Primer 1). Following confirmation of amplification of the NR1 3′-UTR by hybridization with [32P]-NR1 gene-specific primer (Primer 2) (5′-GCAGGTTCTTCCTCCACACG-3′), 3′ RACE products were subcloned into pBluescript vector (pKS+) (Stratagene). Colony hybridization was performed using [32P]-labeled Primer 2 to select NR1 gene-specific clones. Several positive clones were selected and both strands of the double-stranded plasmid DNA were sequenced in a thermal cycler using SequiTherm Excel II DNA sequencing kit (Epicentre Biotechnologies, Madison, WI, USA) and [33P]-end labeled primers. The end-labeling of all primers was achieved by incubation with T4 polynucleotide kinase in the presence of [32P]-γ-ATP or [33P]-γ-ATP as described (Kumari, 2001). To sequence the entire 3′-UTR, two approaches were employed: (1) sequenced full-length clones using T3 and T7 universal primers (Stratagene) and internal gene-specific primers, and (2) full-length clones were digested with specific restriction enzymes, ligated and amplified to generate plasmid DNAs for DNA sequencing. Selection of enzymes for restriction digestion was based upon sequence information obtained by sequencing the 3′-UTR of the NR1 subunit (approach 1). All truncated clones of NR1 3′-UTR were sequenced using T3 and T7 universal primers. DNA sequences of 3′ RACE clones were analysed by BLAST (Altschul et al., 1990).
Construction of NR1 3′-UTR deletion mutants
Deletion mutants of NR1 3′-UTR were generated by digesting the full-length 3′-UTR clone of NR1–3/NR1–4 variants with selective restriction enzymes that digest once in the multiple cloning site of pKS+ and once or twice in the NR1 3′-UTR. Digested plasmids were gel purified and re-ligated. Non-compatible termini were made blunt end before ligation. Once the DNA sequence of the truncated inserts was confirmed by DNA sequencing using T3 and T7 universal primers, large amounts of plasmid DNAs were generated by maxiprep using the Wizard plus Maxiprep DNA purification system (Promega, Madison WI, USA).
In vitro transcription
Plasmids were linearized using appropriate restriction enzymes and linearized plasmids were gel purified. Linear plasmids were transcribed in the presence of [32P]-α-CTP (specific activity: 3000 Ci/mmol; Perkin Elmer Life and Analytical Sciences, Boston, MA, USA) using T3 RNA polymerase to generate radiolabeled sense RNA. The in vitro transcribed radiolabeled sense RNAs were purified using Sephadex G25 or G50 columns (Roche Diagnostics Corp., Indianapolis, IN, USA) depending upon the RNA size and were routinely examined, by electrophoresis on a non-denaturing polyacrylamide gel, for the presence of a single RNA band of the correct size. Purified radiolabeled sense RNAs were used as probes for RNA gel mobility shift assays, UV cross-link and Northwestern analyses, and RNA gel mobility supershift assays. Sense RNAs were also transcribed in the absence of [32P]-α-CTP to generate unlabeled (cold) RNAs. Unlabeled RNAs were purified using Sephadex G25 or G50 columns and employed in competitive RNA gel mobility shift assays and competition Northwestern analysis.
RNA gel mobility shift assay
These assays were performed according to the method described by Leibold & Munro (1988) with some modifications. Briefly, polysomes (5 µg) from control and ethanol-treated FCN were incubated with a known amount of [32P]-labeled RNA in RNA binding buffer (10 mm HEPES, 50 mm KCl, 5 mm MgCl2, 10% glycerol, yeast tRNA 200 ng/µL) at 30 °C for 30 min in a total volume of 15 µL. At the end of incubation, RNA–protein complexes were resolved on either 2% agarose gel or a 5% polyacrylamide gel (acrylamide–methylene bisacrylamide, 60 : 1) containing 2% glycerol in Tris-borate buffer. The polyacrylamide gels were dried and exposed to film and/or PhosphorImager screen. When samples were separated on agarose gels, gels were blotted onto Gene screen plus membrane and membrane was exposed to film (Kodak X Omat) for autoradiography.
For competition experiments, molar excess of cold specific or non-specific RNA was incubated with polysomes at 30 °C for 15 min before the addition of the radiolabeled probe RNA. RNA–protein complexes were resolved on a 5% polyacrylamide gel as above. Gels were dried and exposed to film.
For quantification of Δ4 RNA–protein complex in RNA gel shift assay, dried gels were exposed to a PhosphorImager screen and analysed on a PhosphorImager Storm 840 (Amersham-Pharmacia Biotech, Piscataway, NJ, USA). The signal intensity of shifted Δ4 RNA, i.e. RNA–protein complex in control and ethanol-treated FCN, was quantified using ImageQuant v.5.2. Statistical analysis was performed using anova and Fisher's least significant difference test.
UV cross-link analysis
The number of proteins that interact with cis-acting sequences in the 3′-UTR of NR1 mRNA was determined by UV cross-linking of protein(s) as described (McGowan et al., 1997). Briefly, polysomes (5 µg) from ethanol-treated FCN were incubated with a known amount of [32P]-labeled Δ4 RNA as described for RNA gel mobility shift assays. At the end of incubation, samples were placed on ice and exposed to a 254-nm UV light (UV Stratalinker 1800, Stratagene) at a distance of 5 cm for 10 min. After UV irradiation, samples were digested with RNase A3 (15 U/µL; Worthington Biochemical Corp., Lakewood, NJ, USA) and RNase T1 (20 U/µL; Sigma Aldrich, St. Louis, MO, USA) for 30 min at 30 °C. The reaction was stopped by the addition of 5× gel loading dye containing SDS and β-mercaptoethanol. Samples were heated for 3 min at 95 °C and subjected to electrophoresis on 7.5% SDS-polyacrylamide gels with prestained broad-range protein molecular weight markers (New England Biolabs, Beverly, MA, USA). Following electrophoresis, gels were dried and exposed to film for autoradiography.
Northwestern analysis
Polysomes (10 µg) were separated on 7.5% SDS-PAGE. Following electrophoresis, proteins were allowed to refold in TNED buffer (10 mm Tris/HCl, pH 7.5, 50 mm sodium chloride, 0.1 mm EDTA, 1 mm dithiothreitol) and subsequently electroblotted on to nitrocellulose at 80 V for 1 h (Zehner et al., 1997). The membrane was prehybridized overnight at room temperature in 5% (w/v) non-fat dry milk prepared in TNED buffer and then hybridized with [32P]-labeled RNA for 4 h. Following hybridization, unbound RNA was removed by washing in TNED buffer and the membrane was exposed to film for autoradiography.
Determination of the molecular weight of trans-acting proteins
For Northwestern analysis, samples were separated on polyacrylamide gel with prestained broad-range protein molecular weight markers (New England Biolabs). The relative mobilities (Rm) of all trans-acting protein bands as well as the prestained broad-range protein molecular weight marker proteins were calculated by dividing the total distance migrated by the protein of interest by the distance migrated by the bromophenol blue dye. A plot of log molecular weight vs. relative mobility was prepared for the protein standards. The molecular weights of the trans-acting proteins were estimated by comparing their Rm value with protein standards in the calibration curve. This analysis was repeated each time samples were separated on polyacrylamide gels for Northwestern analysis.
Purification of NR1 RNA binding proteins
NR1 3′-UTR binding proteins were purified by (1) affinity purification using full-length NR1 3′-UTR annealed to oligo(dT) as a ligand and (2) elution from the shifted RNA in a preparative RNA gel mobility shift assay. The method for ligand-based purification is based on the mRNA purification method using the PolyATtract automated system (Promega). In vitro transcription of linear plasmid containing full-length NR1 3′-UTR with poly(A) tail was performed in the presence of 5 µCi [32P]-α-CTP. Only full-length RNAs spanning NR1 3′-UTR were employed for annealing to biotinylated oligo(dT). The 3′-UTR annealed to biotinylated oligo(dT) was captured by streptavidin-conjugated paramagnetic beads (SA-PMPs) and this complex was used as a ligand. Polysomes from ethanol-exposed FCN were incubated with ligand and unbound proteins were removed by magnetizing the ligand. Following washing the ligand–protein complexes, UTR-bound proteins were eluted using a buffer containing 0.5 m NaCl. Salt was removed from the eluted RNA binding proteins by centrifugation through a Microcon YM-3 centrifugal filter (Millipore, Billerica, MA, USA). Centrifugation through the YM-3 filter also allowed concentration of protein samples. The concentrated samples were diluted with 62.5 mm Tris/HCl buffer (pH 6.8). To the eluted proteins, SDS to 2% and β-mercaptoethanol to 5% was added. Samples were denatured by heating at 95 °C for 3 min and subjected to SDS-PAGE on 8% gel (see below).
Mass spectroscopy and bioinformatics analysis
Samples containing purified NR1 RNA binding trans-acting proteins were separated on 8% SDS-polyacrylamide gel and stained with the SilverQuest silver staining kit (Invitrogen) according to the instructions of the supplier. The 88-kDa protein band was excised from the silver-stained gel and sent to the Harvard Microchemistry Facility for protein identification. After in-gel digestion with trypsin, multiple peptide sequences were determined in a single run by microcapillary reversed-phase HPLC nano-electrospray tandem mass spectrometry (µLC/MS/MS) on a Finnigan LCQ DECA XP Plus quadruple ion trap mass spectrometer. MS/MS spectra were correlated with known protein sequences using the algorithm Sequest (Eng et al., 1994) and the program ‘FuzzyIons’ (Chittum et al., 1998) and the results were manually confirmed for fidelity.
RNA gel mobility supershift analysis
Binding reactions were performed as for RNA gel mobility shift assays. Following incubation of polysomal proteins with [32P]-Δ4 RNA probe, varying concentrations of GIIβ antibody (a kind gift from Dr Hanne Ostergaard, Department of Medical Microbiology & Immunology, University of Alberta, Edmonton, Alberta, Canada) or normal rabbit serum were added and reaction mixes were incubated for an additional 20 min at room temperature. At the end of the incubation, RNA–protein complexes were resolved on 5% polyacrylamide gel. Gels were dried and exposed to a PhosphorImager screen and analysed on PhosphorImager Storm 840.
Immunoprecipitation and RT-PCR (immuno RT-PCR)
This was performed according to the method described by Adams et al. (2003) for renin mRNA with some modifications. Immunoprecipitation using antibody to NR1 UTR binding protein, GIIβ, was performed as described (Baldwin et al., 2000). Briefly, polysomes (100 µg) from ethanol-exposed FCN were suspended in 10 mm Tris/HCl buffer (pH 7.6) containing 0.5% Nonidet P-40 (Sigma-Aldrich), 150 mm NaCl and incubated for 20 min on ice. After addition of 20 µL GIIβ antibody to polysomes, samples were incubated for 20 min on ice and then gently mixed for 2 h after mixing with protein A-Sepharose beads (Roche Molecular Biochemicals). After centrifugation of the incubation mixtures at 2000 g for 2 min, the supernatants containing unbound proteins were removed. The pellet was washed five times and RNA was extracted using Trizol reagent (Invitrogen). RNA was rendered genomic DNA-free by incubation with RQ1 RNase-free DNase I and processed for RT-PCR using NR1 gene-specific forward (5′-CAGATGCAGCTGGCTTTTGCAG-3′) and reverse (5′-TGATATCACGGGCCCGCTCAA-3′) primers spanning exons 21 and 22 as described elsewhere (Kumari, 2001) with the exception that PCR amplification (step 1, 3 min at 95 °C for one cycle; step 2, 30 s at 95 °C, 1 min at 68 °C for 30 cycles; step 3, 7 min at 72 °C for one cycle; step 4, soak at 4 °C) was repeated twice and AmpliTaq polymerase was used instead of AmpliTaqGold polymerase. In vitro transcribed sense RNA of mouse NR1–3a splice variant (+E21/–E22) was included as a positive control for the RT-PCR reaction. RT-PCR products separated on 2% agarose gel were visualized by staining with ethidium bromide. The negative control for immuno RT-PCR consisted of polysomes that were processed exactly as above except for the addition of buffer instead of GIIβ antibody.
Western blot analysis
This was performed using methods described elsewhere (Kumari, 2001). Briefly, a known amount of polysomal protein from control and ethanol-treated (50 mm, 5 days) FCN and the protein standards were separated on 7.5% SDS-PAGE. Following electrophoretic transfer of proteins onto Hybond polyvinylidene difluoride membrane (Amersham-Pharmacia Biotech), membranes were incubated overnight at 4 °C with one of the following primary antibodies: GIIβ or actin antibodies (Sigma-Aldrich). Following incubation with appropriate horseradish peroxidase-conjugated secondary antibody, immunoreactive bands were visualized on PhosphorImager Storm 840 using the ECL plus detection system.
Western blot analysis was also performed using nitrocellulose membranes from Northwestern analysis. Following detection of radiolabeled bands, membranes were blocked in 5% non-fat dry milk (w/v) and processed to detect actin polypeptide levels using anti-actin as above.
Statistical analysis
The autoradiographic images for Northwestern analysis were digitized using a Kodak EDAS system and intensities of radiolabeled bands were analysed using Kodak Digital Science 1D software. The digitized data were also independently analysed using ImageQuantTL software (Amersham-Pharmacia Biotech). Images scanned on the PhosphorImager Storm 840 were analysed using ImageQuantTL software. Statistical analysis was performed using anova and Fisher's least significant difference test.
Results
Amplification and sequence analysis of NR1 3′-UTR
Our aim was to detect the presence and location of cis-acting sequences within the primary structure of the 3′-UTR of mouse NR1 mRNA and trans-acting proteins that may be expressed in cultured mouse FCN. As the sequence of 3′-UTR of mouse NR1-3/NR1-4 splice variants that are expressed in cultured FCN was not known when initiating the present study, we first performed 3′ RACE using poly(A)+ RNA to isolate 3′ ends of NR1 splice variants expressed in cultured FCN. Subsequent cloning of the amplified 3′ ends of NR1 variants into pKS(+) and DNA sequencing of the subcloned 3′ ends revealed that the NR1 3′-UTR is 879 nt long (Fig. 1) (Kumari & Anji, 2001). Sequence alignment using BLAST indicated that 879 nt of mouse NR1 3′-UTR is analogous to rat NR1-3 and NR1-4 splice variants rather than NR1-1 and NR1-2 (Hollmann et al., 1993). These data confirmed our previous RT-PCR results that demonstrated the expression of NR1-3 and NR1-4 splice variants in cultured FCN (Kumari, 2001). Alignment of mouse 3′-UTR of the NR1-3 splice variant (present study) with 3′-UTR of rat NR1-3 variant (U08265.1) and human NR1-3 variant (NM_007327.1) using Clustal W (1.82) multiple sequence alignment (Thompson et al., 1994) revealed 85% similarity between the mouse and rat sequence and 75% similarity between the mouse and human sequence.
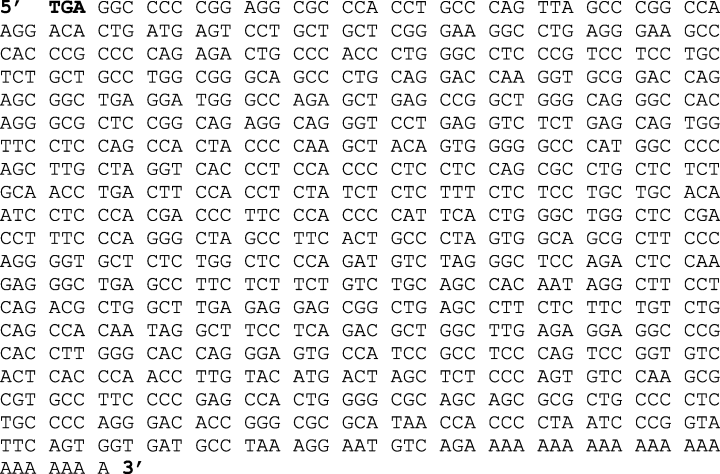
Complete sequence of the mouse NR1-3/NR1-4 3′-UTR. (accession number: AY616022). The size of 3′-UTR of NR1-3 and NR1-4 splice variants is 879 nt excluding a poly(A) tail of 22 nt. The bold TGA represents the new stop codon in NR1-3 and NR1-4 splice variants.
Localization of a cis-acting region within the NR1 3′-UTR
To identify cis-acting region(s) within 879 nt of 3′-UTR of NR1 mRNA, the plasmid pKSNR13UTR containing the complete NR1-3/NR1-4 3′-UTR sequence was linearized (Fig. 2A). The linear plasmid was gel purified and transcribed in vitro to generate [32P]-labeled sense UTR RNA. The presence of cis-acting region(s) within the NR1 3′-UTR was examined by RNA gel mobility shift assay using polysomes from both control and ethanol-treated FCN. Analysis of the results showed a shift of the [32P]-labeled 3′-UTR RNA (Fig. 3A), suggesting the presence of cis-acting region(s) in the NR1-3/NR1-4 3′-UTR and expression of trans-acting factors in control and ethanol-treated FCN. Inclusion of tRNA in the RNA gel shift incubation mix did not interfere with RNA–protein complex formation. To define the cis-acting region(s) within 879 nt, a series of overlapping truncated fragments were generated by digesting the plasmid, pKSNR13UTR, with specific restriction enzymes (Fig. 2B). The [32P]-labeled sense RNAs of all truncated UTR clones generated by in vitro transcription of the linear plasmids were purified and employed as probes in RNA gel mobility shift assays to assess their ability to bind trans-acting factors. Polysomes from control and ethanol-treated FCN were used as the source of trans-acting factors. Sense RNAs spanning truncated regions Δ1, Δ2 and Δ3 gave a positive shift of the respective RNA (Fig. 3B), suggesting that all these fragments contained a cis-acting region. As the RNA sequence between 301 and 456 nt is common to all three truncated fragments, i.e. Δ1, Δ2 and Δ3 (Fig. 2B), we subcloned nucleotides spanning 301–456 into pKS+ (Δ4) to define further the cis-acting region by RNA gel shift assay. We also subcloned nucleotides spanning 241 and 301 into pKS+ (Δ5). The Δ4 RNA gave a positive shift whereas Δ5 did not produce a shift (Fig. 3B), confirming the presence and location of a cis-acting region within 301 and 456 nt of the NR1 3′-UTR. Interestingly, an increase in the intensity of shifted RNA was observed in polysomes from ethanol-treated cortical neurons as compared with control polysomes (Fig. 3B). Quantitative analysis of the shifted [32P]-labeled Δ4 RNA (i.e. RNA–protein complex) using ImageQuant v.5.2 software showed a ∼78% increase (above control levels) in the intensity of the shifted Δ4 RNA in polysomes from ethanol-treated FCN (Fig. 3C).
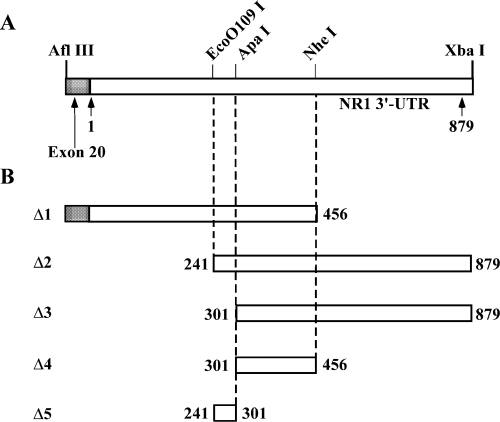
Map of NR1-4 3′-UTR. (A) Schematic representation of the NR1-4 3′-UTR showing restriction sites that were used to generate truncated mutants. (B) Map of truncated NR1 3′-UTR fragments used for the generation of sense RNA probes for RNA gel mobility shift assays.
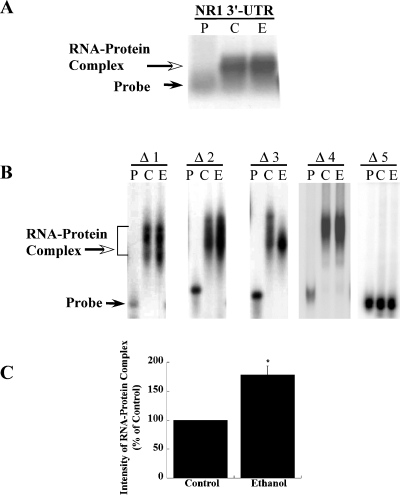
RNA gel mobility shift analysis of NR1-4 3′-UTR and truncated UTR fragments using polysomes from control and ethanol-treated FCN: the [32P]-labeled RNA spanning the full length NR1 3′-UTR or NR1 3′-UTR truncated fragments shown in Fig. 2 were incubated in the absence of polysomes (lane P) or with polysomes from FCN cultured for 5 days in the absence (lane C) or presence of 50 mm ethanol (lane E). RNA–protein complexes were separated on different gels depending upon the size of the [32P]-labeled RNA probe. (A) RNA–protein complexes were separated from free RNA on agarose gel, blotted and exposed to film. A positive shift of RNA probe (open arrow) suggested the presence of cis-acting region(s) in 3′-UTR of NR1 mRNA and the presence of trans-acting factors in the polysomes. Solid arrow points to free RNA probe. (B) RNA–protein complexes were separated on polyacrylamide gels. RNA–protein complex formation was observed with all truncated RNA probes (Δ1–Δ4) except Δ5 RNA probe. Solid arrow points to free probe. (C) The signal intensities of RNA–protein complex obtained using Δ4 RNA probe and polysomes from control and ethanol-treated FCN were quantified using ImageQuant v.5.2. as described in the Materials and methods. Data are expressed as percentage of control and plotted values represent the mean ± SEM of three independent experiments. A significant increase in the intensity of the shifted Δ4 RNA band was observed in ethanol-treated polysomes as compared with untreated controls. Statistical analysis was performed by anova and Fisher's least significant difference test, *P < 0.01.
Characterization of RNA–protein interaction
We next confirmed that the observed shift of [32P]-labeled RNA (Fig. 3) was due to interaction of NR1 UTR RNA with protein(s) in the polysomes. Polysomes from control and ethanol-treated FCN were predigested with proteinase K or heat denatured prior to incubating with [32P]-labeled Δ4 RNA in RNA gel shift assays. Incubation of polysomes at 65 °C for 30 min denatures proteins but does not affect the ribonucleases. The Δ4 RNA shift that is normally seen by incubation with polysomes (Fig. 4A, lanes 2 and 3) was abolished following digestion of polysomes with proteinase K (Fig. 4A, lanes 4 and 5) and heat denaturation of polysomes (Fig. 4A, lanes 6 and 7), suggesting that the trans-acting factor(s) binding to Δ4 RNA are proteins in nature.
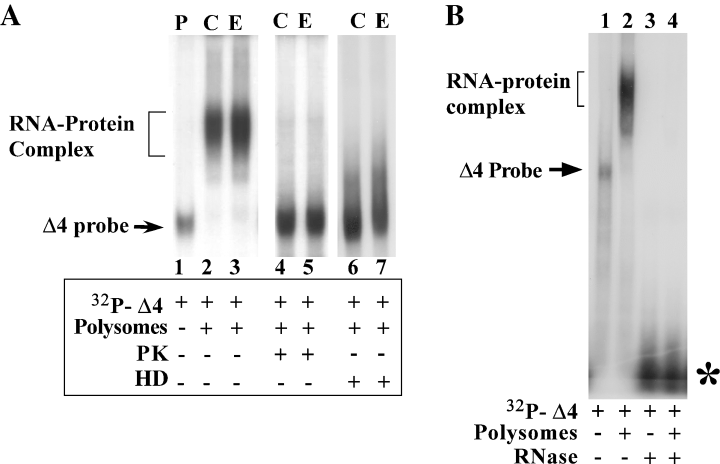
Characterization of RNA–protein interaction. (A) Effect of proteinase K treatment and heat denaturation on RNA–protein complex formation. Pre-treatment of polysomes from control (lane C) and ethanol-treated FCN (lane E) with proteinase K (PK, lanes 4 and 5) or heat denaturation (HD, lanes 6 and 7) abolished the RNA protein complex formation as compared with untreated polysomes (lanes 2 and 3), suggesting the protein nature of the trans-acting factor(s) present in the polysomes. Solid arrow points to free probe. Presence (+) or absence (–) of polysomes and protein inactivation treatment is indicated below the autoradiogram. (B) Effect of ribonucleases on RNA–protein complex formation. Polysomes from ethanol-treated FCN were incubated with [32P]-labeled Δ4 RNA probe that was either incubated with ribonucleases or with buffer only. Pretreatment of Δ4 RNA probe with RNases resulted in lack of a RNA–protein complex (lane 4) unlike Δ4 RNA probe that was incubated with buffer only (lane 2). Autoradiogram in the present figure shows that in vitro transcription of linear Δ4 plasmid results in the synthesis of a single RNA band as this autoradiogram depicts the full-length image of the gel. The solid arrow on the left points to free Δ4 RNA probe, and the asterisk on the right indicates the RNase-digested Δ4 RNA probe. Presence (+) or absence (–) of polysomes and RNase treatment is indicated below the autoradiogram.
To confirm that RNA is interacting with trans-acting proteins to produce a shift, we pretreated the [32P]-labeled Δ4 RNA with a mixture of RNase A3 and T1 for 15 min at 37 °C prior to incubation with polysomes in RNA gel shift assays. Digestion of Δ4 RNA with RNases abolished the formation of RNA–protein complex (Fig. 4B). Taken together, the data in Fig. 4 demonstrate that the shift of Δ4 RNA in RNA gel mobility shift assays occurred as a result of interaction between cis-acting RNA sequences and trans-acting protein(s) present in the polysomes.
Specificity of RNA–protein interaction
To address the specificity of the RNA–protein complex formation we first examined whether the 8–24 nt of pKS(+) vector sequence present as part of the in vitro transcribed NR1 3′-UTR RNAs contribute to the formation of RNA–protein complex. Radiolabeled Δ4 RNA and [32P]-24 nt pKS(+) vector RNA were independently incubated with polysomes from control and ethanol-treated FCN and the resulting incubation mixtures were separated on polyacrylamide gel. The gel was dried and exposed to film. As shown previously, a positive shift was obtained when [32P]-labeled Δ4 RNA was used as a probe (Fig. 5A, lanes 2 and 3). However, no shift was observed using 24-nt-long vector RNA (Fig. 5A, lanes 5 and 6), suggesting that the formation of RNA–protein complexes is specific for cis-acting sequences present in the NR1 3′-UTR.
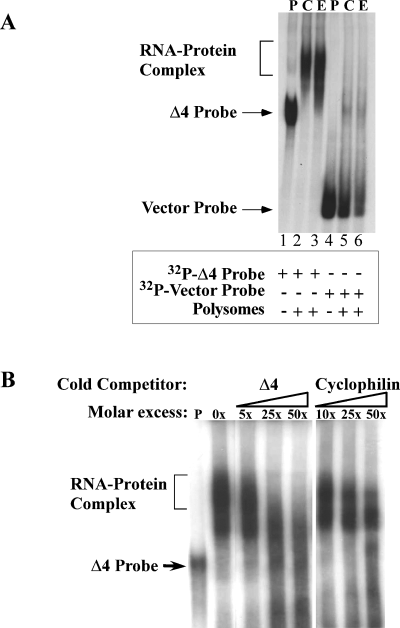
Specificity of RNA–protein interaction. (A) RNA gel mobility shift analysis of [32P]-labeled vector sequences. [32P]-labeled Δ4 RNA (lanes 1–3) and [32P]-labeled vector RNA (24 nt long) (lanes 4–6) were incubated in the absence of polysomes (lanes P) or in the presence of polysomes from control (lanes C) or ethanol-treated FCN (lanes E). Binding reaction and analysis of RNA protein complexes was performed as detailed in the Materials and methods. RNA–protein complex formation was seen only with [32P]-labeled Δ4 RNA (lanes 2 and 3) and not with vector RNA (lanes 5 and 6). Solid arrows on the left indicate the position of the appropriate [32P]-labeled probe. Addition of respective probes and polysomes to the incubation mixtures are indicated below the autoradiogram by the + symbol. (B) Competition analysis using unlabeled Δ4 and cyclophilin RNAs. Pre-incubation of polysomes from ethanol-treated FCN with increasing concentrations of specific unlabeled competitor RNA (Δ4) interfered with [32P]-labeled Δ4 RNA–protein complex formation while non-specific unlabeled cyclophilin RNA at similar concentrations had no effect on RNA–protein complex formation. Concentration of competitor in the reaction mix is shown above the autoradiogram. Location of free [32P]-labeled Δ4 RNA is indicated by a solid arrow on the left.
To define further the specificity of the RNA–protein complex formation, we tested the ability of unlabeled (cold) specific competitor RNA to compete for binding to trans-acting protein(s). Polysomes from ethanol-exposed cortical neurons (50 mm, 5 days) were pre-incubated with increasing molar concentrations of unlabeled Δ4 sense RNA prior to incubation with [32P]-labeled Δ4 RNA in RNA gel mobility shift assays. Addition of molar excess of unlabeled specific Δ4 RNA competed with [32P]-labeled Δ4 RNA, eliminating completely the [32P]-labeled Δ4 RNA–protein interactions (Fig. 5B). By contrast, competition with the same molar concentration of unlabeled non-specific cyclophilin RNA had no effect on [32P]-labeled Δ4 RNA–protein complex formation (Fig. 5B). These results confirmed the specificity of the binding of cis-acting sequences of NR1 RNA to trans-acting proteins expressed in fetal cortical neurons.
Effect of ionic strength on NR1 mRNA–protein complex formation
When RNA–protein complex formation was performed in the presence of increasing salt concentration, dissociation of RNA–protein complex occurred only at high salt concentration (500 mm), suggesting that the RNA–protein interaction is relatively stable (Fig. 6).
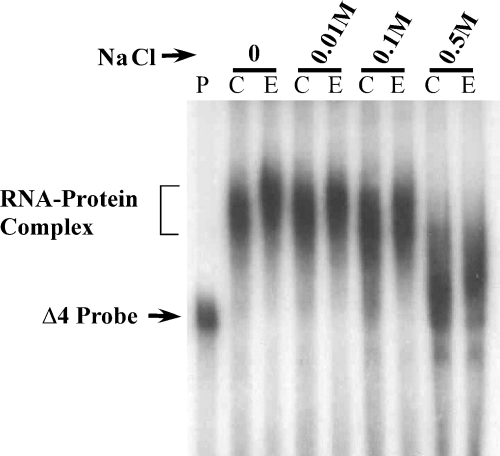
Effect of ionic strength on Δ4 RNA–protein complex integrity. The [32P]-labeled Δ4 RNA probe was incubated alone (lane P) or with polysomes from control (lane C) and chronic ethanol treated (lane E) FCN in the presence of increasing concentrations of NaCl. Inhibition of RNA–protein complex formation was observed only when concentration of salt increased to 0.5 m NaCl. Free Δ4 RNA probe is indicated by the arrow on the left.
UV cross-link analysis
The number of trans-acting protein(s) binding to [32P]-labeled Δ4 RNA was determined by UV cross-linking. Polysomes from ethanol-treated FCN were incubated with [32P]-labeled Δ4 RNA and the incubation mixtures were exposed to UV light to link covalently Δ4 RNA to trans-acting protein(s). The non-crosslinked Δ4 RNA was removed by digestion with ribonucleases and the remaining RNA–protein complexes were subjected to SDS-PAGE. Analysis of autoradiography data identified three radiolabeled bands (Fig. 7), suggesting covalent binding of [32P]-labeled Δ4 RNA with three trans-acting proteins.
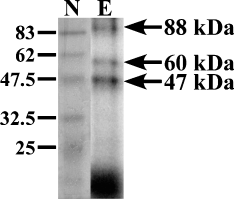
Analysis of RNA–protein interaction by UV cross-linking. Incubation of [32P]-labeled Δ4 RNA with polysomes from ethanol-treated FCN and subsequent exposure of RNA–protein complexes to UV light covalently linked trans-acting proteins to Δ4 RNA. Digestion of unbound Δ4 RNA from the UV cross-linked incubation mix and analysis by SDS-PAGE and exposure of gel to film identified three trans-acting proteins (arrows on the right). Because it is difficult to assess the size of the RNA fragment covalently bound to proteins the molecular mass of three trans-acting proteins was calculated by Northwestern analysis. The size of prestained broad-range protein molecular weight marker proteins (lane N) that were separated with samples is shown on the left in kilodaltons.
Northwestern analysis
To determine the nature of the three RNA-binding proteins detected by UV cross-link analysis, we performed Northwestern analysis. A known amount of polysomal proteins from control and ethanol-treated FCN was separated on SDS-PAGE. Separated proteins were allowed to re-fold prior to blotting onto nitrocellulose membrane. Proteins blotted onto nitrocellulose membrane were probed with [32P]-labeled Δ4 RNA as detailed above. Upon exposure of nitrocellulose membrane to film for 16 h, a single band with an apparent molecular mass of ∼ 88 kDa was detected (Fig. 8A). Two additional protein bands with apparent molecular masses of ∼ 60 and 47 kDa, respectively, were detected when nitrocellulose membrane was exposed to film for 36 h (Fig. 8B). The Northwestern data are in agreement with results from UV cross-link analysis. The intensity of the 88-kDa band was markedly enhanced in ethanol-treated polysomes (Fig. 8A). Quantitative analysis of the 88-kDa protein band in Northwestern blots demonstrated that the 88-kDa trans-acting protein was up-regulated (80% above control levels) in FCN following chronic ethanol treatment (Fig. 8C). To confirm that the observed increase of the 88-kDa trans-acting protein is not due to an overall ethanol-induced increase in protein synthesis and/or unequal loading of samples, nitrocellulose membranes from Northwestern analysis were processed for detection of actin polypeptide levels using antibody to actin. Immunoreactive actin protein bands were visualized on the PhosphorImager Storm 840 using ECL plus detection system. It is known that chronic ethanol exposure in vivo or in vitro has no effect on actin polypeptide levels (Montpied et al., 1991; Katsura et al., 1995). Quantification of immunoreactive actin bands in control and ethanol-treated samples (Fig. 8D) indicated the presence of actin bands of equal intensity in both samples (Fig. 8E), thus validating the observed ethanol-mediated up-regulation of the 88-kDa trans-acting protein levels in FCN (Fig. 8A and C).
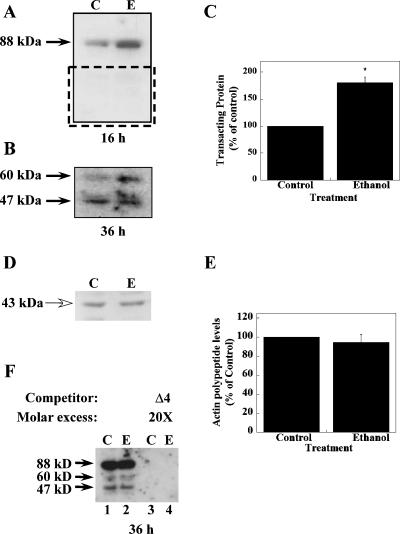
Detection of NR1 3′-UTR binding trans-acting proteins by Northwestern analysis using Δ4 RNA probe. (A) Polysomal proteins from control (lane C) and ethanol-treated (lane E) FCN separated on SDS-PAGE and blotted on to nitrocellulose membrane were allowed to interact with [32P]-labeled Δ4 RNA. Binding of Δ4 RNA to a trans-acting protein with a molecular mass of ∼ 88 kDa was detected upon short exposure (arrow on the left). The intensity of the 88-kDa band was enhanced in polysomes from chronic ethanol-exposed FCN as compared with untreated controls. (B) Upon longer exposure of nitrocellulose membranes (above), two additional trans-acting proteins with an approximate molecular mass of 60 and 47 kDa, respectively, were detected (arrows on the left). Only area shown by dotted rectangle in A is shown here. (C) Autoradiographic image of the 88-kDa protein–RNA complex from three different experiments utilizing polysomes prepared from three independent FCN cultures were digitized using Kodak DC 120 digital camera and analysed using Kodak Digital Science 1D software. Data are expressed as percentage of control and plotted values represent the mean ± SEM of three independent experiments. A significant increase in intensity of the 88-kDa protein–RNA complex in ethanol-treated polysomes was observed. Statistical analysis was performed by anova and Fisher's least significant difference test (*P < 0.005). (D) Northwestern blots from three independent experiments were re-probed with antibody to actin. A representative blot is shown here. The size of the immunoreactive actin band is indicated on the left by an open arrow. (E) Autoradiographic image of immunoreactive actin band from all three experiments was analysed as in C. Data are expressed as a percentage of control and plotted values represent the mean ± SEM of three independent experiments. No change in actin polypeptide levels was observed in ethanol-treated polysomes as compared with control polysomes. Statistical analysis was performed by anova. (F) Competition Northwestern analysis was performed exactly as in A except that membranes were probed with [32P]-labeled Δ4 RNA either in the absence of unlabeled Δ4 RNA or in the presence of 20× molar excess of unlabeled Δ4 RNA-specific competitor. Three trans-acting proteins were detected when membranes were probed with [32P]-labeled Δ4 RNA in the absence of unlabeled Δ4 RNA (lanes 1 and 2). However, addition of unlabeled Δ4 RNA during hybridization inhibited binding of [32P]-labeled Δ4 RNA to trans-acting proteins (lanes 3 and 4). The size of RNA–protein complexes is indicated by arrows on the left. Lanes C: control polysomes; lanes E: ethanol-treated polysomes.
We next confirmed the specificity of the Northwestern data by competition Northwestern analysis. Polysomal proteins were subjected to SDS-PAGE and blotting as above, and membranes were incubated with [32P]-labeled Δ4 RNA in the presence of a 20-fold molar excess of unlabeled Δ4 RNA. Exposure of washed membranes to film for 30 h did not allow detection of any one of the three trans-acting proteins (Fig. 8F, lanes 3 and 4) that were detected in the absence of specific competitor (Fig. 8F, lanes 1 and 2). Competition with a non-specific competitor, cyclophilin RNA, had no effect on binding of [32P]-labeled Δ4 RNA to trans-acting proteins (data not shown). Taken together, the present data confirm the specificity of the NR1 UTR RNA–trans-acting protein interactions.
Protein purification and mass spectroscopy
The NR1 3′-UTR binding proteins were purified using an affinity purification method. The full-length NR1 3′-UTR with its poly(A) tail annealed to biotinylated oligo(dT) was captured by SA-PMPs and this complex was used as a ligand for purification of NR1 binding proteins. Incubation of polysomes with the ligand resulted in binding of trans-acting proteins to NR1 3′-UTR RNA. Bound trans-acting proteins were eluted using a buffer containing 0.5 m NaCl as this concentration of salt did not allow binding of Δ4 RNA to trans-acting proteins (Fig. 6). After removal of salt, eluted proteins were processed for separation by electrophoresis on 8% SDS-PAGE and separated proteins were visualized by silver staining. As a control, polysomes were incubated with SA-PMPs and bound proteins were eluted as above. No proteins that bind to SA-PMPs alone were detected (data not shown). The ∼ 88-kDa protein band was excised and processed for in-gel trypsin digestion. Tryptic fragments were analysed by µLC/MS/MS. Correlation of MS/MS spectra with known proteins identified six peptides as part of a protein termed the beta subunit of alpha glucosidase II (GIIβ). The amino acid sequence of these six peptides matched 100% to GIIβ(Fig. 9).
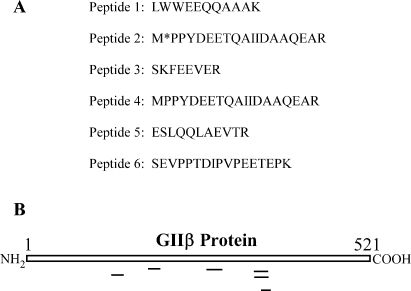
MS/MS analysis of tryptic fragments of the 88-kDa protein. The 88-kDa protein band excised from the gel was processed for in-gel trypsin digestion. Tryptic fragments were analysed by µLC/MS/MS and MS/MS spectra were correlated with known proteins using two different programs. (A) Of several peptides, the amino acid sequence of six peptides matched 100% to the beta subunit of the alpha glucosidase II (GIIβ) (gi|14602601). (B) Diagrammatic representation of the GIIβ polypeptide. Location of tryptic peptide fragments that matched with GIIβ are shown below the GIIβ polypeptide.
Confirmation of interaction between Δ4 RNA and GIIβ
To verify the mass spectrometric results, we performed RNA gel mobility supershift analysis using polysomes from control and ethanol-treated FCN and Δ4 RNA probe. Addition of GIIβ antibody to the incubation mix containing polysomes from control or ethanol-treated FCN produced a supershift of the Δ4 RNA–protein complex (Fig. 10A; control FCN data not shown). The intensity of the supershift of the Δ4 RNA–protein complex increased with increasing concentrations of GIIβ antibody (Fig. 10A, lanes 3–6, open arrow). A corresponding decrease in the intensity of the Δ4 RNA–protein complex was observed (Fig. 10A, lanes 3–6). By contrast, addition of normal rabbit serum did not produce a similar supershift of the Δ4 RNA–protein complex (Fig. 10A, lanes 7–9). As a control, RNA gel mobility supershift assays were also performed independently using antibodies to two RNA binding proteins, YB-1 and HuD, and two other proteins, NR1 subunit and actin. All these proteins, except YB-1, are present in polysomes. None of these four antibodies produced a supershift (data not shown), demonstrating the specificity of the supershift of Δ4 RNA–protein complex seen with the GIIβ antibody.
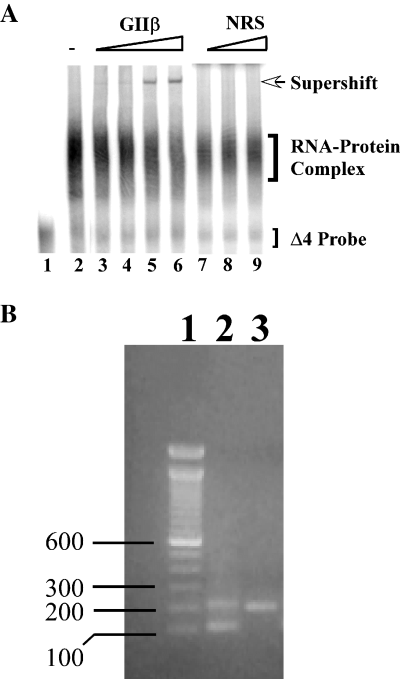
Confirmation that GIIβ is a NR1 UTR binding trans-acting protein. (A) RNA supershift analysis using antibody to GIIβ: polysomes from ethanol-treated FCN were first incubated with [32P]-labeled Δ4 RNA and then with either increasing concentrations of GIIβ antibody (lane 3: 0.04 µL; lane 4: 0.0625 µL; lane 5: 0.125 µL; and lane 6: 0.25 µL) or normal rabbit serum (NRS) (lane 7: 0.0625 µL; lane 8: 0.125 µL; and lane 9: 0.25 µL). Samples were processed for analysis as in RNA gel shift assays using PhosphorImager Storm 840. A supershift (open arrow on the right) was detected in samples incubated with GIIβ antibody (lanes 3–6) but not with NRS (lanes 7–9). Location of free probe as well as RNA–protein complex is indicated on the right. (B) Immuno RT–PCR: association of GIIβ with NR1 mRNA in cultured FCN was examined by immuno RT-PCR using PCR primers spanning exons 21 and 22 of NR1 mRNA. Solubilized polysomal proteins from ethanol-exposed FCN were incubated with GIIβ antibody and the immune complexes were precipitated using protein A-Sepharose beads. NR1 mRNAs that co-immunoprecipitated with GIIβ were purified and utilized as template for RT-PCR. Amplification products and 100 bp DNA ladder (lane 1) separated on agarose gel were visualized by ethidium bromide staining. The 198-bp and 87-bp DNA bands in lane 2 reveal the presence of NR1-3 (+E21/–E22) and NR1-4 (–E21/–E22) splice variants, respectively, in the immune complexes. Lane 3 shows the 198-bp DNA band amplified by RT-PCR using in vitro transcribed sense NR1-3a RNA (a positive control for RT-PCR, +E21/–E22).
To determine whether NR1 RNA indeed interacts with GIIβ protein in intact cells, immunoprecipitation RT-PCR was performed using polysomes from ethanol-treated FCN. Polysomes were treated with a detergent to disrupt rough endoplasmic reticulum membranes and then incubated with GIIβ antibody. The immune complex was precipitated using protein A-Sepharose beads. The co-immunoprecipitated RNA was reverse transcribed and amplified by PCR using NR1-specific primers spanning exons 21 and 22. Two DNA fragments of 87 and 198 bp (Fig. 10B, lane 2) were observed following immuno RT-PCR, suggesting that both NR1-3 and NR1-4 splice variants were present in the immune complex. As expected, using the positive control, i.e. in vitro transcribed NR1-3a sense RNA, a single DNA fragment of 198 bp was amplified (Fig. 10B, lane 3). No DNA products were amplified by RT-PCR when immunoprecipitation was performed using buffer instead of GIIβ antibody (data not shown). These results establish that GIIβ is indeed one of the trans-acting proteins binding to the cis-acting region in the 3′-UTR of NR1 mRNA.
Effect of chronic ethanol exposure on GIIβ polypeptide levels
We next examined whether chronic ethanol treatment has an effect on the polypeptide levels of GIIβ. Western blot analysis performed using polysomes from control and ethanol-treated FCN and GIIβ antibody detected a protein band of approximately 88 kDa both in control and in ethanol-treated FCN (Fig. 11A). No significant change in actin polypeptide levels was detected when GIIβ blots were stripped and re-probed with actin antibody (Fig. 11A). Quantification of immunoreactive GIIβ bands in control and ethanol-treated samples showed a significant increase in GIIβ polypeptide levels (41% above control) in ethanol-treated FCN (Fig. 11B).
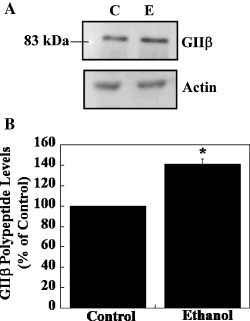
Effect of chronic ethanol on expression of GIIβ protein in cultured FCN. (A) Polysomes from control (lane C) and chronic ethanol treated (lane E) FCN were separated on SDS-PAGE, blotted onto PVDF membrane and probed with GIIβ antibody. Immunoreactive GIIβ polypeptide bands were visualized using ECL Plus as described in the Materials and methods. The position of a 83-kDa prestained broad-range protein molecular weight marker protein is indicated on the left. To normalize the GIIβ results, membranes from GIIβ Western blotting were stripped and re-probed with actin antibody. (B) Quantification of GIIβ polypeptide levels was performed using ImageQuantTL software. Intensities of GIIβ bands were normalized by dividing the density of GIIβ bands with the density of the actin band from the same lane and data are expressed as a percentage of control (mean ± SEM of three independent experiments). A significant increase in GIIβ polypeptide levels was observed in ethanol-treated polysomes as compared with control polysomes. Statistical analysis was performed by anova and Fisher's least significant difference test, *P < 0.05.
Discussion
In this report we have continued our investigation into the molecular mechanisms involved in regulating the NR1 receptor subunit in the presence of ethanol. Previously we have shown that ethanol increases the half-life of the NR1 subunit mRNA in FCN (Kumari & Ticku, 1998) and that new protein synthesis is critical for this phenomenon (Kumari et al., 2003). This is the first study demonstrating the presence of a cis-acting region in the 3′-UTR of the NR1 mRNA and its interaction with three trans-acting proteins expressed in cultured FCN. Following identification of one of these trans-acting proteins as the beta subunit of alpha glucosidase II (GIIβ) we provide evidence for interaction of GIIβ with NR1 mRNA and up-regulation of GIIβ in FCN exposed to chronic ethanol (50 mm, 5 days).
The complete sequence of the mouse NR1 3′-UTR of splice variants that are expressed in cultured mouse FCN was not known when we initiated the present study. Therefore, we first obtained the 3′ ends of NR1 mRNA by 3′ RACE using poly(A)+ RNAs purified from FCN cultured in the presence or absence of chronic ethanol (50 mm, 5 days). Cloning of 3′ RACE products and DNA sequencing indicated that the mouse NR1 3′-UTR spans 879 nt and has a high G+C content (65%). Sequence analysis of the cloned 3′ ends illustrated that (1) NR1-3 and NR1-4 have identical 3′-UTRs, and (2) FCN cultured in the presence or absence of ethanol express only NR1-3 and NR1-4 splice variants, confirming our previous observations on the expression of these NR1 splice variants in FCN (Kumari, 2001). A sequence comparison among species revealed 85% similarity between mouse and rat sequence, and 75% similarity between mouse and human sequence. The presence of a cis-acting region within the NR1 3′-UTR was examined by its ability to bind trans-acting proteins by employing RNA gel mobility shift assays. The RNA gel mobility shift assay performed using 879-nt NR1 3′-UTR RNA and polysomes from control and ethanol-treated FCN gave a shift of UTR RNA. The rationale for using polysomes in these assays was based upon our previous observation that NR1 mRNA is always associated with endoplasmic reticulum (or the polysomal fraction) of cultured neurons (Kumari et al., 2003). After observing a shift of UTR RNA, we designed and generated a series of overlapping deletion mutants of the NR1 3′-UTR. By testing deletion mutants in RNA gel mobility shift assays we defined a cis-acting region of 156 nt in the NR1 3′-UTR. RNA binding to polysomes from ethanol-treated cortical neurons (50 mm, 5 days) was enhanced significantly as compared with polysomes from cortical neurons cultured in the absence of ethanol.
That the observed shift of RNA sequences is due to interaction between RNA and protein was established by either digesting the polysomal proteins with proteinase K or digesting radiolabeled RNA probe with ribonucleases. The ability of proteinase K to abolish the RNA–protein binding strongly suggested that the trans-acting binding factor(s) are composed of proteins. This observation was confirmed by using heat denatured polysomes in RNA gel mobility shift assays. Heat denaturation of polysomal proteins most likely results in unfolding of the three-dimensional configuration of the trans-acting protein(s) present in the polysomes, thereby inhibiting the RNA–protein interactions. Likewise, digestion of radiolabeled RNA probe by RNases prior to incubation with polysomes produced no RNA shift, thus providing supportive evidence that interaction between cis-acting sequences and trans-acting protein(s) is required to observe a shift of NR1 3′-UTR RNA in a RNA gel mobility shift assay. The NR1 3′-UTR RNA–protein interaction appears to be highly specific. For instance, presence of tRNA in the incubation mix did not interfere with RNA–protein interaction. Second, no RNA–protein complex formation was observed when polysomes were incubated with radiolabeled vector sequence. Binding of polysomal proteins to vector sequence was examined because when all linearized deletion mutants are transcribed in vitro, they contain 8–24 nt of vector sequence. Additionally, RNA–protein interactions occurred in the presence of a 50 molar excess of the non-specific competitor, cyclophilin RNA. By contrast, an equimolar concentration of specific competitor mRNA abolished the RNA–protein interactions. Finally, interaction between polysomal proteins and the 156-nt-long cis-acting region appears to be strong, as the complex formation is reduced only in the presence of 500 mm salt.
To determine whether a single band of RNA–protein complex seen on a native 5% polyacrylamide gel in a RNA gel mobility shift assay contains more than one protein component, we employed two methods, UV cross-linking and Northwestern analysis. Interestingly, a single band of RNA–protein complex seen on a native RNA gel was resolved into three trans-acting proteins in UV cross-link and Northwestern analyses. A similar scenario has been reported for the erythropoietin mRNA binding proteins. A single RNA–protein band seen on a native gel was resolved into two erythropoietin RNA binding proteins (Rondon et al., 1991).
The observation that RNA-mobility shifts were detected with control polysomes suggests an important role played by NR1 mRNA binding protein(s) in the normal regulation of the NR1 receptor subunit mRNA. This notion is further supported by the observations that both in Northwestern analysis and UV cross-linking some amount of constitutive RNA–protein binding activity is observed. In this regard, it is interesting to note that the rat β1-adrenergic receptor 3′-UTR recognizes the mammalian embryonic lethal abnormal vision (ELAV)-like protein HuR. Upon exposure of rat C6 glioma cells to a β1-adrenergic receptor agonist, an up-regulation of the constitutively expressed RNA binding protein, HuR, is observed. Up-regulation of HuR results in a concomitant decrease in the β1-adrenergic receptor mRNA half-life, indicating that HuR plays a role in both agonist-independent and agonist-dependent post-transcriptional regulation of the β1-adrenergic receptor mRNA (Kirigiti et al., 2001).
A key finding of our data is the ethanol-mediated up-regulation of the ∼ 88-kDa NR1 mRNA binding trans-acting protein in cultured FCN. Purification and analysis by tandem mass spectrometry identified the 88-kDa trans-acting protein as GIIβ. This is the first report identifying GIIβ as a RNA-binding protein. Interestingly, several other enzymes, such as glutamate dehydrogenase, thiolase and glycerldehyde-3-phosphate dehydrogenase, have been reported to bind RNA (Hollams et al., 2002). The nascent GIIβ protein has a molecular mass of 59 kDa, but it migrates slowly on SDS-PAGE (Sakai et al., 1989; Arendt & Ostergaard, 1997).
To date, the exact biological function of GIIβ has remained elusive. Although originally described as an endoplasmic reticulum resident protein (Trombetta et al., 1996), several studies have proposed a role for this protein in intracellular signaling and cell activation pathways (Hirai & Shimizu, 1990). In a recent report, the protein 80-KH, a synonym for GIIβ, has been implicated as a calcium-dependent regulator of the epithelial Ca2+ channel transient receptor potential cation channel V5 (TRPV5) (Gkika et al., 2004). TRPV5 and 80-KH were consistently co-localized at the apical membrane of digital convoluted and connecting tubules of the kidney. Interestingly, however, in the absence of TRPV5, both endogenously and heterologously expressed 80-KH could not be detected at the plasma membrane of HEK293 cells. This association could argue for a unique role of 80-KH in TRPV5-expressing tissues. Indeed, such tissue specific activity of 80-KH or GIIβ could help explain the diverse biological functions attributed to this protein (Li et al., 1996; Trombetta et al., 1996; Arendt & Ostergaard, 1997). It is possible that in neurons, GIIβ plays a unique role in the regulation of NR1 gene expression. Perhaps interaction of NR1 mRNA with NR1-binding trans-acting proteins including GIIβ results in the formation of a complex that protects the NR1 mRNA from degradation by ribonucleases. Currently experiments are underway to test this hypothesis.
The RNA-binding ability of GIIβ confirmed by RNA supershift assays and immuno RT-PCR represents a novel role for this protein. The primary sequence of GIIβ does not harbor any known RNA-binding motif (Burd & Dreyfuss, 1994), an observation that strongly suggests that GIIβ possesses a unique RNA-binding domain. Annexin A2, a calcium-binding protein suggested to play a number of different intracellular roles including mediation of calcium regulated endo- or exocytosis, and ion channel regulation, has recently been established to function as a novel RNA-binding protein (Filipenko et al., 2004). Similar to GIIβ, the annexin A2 sequence does not contain any known RNA-binding motif. It is also interesting to note that calreticulin, which is most abundant in the endoplasmic reticulum (Johnson et al., 2001), possesses RNA binding activity. Calreticulin binds rubella virus RNA (Singh et al., 1994), mRNAs of two transcription factors, C/EBPα and C/EBPb (Timchenko et al., 2002), as well as cyclin-dependent p21 kinase mRNA (Iakova et al., 2004). Binding of calreticulin to C/EBPα and C/EBPb mRNAs, and p21 kinase mRNA represses translation of the respective mRNAs (Timchenko et al., 2002; Iakova et al., 2004). It is possible that GIIβ and other NR1 mRNA binding trans-acting proteins modulate translation of NR1 mRNA. This premise is based upon the fact that chronic ethanol treatment results in up-regulation of NR1 protein levels (Follesa & Ticku, 1996; Kumari, 2001) and GIIβ (present study) in fetal cortical neurons. Interaction of NR1 mRNA with GIIβ and other trans-acting proteins may result in NR1 mRNA stabilization, a process that in turn may increase the NR1 protein levels, an indirect effect on NR1 mRNA translation. We are currently performing experiments to determine the exact functional role of GIIβ in post-transcriptional regulation of NR1 mRNA. However, the studies presented here have laid a foundation for further investigation into the molecular effect(s) of chronic ethanol on NMDA receptor expression and ultimately on the development of alcohol dependence and withdrawal syndrome.
Acknowledgements
We are grateful to Dr Hanne Ostergaard (University of Alberta, Edmonton, Canada), Dr Nora Perrone-Bizzozero (University of New Mexico, Albuquerque, NM, USA) and Dr Hans Dieter Royer (Stiftung Caesar, Bonn, Germany) for providing us with the antibody to GIIβ, HuD and YB-1, respectively. We also acknowledge the laboratory assistance of Nathan Wienandt. Support for the present work was provided by NIH-NIAAA 12070 and the Alcoholic Beverage Medical Research Foundation (ABMRF).
Abbreviations
-
- FCN
-
- fetal cortical neurons
-
- GIIβ
-
- the beta subunit of alpha glucosidase II
-
- immuno RT-PCR
-
- immunoprecipitation and RT-PCR
-
- NR1,2,3
-
- NMDA R1,2,3
-
- RT-PCR
-
- reverse transcription–polymerase chain reaction
-
- SA-PMPs
-
- streptavidin-conjugated paramagnetic beads
-
- TRPV5
-
- Ca2+ channel transient receptor potential cation channel V5
-
- µLC/MS/MS
-
- nano-electrospray tandem mass spectrometry
-
- UTR
-
- untranslated region


