Microsatellites reveal fine-scale genetic structure of the Chinese surf clam Mactra chinensis (Mollusca, Bivalvia, Mactridae) in Northern China
Abstract
As a commercially important fisheries resource in East Asia, the Chinese surf clam Mactra chinensis has experienced severe population declines in the past decades, probably due to over-exploitation. To provide scientific bases for fisheries management and artificial breeding, we investigated genetic variation and population structure of Mactra chinensis in Northern China using microsatellites. Samples collected from eight localities throughout natural habitats of the species in Northern China were genotyped. Nine microsatellites revealed high allelic diversity with 14–36 alleles per locus. Observed and expected heterozygosity varied from 0.593 to 0.945 and from 0.638 to 0.958, respectively. Pairwise FST values indicated that all population pairs had small but significant genetic differentiation. A Mantel test showed statistically significant correlations between genetic distance and geographical distance, indicating that genetic differentiation of the Chinese surf clam conformed to a pattern of isolation-by-distance. Cluster analysis using neighbor-joining separated the eight populations into three groups. The three areas of low gene flow identified by barrier analysis corresponded with local oceanographic features, suggesting that marine currents and peninsulas play an important role in population structuring of this species.
Introduction
Marine species are expected to exhibit lower geographical differentiation than terrestrial species, due to some or a combination of the following: large population sizes, high fecundity, planktonic larval periods in their life cycle and lack of physical barriers (Palumbi 1992; Nielsen & Kenchington 2001; Nielsen et al. 2004). Although lack of geographical differentiation has been identified in some marine species, there are increasing signs that marine species show more differentiation than could be predicted through their dispersal potential (e.g.David et al. 1997; Larson & Julian 1999; Kenchington et al. 2006; Zhan et al. 2009; Kelly & Palumbi 2010). Genetic differentiation in such cases has been attributed to a number of mechanisms related to biology, ecology and behavior of the species, or to ecological or hydrographical barriers to dispersal (e.g.Hedgecock 1986; Palumbi 1994).
Contrary to marine fishes, marine bivalve mollusks are typically sedentary or sessile as adults (Kenchington et al. 2006), resulting in limited mobility. However, most marine bivalves have high fecundity and a pelagic larval phase, resulting in high dispersal potential. Thus, larval dispersal turns into a fundamental factor influencing gene flow and population structure in marine bivalves. Despite a failure to identify population structure in some studies (Ahmad et al. 1977; Benzie & Williams 1992), many genetic analyses in marine bivalves have recognized genetic differentiation over large or small geographical scales (e.g.Reeb & Avise 1990; Launey et al. 2002; Luttikhuizen et al. 2003; Chambers et al. 2006; Zhan et al. 2009). Although mechanisms for geographical differentiation and population structuring are not clarified explicitly, extrinsic factors such as marine currents and hydrographical barriers to dispersal are inferred to play a critical role in population structuring of several marine bivalves (Kenchington et al. 2006; Zhan et al. 2009; Xiao et al. 2010).
The Chinese surf clam Mactra chinensis, a marine bivalve belonging to the family Mactridae, is distributed along the Northwestern Pacific coast from East China Sea to Sakhalin of Russia (Xu & Zhang 2008). The main natural habitats of M. chinensis in China are along the coasts of the Shandong and Liaodong Peninsulas (Fig. 1). As a commercially important fisheries resource, M. chinensis has experienced severe population declines probably due to over-exploitation of natural stocks and deterioration of environmental conditions in the past decades. Knowledge of the genetic structure of M. chinensis, which remains unstudied to date, is critical for defining management units and maintaining sustainable fisheries (Thorpe et al. 2000). Although sedentary as adult, M. chinensis is a benthic bivalve having a planktonic larval phase of about 10 days under natural conditions (Wang et al. 1984). Based on the pelagic larval phase and the breeding characteristic of iteroparity with high fecundity (>106 eggs per female), the genetic structure for M. chinensis can be hypothesized to be weak at a fine scale. However, hydrographical and ecological barriers to larval dispersal may result in strong genetic structuring of this species. Our study was therefore designed to investigate whether there was any geographical differentiation or unique genetic structure in Chinese surf clam populations, and to check which factors might constitute barriers to gene flow when geographical differentiation exists.
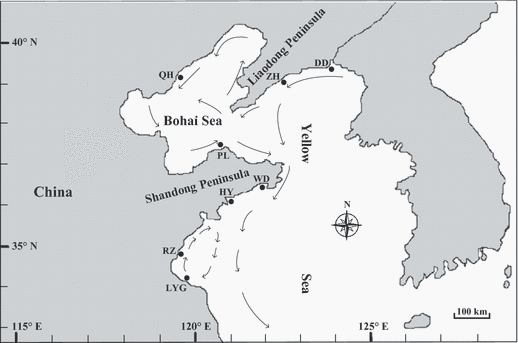
Approximate location of sampling sites shown with shaded circles, and mean currents in the spawning season (from June to August; Su & Yuan 2005) indicated by arrows.
Microsatellite markers provide an effective tool to assess population genetic structure, due to their high polymorphism, neutrality, abundance, codominance, and unambiguously scoring of alleles (Tautz 1989; Weber & May 1989). Specimens collected from eight localities were therefore investigated with microsatellite markers.
Material and Methods
Sample collections and DNA extraction
Sample sites were chosen to cover the main natural habitats of Mactra chinensis in Northern China. Eight local populations were sampled from the Bohai and Yellow Seas between 2006 and 2009. The Qinhuangdao and Penglai populations were sampled in the Bohai Sea. Six other sample localities were distributed across the Yellow Sea: Dandong, Zhuanghe, Wendeng, Haiyang, Rizhao and Lianyungang. The maximum and minimum geographic distances (the shortest water distance) between populations are approximately 825 km (Lianyungang and Qinhuangdao) and 63 km (Rizhao and Lianyungang), respectively. Collection details for the eight M. chinensis populations are shown in Table 1 and Fig. 1. The adductor muscle was removed from fresh specimens and preserved in 100% ethanol until DNA preparation. Genomic DNA was extracted from adductor muscle by standard proteinase K digestion, phenol-chloroform extraction, and DNA precipitation as described by Li et al. (2002).
| sample | abbreviation | sample size | geographical coordinates |
|---|---|---|---|
| Haiyang | HY | 54 | 36°34′ N, 121°01′ E |
| Lianyungang | LYG | 60 | 34°34′ N, 119°41′ E |
| Rizhao | RZ | 60 | 35°06′ N, 119°23′ E |
| Penglai | PL | 60 | 37°50′ N, 120°44′ E |
| Wendeng | WD | 55 | 36°54′ N, 122°03′ E |
| Zhuanghe | ZH | 60 | 39°38′ N, 122°59′ E |
| Qinhuangdao | QH | 50 | 39°54′ N, 119°36′ E |
| Dandong | DD | 42 | 39°50′ N, 124°10′ E |
Microsatellite analysis
Individual genotypes were assessed with nine polymorphic Mactra chinensis microsatellite loci: Mc1, Mc2, Mc9, Mc10, Mc16, Mc21, Mc24, Mc28 and Mc30 (Ni et al. 2010). The polymerase chain reactions (PCRs) were performed in 10-μl volumes containing 0.25 U Taq DNA polymerase (Takara, Japan), 1× PCR buffer, 0.2 mm dNTP mix, 1.5 mm MgCl2, 1 μm of each primer set, and 100 ng of genomic DNA. PCR was performed on a thermal cycler (GeneAmp System 9700) as follows: 3 min at 94 °C, 35 cycles of 1 min at 94 °C, 1 min at the optimal annealing temperature (Ni et al. 2010), and 1 min at 72 °C, followed by a final extension of 5 min at 72 °C. Amplification products were resolved via 6% denaturing polyacrylamide gel, and visualized by silver staining. For allele size determination, a 10-bp DNA ladder (Invitrogen, USA) was used as a reference. To eliminate inaccuracy in scoring due to differences in gels, a control DNA sample was included for each gel.
Data analysis
Null alleles and scoring errors due to large allele dropout and stuttering were checked with the software MICRO-CHECKER 2.2.3 (van Oosterhout et al. 2004). The number of alleles per locus (N), expected heterozygosity (HE) and observed heterozygosity (HO) were calculated using the program MICROSATELLITE ANALYSER (MSA; Dieringer & Schlötterer 2003). Allelic richness (AR), an index suitable for measuring the number of alleles irrespective of sample size, was estimated with FSTAT version 2.9.3 (Goudet 2001). The Kruskal–Wallis test (Sokal & Rohlf 1995), a nonparametric analysis of variance, was performed to test for differences in allelic richness among populations. Deviations from Hardy–Weinberg equilibrium (HWE) for each locus in each population were estimated using the exact test (Guo & Thompson 1992) implemented in GENEPOP 4.0 software (Raymond & Rousset 1995). Linkage disequilibria between pairs of loci were tested using the same program. Significance levels for multiple comparisons were adjusted by a sequential Bonferroni correction (Rice 1989).
Weir & Cockerham’s (1984) FST (θ) was calculated with the program MSA to estimate pairwise genetic differentiation between samples. Statistical significance of FST values was tested using 1000 permutations, and corrected with the Bonferroni procedure (Rice 1989). The Cavalli-Sforza and Edwards (1967) chord distance DC was calculated and an unrooted neighbor-joining tree (NJ tree) was constructed with the software POPULATIONS 1.2.30 (Langella 1999). Nodal support was assessed by bootstrapping with 1000 replicates. The tree was visualized in TREEEXPLORER 2.12 (Tamura 1997). A multilocus analysis of molecular variance (AMOVA) was conducted to check for hierarchical structure of variability, using ARLEQUIN 3.5 (Excoffier & Lischer 2010). Molecular variance was assessed with exact tests based on 10,000 permutations.
Isolation by distance (IBD), a model in which genetic differentiation increases with geographical distance, has been suggested as robust for investigating gene flow of marine species (Palumbi 2003). A Mantel’s Z-test implemented in GENALEX 6.3 (Peakall & Smouse 2006) was performed to test the IBD model by correlating geographical distance (the shortest water distance) to genetic distance [θ/(1−θ); Rousset 1997]. Significance of the IBD pattern was determined with 999 permutations.
To identify possible genetic barriers, tests for geographical boundaries were performed using the program BARRIER 2.2 (Manni et al. 2004). A network connecting all samples was generated by Delauney triangulation with the geographical coordinates for each sample. Monmonier’s maximum distance algorithm was used to identify putative barriers.
Results
Genetic diversity within populations
All the microsatellite loci were highly polymorphic, while degree of diversity was different at each locus. In total, 242 alleles were detected at the nine microsatellite loci analyzed. Of the samples, locus Mc16 exhibited the highest variation (36 alleles in total) and Mc2 the lowest (14 alleles).
Genetic diversity parameters for the eight Mactra chinensis populations are summarized in Table 2. The number of alleles per locus in each population ranged from 7 to 27, and allelic richness per locus varied from 6.9 to 26.0 for each sample. Of all loci, the least average number of alleles was detected in the DD population, whereas populations LYG and PL showed the largest average number of alleles. The HY population had the lowest average allelic richness (16.4), and PL showed the highest (17.6). There was no significant difference in the average allelic richness among these populations (Kruskal–Wallis test, df = 7, P = 0.9996). The observed and expected heterozygosities varied from 0.593 to 0.945 and from 0.638 to 0.958, respectively. The PL population had the highest average expected heterozygosity (0.903), whereas DD exhibited the lowest (0.870). No linkage disequilibrium was detected in locus-pairs (no P values were significant after Bonferroni correction), suggesting that the loci can be treated as independent variables. Sixteen of the 72 locus-population combinations were out of Hardy–Weinberg equilibrium (P < 0.05), decreasing to eight after Bonferroni correction (Table 2). No locus was detected to deviate significantly from HWE across all populations (locus Mc9 and locus Mc21 had the most departures with three populations).
| HY | LYG | RZ | PL | WD | ZH | QH | DD | Total | |
|---|---|---|---|---|---|---|---|---|---|
| Mc1 | |||||||||
| N | 17 | 18 | 16 | 15 | 14 | 15 | 13 | 15 | 28 |
| AR | 15.8 | 16.1 | 14.8 | 14.1 | 13.2 | 14.4 | 12.6 | 15.0 | 15.9 |
| HO | 0.833 | 0.750 | 0.800 | 0.767 | 0.745 | 0.783 | 0.800 | 0.786 | 0.782 |
| HE | 0.846 | 0.806 | 0.832 | 0.797 | 0.751 | 0.804 | 0.840 | 0.820 | 0.832 |
| Mc2 | |||||||||
| N | 9 | 12 | 11 | 11 | 13 | 11 | 9 | 9 | 14 |
| AR | 8.8 | 11.0 | 10.9 | 10.9 | 12.5 | 10.4 | 8.8 | 9.0 | 10.9 |
| HO | 0.722 | 0.800 | 0.733 | 0.817 | 0.818 | 0.783 | 0.640 | 0.690 | 0.755 |
| HE | 0.802 | 0.832 | 0.744 | 0.885 | 0.850 | 0.851 | 0.671 | 0.815 | 0.853 |
| Mc9 | |||||||||
| N | 19 | 23 | 25 | 25 | 26 | 26 | 27 | 25 | 35 |
| AR | 18.8 | 21.8 | 23.8 | 24.2 | 24.6 | 24.9 | 26.0 | 25.0 | 28 |
| HO | 0.593 | 0.883 | 0.850 | 0.933 | 0.945 | 0.900 | 0.920 | 0.929 | 0.868 |
| HE | 0.931 | 0.939 | 0.950 | 0.953 | 0.957 | 0.958 | 0.958 | 0.943 | 0.963 |
| Mc10 | |||||||||
| N | 20 | 19 | 18 | 17 | 17 | 20 | 19 | 17 | 24 |
| AR | 18.8 | 18.0 | 16.7 | 16.2 | 16.6 | 17.4 | 18.4 | 17.0 | 18.8 |
| HO | 0.852 | 0.883 | 0.867 | 0.883 | 0.927 | 0.817 | 0.900 | 0.905 | 0.878 |
| HE | 0.930 | 0.933 | 0.915 | 0.925 | 0.931 | 0.879 | 0.928 | 0.925 | 0.929 |
| Mc16 | |||||||||
| N | 23 | 26 | 23 | 24 | 18 | 24 | 27 | 20 | 36 |
| AR | 21.9 | 23.2 | 21.6 | 22.8 | 17.0 | 22.5 | 25.8 | 20.0 | 24.5 |
| HO | 0.759 | 0.933 | 0.900 | 0.883 | 0.891 | 0.917 | 0.860 | 0.857 | 0.878 |
| HE | 0.927 | 0.942 | 0.938 | 0.952 | 0.927 | 0.948 | 0.949 | 0.938 | 0.947 |
| Mc21 | |||||||||
| N | 11 | 12 | 7 | 12 | 8 | 14 | 14 | 10 | 22 |
| AR | 10.7 | 10.8 | 6.9 | 11.6 | 7.8 | 12.8 | 13.4 | 10.0 | 12.8 |
| HO | 0.815 | 0.933 | 0.667 | 0.800 | 0.673 | 0.900 | 0.860 | 0.619 | 0.789 |
| HE | 0.831 | 0.761 | 0.700 | 0.825 | 0.688 | 0.813 | 0.815 | 0.638 | 0.777 |
| Mc24 | |||||||||
| N | 19 | 17 | 19 | 18 | 22 | 16 | 18 | 16 | 25 |
| AR | 18.2 | 15.6 | 17.8 | 17.0 | 21.4 | 15.7 | 17.5 | 16.0 | 20 |
| HO | 0.907 | 0.833 | 0.867 | 0.883 | 0.927 | 0.867 | 0.920 | 0.881 | 0.884 |
| HE | 0.919 | 0.840 | 0.908 | 0.926 | 0.948 | 0.895 | 0.924 | 0.889 | 0.939 |
| Mc28 | |||||||||
| N | 20 | 21 | 20 | 25 | 20 | 17 | 19 | 19 | 29 |
| AR | 19.1 | 19.5 | 19.1 | 22.6 | 19.0 | 16.7 | 18.3 | 19.0 | 20.1 |
| HO | 0.870 | 0.900 | 0.667 | 0.917 | 0.873 | 0.883 | 0.860 | 0.905 | 0.857 |
| HE | 0.931 | 0.929 | 0.940 | 0.927 | 0.935 | 0.926 | 0.915 | 0.925 | 0.933 |
| Mc30 | |||||||||
| N | 16 | 20 | 18 | 21 | 17 | 20 | 16 | 18 | 29 |
| AR | 15.9 | 18.3 | 17.6 | 19.3 | 16.2 | 18.9 | 15.6 | 18.0 | 22.4 |
| HO | 0.870 | 0.900 | 0.850 | 0.933 | 0.873 | 0.917 | 0.860 | 0.881 | 0.887 |
| HE | 0.938 | 0.932 | 0.933 | 0.935 | 0.919 | 0.944 | 0.901 | 0.934 | 0.946 |
| average | |||||||||
| N | 17.1 | 18.7 | 17.4 | 18.7 | 17.2 | 18.1 | 18.0 | 16.6 | |
| AR | 16.4 | 17.1 | 16.6 | 17.6 | 16.5 | 17.1 | 17.4 | 16.6 | |
| HO | 0.802 | 0.869 | 0.800 | 0.869 | 0.853 | 0.863 | 0.847 | 0.828 | |
| HE | 0.895 | 0.879 | 0.873 | 0.903 | 0.878 | 0.891 | 0.878 | 0.870 | |
- N = number of alleles; AR = allele richness; Ho = observed heterozygosity; HE = expected heterozygosity. Bold type indicates significant deviations from Hardy–Weinberg equilibrium after Bonferroni correction (P < 0.05/9).
Genetic differentiation among populations
The global multilocus FST value was low but significant (0.023, P < 0.05), suggesting the existence of genetic heterogeneity among the eight natural populations. Pairwise FST values across all samples ranged from 0.0089 to 0.0410 (Table 3). All 28 pairwise FST tests were significant after Bonferroni correction, indicating that eight M. chinensis populations were significantly different from one another. Maximum differentiation was observed between the LYG population and QH population, which have the maximal geographical distance between populations.
| HY | LYG | RZ | PL | WD | ZH | QH | DD | |
|---|---|---|---|---|---|---|---|---|
| HY | – | 0.3518 | 0.3609 | 0.3633 | 0.3154 | 0.3715 | 0.3665 | 0.3990 |
| LYG | 0.0228* | – | 0.3172 | 0.3714 | 0.3549 | 0.3950 | 0.3846 | 0.4196 |
| RZ | 0.0178* | 0.0268* | – | 0.3687 | 0.3126 | 0.3770 | 0.3913 | 0.3756 |
| PL | 0.0144* | 0.0279* | 0.0192* | – | 0.3284 | 0.3235 | 0.3278 | 0.3903 |
| WD | 0.0139* | 0.0291* | 0.0100* | 0.0089* | – | 0.3636 | 0.3596 | 0.3715 |
| ZH | 0.0196* | 0.0390* | 0.0245* | 0.0111* | 0.0196* | – | 0.3115 | 0.3211 |
| QH | 0.0260* | 0.0410* | 0.0391* | 0.0162* | 0.0250* | 0.0157* | – | 0.3340 |
| DD | 0.0289* | 0.0402* | 0.0271* | 0.0210* | 0.0207* | 0.0127* | 0.0149* | – |
- *Indicates significant difference after Bonferroni correction (P < 0.05/28).
Chord distances (DC) between populations were calculated with the data from nine microsatellite loci. The lowest DC genetic distance was detected between ZH and QH (0.3115), while the largest was between LYG and DD (0.4196). DC is suggested as one of the most efficient distance measures to obtain the tree topology (Takezaki & Nei 1996). According to the neighbor-joining tree (Fig. 2) constructed with the DC genetic distance, the studied eight populations were subdivided into three groups: one group consisting of HY and WD populations, one including LYG population and RZ population, and one group composed of four populations (PL, QH, ZH and DD). Bootstrap support values for the NJ tree are not high for most groups, and the root cannot be determined in the absence of an outgroup. In general, the tree topology could be compatible with the geographical locations of sample sites, if the rooting shown were assumed.
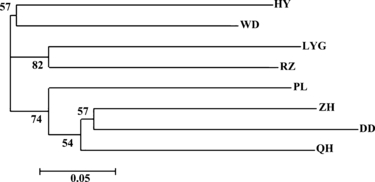
Unrooted neighbor-joining tree based on Cavalli-Sforza and Edwards chord distance among eight populations of Mactra chinensis. Sample abbreviations are listed in Table 1. Numbers on branches indicate bootstrap support values higher than 50%.
The AMOVA analysis identified a significant among-group component, explaining 0.72% of the total variance (Table 4). Most of the variance was distributed within populations (97.50%). The variance component among populations within groups was significant, indicating that populations within groups should not be pooled together due to their genetic heterogeneity.
| source of variation | df | variance components | percentage of variation |
|---|---|---|---|
| within populations | 874 | 3.978 | 97.50* |
| among populations within groups | 5 | 0.072 | 1.77* |
| among groups | 2 | 0.030 | 0.72* |
| total | 881 | 4.080 |
- *Significant at P < 0.05.
Isolation by distance
A significant positive correlation (R2 = 0.5263, P = 0.001) was found between genetic distances [θ/(1−θ)] and geographic distances for all the Mactra chinensis samples (Fig. 3), displaying an isolation-by-distance (IBD) pattern of gene flow. The IBD pattern remained significant (P < 0.05) after excluding any one locus from the analysis, indicating that the correlation was not severely affected by any single locus.
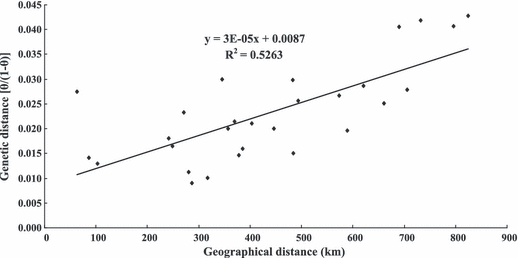
Positive correlation between geographical distance (km) and genetic distance [θ/(1−θ)] shows isolation by distance in Mactra chinensis samples (y = 0.0087 + 3 × 10⁻⁵x, R2 = 0.5263, P = 0.001).
Areas of lowered gene flow
Based on pairwise DC distances, three areas of reduced gene flow were identified (Fig. 4). The first two putative barriers (a and b) separated the area into three parts, corresponding to the three groups based on the neighbor-joining tree – assuming the rooting shown. The third barrier (c) isolated the PL population from other samples. The results revealed by the BARRIER analyses were consistent with the analyses of genetic differentiation among populations and the oceanography (Fig. 1) of the area.
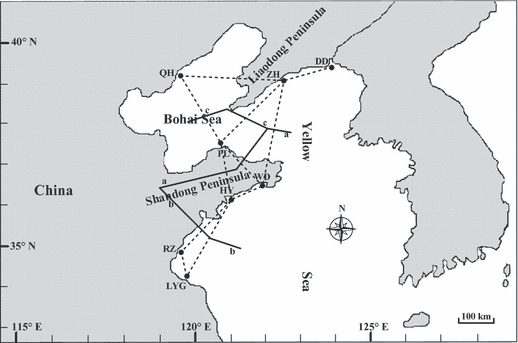
Areas of limited gene flow as identified by barrier analysis using the Monmonier algorithm (Manni et al. 2004). Full lines = main barriers to gene flow. Dotted lines = Delaunay triangulation.
Discussion
Genetic diversity and deviations from HWE
High levels of genetic diversity were observed in all the eight populations through measures of allelic diversity and heterozygosity. High genetic diversities detected in Mactra chinensis (HE = 0.870–0.903) are comparable with those detected in other marine bivalves (e.g. Ostrea edulis, HE = 0.751–0.920, Launey et al. 2002; Placopecten magellanicus, HE = 0.497–0.954, Kenchington et al. 2006; Crassostrea ariakensis, HE = 0.787–0.832, Xiao et al. 2010). This is expected considering the large population sizes of marine bivalves and high mutation rates of microsatellites (Estoup et al. 1998).
While most of the locus-population cases were in accord with HWE, eight significant deviations were found in four of the nine microsatellite loci. Seven of the eight deviations exhibited a heterozygote deficiency, which may result from inbreeding, the Wahlund effect, selection or existence of null alleles (Astanei et al. 2005). In the present study, inbreeding can be precluded by the heterogeneous deficits among loci, because inbreeding should affect all loci and cause uniform heterozygote deficiencies across loci. Selection cannot be invoked for the observed heterozygote deficits, as microsatellites are generally considered neutral markers. Among the four loci that showed deviations from HWE, three detected existence of null alleles by the Micro-Checker analyses, suggesting that null alleles may play an important role in departures from HWE. Null alleles, frequently reported in microsatellite analyses of marine bivalves (Huvet et al. 2000; Launey et al. 2002; Rose et al. 2006; Gruenthal & Burton 2008), are attributed to variable nucleotides in primers (Hedgecock et al. 2004; Zhan et al. 2009). In addition, M. chinensis is iteroparous with high fecundity (>106 eggs per female), has a spawning time over 3 months per year, and changes their habitats occasionally (Wang et al. 1984). These characteristics provide chances for admixture of individuals from different populations, which might cause the observed deviations from HWE. Therefore, a Wahlund effect cannot be excluded as an explanation for the departures.
Population structure
Significant genetic structure at a large scale has been reported in several marine bivalves (Reeb & Avise 1990; Arnaud et al. 2000; Launey et al. 2002; Xiao et al. 2010), while very few investigations have found significant population differentiations in marine bivalves over a fine geographical scale (Luttikhuizen et al. 2003; Zhan et al. 2009). In this study, significant genetic structure was detected among the Mactra chinensis populations sampled at a fine geographical scale. Global genetic divergence was weak but significant, showing genetic heterogeneity among these populations. All the pairwise FST values were found to be small but significantly different from one another, so panmixia was rejected as an explanation for population structure of M. chinensis. It demonstrates that, despite a planktonic larval phase of about 10 days (Wang et al. 1984), genetic exchange among these populations is low and insufficient to nullify population differences generated by genetic drift and selection. The level of differentiation is comparable to that observed in other marine bivalves over similar geographic scales (e.g. Ostrea edulis, Launey et al. 2002; Placopecten magellanicus, Kenchington et al. 2006; Chlamys farreri, Zhan et al. 2009). Since marine bivalves are typically sedentary or sessile as adults, larval dispersal turns into a crucial factor influencing gene flow and population structure. Traits of iteroparity, high fecundity and pelagic larval phase provide high dispersal potential for larvae of M. chinensis. However, significant population differentiations suggest that gene flow among these M. chinensis populations is low, suggesting limited larval dispersal and potential barriers to gene exchange. Additionally, the topology of the neighbor-joining tree and the result of barrier analysis suggested that gene flow among groups was limited and barriers to genetic exchange might exist between groups.
Population genetic structure of M. chinensis along the coast of North China was consistent with a model of isolation by distance, where gene flow among populations decreases as the geographic distance between them increases. The present study detected a significant relationship between gene flow and geographic distance with R2-vlaue exceeding 0.50 (R > 0.70), suggesting that IBD explained a great proportion of gene flow. Similar IBD pattern have also been reported in other marine bivalves (Arnaud et al. 2000; Launey et al. 2002; Rose et al. 2006; Lind et al. 2007; Xiao et al. 2010). The IBD pattern indicated restrictions to long-distance migration among the M. chinensis populations.
Geographical differentiation in relation to marine currents and peninsulas
Marine currents are an important factor, which affect genetic exchange among populations and play a key role in population differentiations of marine species, especially for those with planktonic larval development (Kenchington et al. 2006; Zhan et al. 2009). Putative barriers of M. chinensis populations identified through barrier analyses corresponded with the local oceanographic features. In the neighbor-joining tree, the LYG and RZ populations formed a cluster. It is important to note that these were collected from the same marine gyre (Fig. 1). Larval dispersal driven by marine currents may accelerate gene flow and depress the differentiation between these. On the other hand, marine currents in this area may block gene flow and accelerate genetic divergence between the two populations and populations out of this area. This agrees with Zhan et al. (2009) who found that two Chlamys farreri populations in this area formed a cluster, and the other four populations formed another. The Bohai Sea is considered a semi-closed sea with poor water exchange with the Yellow Sea (Yuan 1997; Wei et al. 2002). The QH population located inside the Bohai Sea provides an opportunity to verify this view. Interestingly, putative barrier (c) did not segregate the QH population, but separated the PL population from the other populations (Fig. 4). The NJ tree topology also showed that QH, ZH and DD are more closely related to each other than to PL. The marine currents can give a good explanation for this case. On one hand, the marine currents flowing into the Bohai Sea (Fig. 1) may drive gene flow between the QH population and the two populations of ZH and DD; on the other hand, it could act as a physical barrier to gene exchange for the PL population with the other three populations (QH, ZH and DD). Although some other factors, such as selection or genetic drift, might play a role in geographical differentiation of M. chinensis, marine currents seem to be the major players.
In addition to marine currents, peninsulas also contribute much to population differentiation of M. chinensis. In the present study, the Shandong Peninsula was identified as the first putative barrier separating the northern from the southern populations. Given the oceanographic complexity in habitats of M. chinensis, we should be aware that it may be simpler to explain the population differentiation by only marine currents, peninsulas and the IBD model. In contrast to marine invertebrates in the open sea, the population structure of coastal invertebrates is prone to barriers from biogeographic, historical or oceanographic factors (Kelly et al. 2006; Kenchington et al. 2006; Chang et al. 2009; Zhan et al. 2009). As a coastal invertebrate, larval dispersal of M. chinensis can be interrupted by more complicated oceanographic factors, such as bays, islands, salinity and water temperature. Although M. chinensis has a relatively long spawning period (over 3 months; Wang et al. 1984), effects of spawning on population differentiation will be restricted by its limited adult migration. Historical factors (e.g. sea level changes during the Pleistocene, Liu et al. 2007), which might have had an impact on the distribution of genetic diversity and cause genetic divergence among M. chinensis populations, remain to be tested in further studies.
Conclusions
Our results reveal that significant population structure at a fine geographical scale is present in Mactra chinensis. This adds to the increasing evidence that marine species with high dispersal potential can also exhibit significant population structure. Our study also suggests the value of considering oceanographic features, in addition to the genetic data, in identifying genetic structure of marine organisms. It is probable that marine currents and peninsulas play an important role in defining population differentiations of M. chinensis. Future studies on geographical differentiations of marine bivalves should focus not only on marine currents, but also on historical vicariance events and additional oceanographic factors. The genetic diversity and population differentiation of M. chinensis can provide useful information for fisheries management and artificial breeding to establish a balance between maintenance of genetic divergence and diversity.
Acknowledgements
This study was supported by research grants from 973 Program (2010CB126406), and National Natural Science Foundation of China (40906064). We would like to thank Dr. Gonzalo Giribet and two anonymous reviewers for their extensive and constructive comments on the manuscript.


