The influence of coastal dynamics on the upper limit of the Posidonia oceanica meadow
Abstract
The recognized ecological importance of Posidonia oceanica, the most important seagrass of the Mediterranean Sea, makes it crucial to assess the state of health of its meadows, discriminating natural from anthropogenic impacts. In this paper, the hydrodynamic conditions at the upper limit of P. oceanica meadows along the Ligurian coast (NW Mediterranean Sea) were investigated. A relationship between the distance of the upper limit of the meadow from the shoreline and the morphodynamic domain of the beach (i.e. distinctive types of beach produced by the topography, wave climate and sediment composition) was found. A zonation of the state of the shallow portions of the meadows down the submerged beach profile was identified. Zone a, from the shoreline to the breaking limit, is naturally critical for the development of the meadow. Zone b, from the breaking limit to the closure depth, is subjected to natural and human impacts. Zone c, below the closure depth, is little influenced by coastal dynamics. This study quantifies for the first time how much the status of the shallow portions of P. oceanica meadows is dependent on coastal dynamics, which is important for their proper management.
Problem
In the last century, extensive proliferation of urban structures has caused radical changes in habitat structure and loss of species in the coastal zone (Benoit & Comeau 2005; Shochat et al. 2006). Sustainable management to help recovery and avoid further alteration requires knowledge of coastal systems, discriminating between anthropogenic and natural processes (Montefalcone et al. 2010). Integrated coastal management should take into account the hydrodynamic features of the coastal area (Tigny et al. 2007; Cabaço et al. 2008) and recognize the complex interplay between biotic and abiotic components (Mokhtar & Aziz 2003).
Seagrass meadows are key ecosystems (Short & Wyllie-Echeverria 1996), influencing coastal zone features in terms of wave reduction (Gacia & Duarte 2001; Boudouresque et al. 2006) and shoreline stabilization (Short et al. 2007). The endemic species Posidonia oceanica (L.) Delile is the most important seagrass in the Mediterranean Sea (Boudouresque et al. 2006). The increased water turbidity linked with the exploitation of coastal areas has been recognized as one of the most important causes of regression of the deep portions of its meadows (Ardizzone et al. 2006; Boudouresque et al. 2006; Montefalcone et al. 2009). Many studies have focused on the position of the lower limit of the P. oceanica meadow, which is the greatest depth reached by the meadow due to local environmental features (Boudouresque et al. 2006). In contrast, there have been fewer investigations of the upper (shallowest) limit of a meadow.
Regression and consequent seaward deepening of the upper limit are generally considered to be due to anthropogenic pressures (Bianchi & Peirano 1995; Boudouresque et al. 2006), although the influence of natural changes in environmental conditions (e.g. climate fluctuations, substratum characteristics and hydrodynamic regime) has also been recognized (La Loggia et al. 2004; Occhipinti-Ambrogi 2007; Giovannetti et al. 2008). Several studies have correlated the occurrence of P. oceanica meadows with sedimentological features (Gacia et al. 1999; Cavazza et al. 2000; De Falco et al. 2000, 2008; Gacia & Duarte 2001) or wave energy (Basterretxea et al. 2004; Koch et al. 2006; Infantes et al. 2009), but almost none has taken the whole of coastal dynamics into account.
The aim of this paper is to quantify how much the status of shallow portions of P. oceanica meadows is dependent on local coastal dynamics. The state of the meadow upper limit was related to hydrodynamic conditions in four areas along the coast of Liguria, an administrative region of NW Italy, where the P. oceanica meadows have recently been investigated in great detail by SCUBA diving (Montefalcone et al. 2009).
Material and Methods
Study area
The four areas, distributed over the whole Ligurian Riviera (Ligurian Sea, NW Mediterranean Sea), were investigated between June 2006 and March 2007 (Fig. 1). Imperia (I) and Ceriale (C) are located in the Western Riviera: their meadows cover about 157 ha and 450 ha, respectively (Diviacco & Coppo 2007). In the Eastern Riviera, the meadow of Prelo (P) covers an area of about 8 ha in a small cove (Lasagna et al. 2006; Montefalcone et al. 2006), whereas that of Monterosso al Mare (M) covers nearly 30 ha (Gongora-Gonzales et al. 1996) and is characterized by a gravel and sandy beach bordered, in its western part, by an high plunging cliff. This area is exposed to the SW waves.

Geographic setting of the four coastal areas investigated along the Ligurian coast (NW Mediterranean Sea) and location of the two sites (A and B) within the areas. Extent of Posidonia oceanica meadows (pale gray) is also indicated.
The four meadows were selected in order to have sites with different geomorphological settings (Fierro 1999) but all showing a comparable low degree of human influence (Diviacco & Coppo 2007; Montefalcone et al. 2009). Imperia has gravelly to sandy beaches at the base of sheer cliffs. It is mainly exposed to waves from the SW. Ceriale presents one of the longest sandy beaches in the Liguria region (about 5 km long). Due to the N–S orientation of the coastline, Ceriale is protected from SW waves and exposed only to SE waves. Prelo is a pocket beach composed essentially of gravel and surrounded by low rocky sides, completely sheltered from the SW waves and exposed to the SE waves. Monterosso al Mare (M) is characterized by a gravel and sand beach bordered, in its western part, by a high sheer cliff. This area is exposed to SW waves.
The Ligurian coastline is mainly exposed to winds blowing from the second and third quadrants. SW is the dominant wave direction, with a fetch greater than 800 km and an off-shore wave height of more than 3 m, followed by the SE and S wave directions. The former has a fetch of 200 km and waves of about 2 m, the latter has a fetch of 180 km and smaller waves. The offshore wave parameters (return time 1 year) used in the analyses (Table 1) have been taken from various sources (MEDATLAS Group, 2004; Ferrari et al. 2006; http://www.idromare.it).
| Area | Wave direction | H0 (m) | L0 (m) | T0 (s) |
|---|---|---|---|---|
| Imperia (I) | SW | 4.00 | 88.00 | 7.5 |
| Ceriale (C) | SE | 2.44 | 56.16 | 6.5 |
| Prelo (P) | SE | 2.44 | 56.16 | 6.5 |
| Monterosso al Mare (M) | SW | 4.40 | 99.80 | 8.0 |
The maximum tidal amplitude for the Liguria Sea is about 0.3 m (Istituto Idrografico della Marina, 2006), and therefore it was considered to be irrelevant in this study.
Bathymetry
In each area a bathymetric survey was carried out with a single-beam echo-sounder (single frequency, error ± 0.1 m, 1 point every 5 s) and differential GPS to determine the morphology of the sea floor in correspondence with the meadow extent. Bathymetric data were interpolated by SURFER® Software (Triangulation with Linear Interpolation) producing a 2D bathymetric map for each of the four areas. The breaking depth (db) of the beach profile parameters, i.e. the depth where the wave breaks (Smith 2003), and the closure depth (dc), i.e. the depth where wave action on the sea floor becomes negligible (Sorensen 2006), were computed from the wave parameters (Table 1) and bathymetric data for each site. The parameter dc was computed using the formula dc = 6.75 Hs, where Hs is the mean annual significant wave height (Sorensen 2006). The parameter db was computed using the formula db = Hb/γb, where 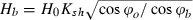 (Ksh = shoaling coefficient; ϕo and ϕb = offshore and nearshore waves approach angle) and
 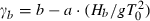 , a and b being empirical coefficients depending on the slope of the beach (Smith 2003).
Posidonia oceanica meadows
The state of the upper limit of the meadows was assessed by SCUBA diving. In each meadow, two sites (A and B) were randomly selected at least 100 m apart; at each site, six stations were located: station 1 before the breaking depth (db) (Smith 2003); station 2 at the observed upper limit; stations 3, 4 and 5 regularly spaced between the upper limit and the closure depth (dc) (Stauble et al. 1993); and station 6 beyond the closure depth, which did not exceed 12 m in this study.
In each station, two descriptors of the Posidonia oceanica meadow structure were measured: (i) percentage of bottom covered by living P. oceanica and dead matte, estimated visually by two divers independently swimming 3 m above the bottom and on a seabed surface of about 25 m2 (Montefalcone 2009); (ii) shoot density using a 40 × 40 cm PVC frame in five replicate counts within each station (Buia et al. 2004).
Sediment
At each station, a sediment sample was also collected, using a corer, in the uppermost layer of the sediment (0–5 cm), totalling 48 sediment samples. In each sample, grain size was analysed by dry sifting at ½ϕ intervals (Wentworth 1922); median (ϕ) and mud (<0.063 mm) percentage were determined according to Folk & Ward (1957).
Beach morphodynamic domains
Beach slope, wave breaking height, sediment fall velocity and wave period were used to define the beach morphodynamic domain, i.e. a distinctive type of beach produced by the topography, wave climate and sediment composition (Benedet et al. 2004; Afunso 2005; Jackson et al. 2005; Gómez-Pujol et al. 2007). In particular, the following parameters were computed (Table 2):
| Breaking wave | |||
|---|---|---|---|
| Surging | Plunging | Spilling | |
| Surf similarity ξ | ξ >2 | 0.4 >ξ >2 | ξ <0.4 |
| Morphodynamic beach domain | |||
|---|---|---|---|
| Reflective | Intermediate | Dissipative | |
| Surf scaling ε | ε <2.5 | 2.5 <ε <30 | ε >30 |
| Dean number Ω | Ω <1 | 1 <Ω <6 | Ω >6 |
- 1
Surf similarity: ξ = tanβ(Hb/L0)−1/2
- 2
Surf scaling: ε = aω2/g · tan2β
- 3
Dean number: Ω = Hb/WsT0 where a (breaker amplitude) = H0/2, ω (incident wave radian energy) = 2π/T0, T0 = period, g = acceleration of gravity, β = the slope of the beach in the surf–zone, Ws (sediment fall velocity) = {4/3·gD/CD [ρ/ρ0– 1]}, where D = grain diameter, CD = dimensionless drag coefficient, ρ = density of water, ρ0 =density of the sediment (Jackson et al. 2005).
Three beach morphodynamic domains were thus defined: (i) dissipative (multiple spilling breakers, relatively large waves, low reflectivity of waves, flat topography, finer-grained sediments); (ii) intermediate (plunging to spilling breakers, cellular circulation with rip currents, high variable shoreline position, medium to fine sand); (iii) reflective (surging breakers, small wave height, constant wave reflection, steep profile, low sediment transport, medium to coarse sand) (Benedet et al. 2004; Gómez-Pujol et al. 2007).
For each morphodynamic domain identified, eight measures of depth and distance of the meadow upper limit from the shoreline were obtained from the bathymetric maps and aerial photographs taken by Regione Liguria in 2003 (scale 1:10,000; flight quote 1200 m; camera WILD R.C. 30; AEROCOLOR III negative film 2444; focal distance 153.31 mm).
Statistical analyses
Analysis of variance (ANOVA) was used to test whether depth and distance from the shoreline of the upper limit were different in the three morphodynamic domains. The model of both analyses consisted of one factor (morphodynamic domain) with three fixed levels (reflective, intermediate, dissipative) with n = 8 observations for each level. Prior to analysis, data were log-transformed to assure homogeneity of variances (Cochran’s test). When significant, differences between levels were explored using the Student–Newman–Keuls (SNK) test.
A reduced number of variables were submitted to factor analysis (PCA extraction method; De Falco et al. 2000). Compound parameters (surf similarity, Dean number) were excluded to avoid redundancy of information, whereas the following seven were selected: surf scaling, distance of the stations from the closure depth and from the breaking limit, sediment median grain size, mud percentage, living Posidonia oceanica cover, and shoot density (Table 3).
| Variables | Units | Data source |
|---|---|---|
| Surf scaling (ε) | Index | Bathymetric maps, waves values |
| Δ breaking | m | Bathymetric maps, SCUBA surveys |
| Δ closure | m | Bathymetric maps, SCUBA surveys |
| Mud | % | SCUBA sampling |
| Median | ϕ | SCUBA sampling |
| Living P. oceanica cover | % | SCUBA survey |
| P. oceanica density | shoot·m−2 | SCUBA survey |
Results
Both Imperia and Ceriale were characterized by a dissipative morphodynamic domain over the whole area (Table 4). In contrast, the two Eastern Riviera areas exhibited distinct domains at individual sites, mostly due to the different morphology of the beach profiles (Fig. 2): at Prelo, site A was intermediate and site B reflective; the opposite was the case for Monterosso al Mare.
| Areas Site | Imperia | Ceriale | Prelo | Monterosso al Mare | ||||
|---|---|---|---|---|---|---|---|---|
| A | B | A | B | A | B | A | B | |
| Surf scaling (ε) | 36.5 | 41.6 | 337.9 | 341.2 | 13.5 | 1.7 | 1.3 | 14.5 |
| Surf similarity (ξ) | 0.38 | 0.27 | 0.09 | 0.08 | 0.69 | 2.13 | 2.1 | 0.47 |
| Dean number (Ω) | 7.4 | 8.2 | 16.1 | 18.2 | 1.58 | 0.61 | 0.39 | 1.4 |
| Domain | Dissipative | Dissipative | Dissipative | Dissipative | Intermediate | Reflective | Reflective | Intermediate |
| Distance (m) | 247.25 ± 9.1 | 251.3 ± 8.6 | 340.2 ± 3.1 | 354.5 ± 5.6 | 21.24 ± 1.5 | 9.7 ± 1.3 | 33.1 ± 2.1 | 63.35 ± 3.7 |
| Depth (m) | 6.6 ± 0.1 | 6.8 ± 0.2 | 6.4 ± 0.1 | 5.9 ± 0.2 | 1.8 ± 0.3 | 0.4 | 7.1 ± 0.2 | 4.5 ± 0.3 |
| d c (m) | 7.0 | 7.0 | 7.0 | 7.0 | 5.0 | 5.0 | 9.0 | 9.0 |
| d b (m) | 4.5 | 4.5 | 2.7 | 2.7 | 2.3 | 3.0 | 4.2 | 5.0 |

Submerged beach profiles in the two sites (A and B) of the four study areas: Imperia, Ceriale, Prelo and Monterosso al Mare.
The position of the upper limit of Posidonia oceanica meadows in the three domains was significantly different (ANOVA, F2,23 = 53.61; P <0.001) when expressed in terms of distance from the shoreline, but not in terms of depth (Fig. 3).

Mean values (± SE) of the distance (a) and depth (b) of the meadow upper limit in the three morphodynamic domains: reflective (R), intermediate (I) and dissipative (D). **P <0.01, *P <0.05, n.s. = not significant.
PCA (principal components analysis) on the seven selected variables extracted two factors, together explaining 75.5% of the total variance (Table 5). Factor 1 (45.9% of the variance) is largely controlled by the structural descriptors of the meadow and the position of the stations along the beach profile. Values of P. oceanica cover and density increased towards the closure depth and decreased towards the breaking limit (Fig. 4). Factor 2 (29.6% of the variance) was controlled by mud percentage and surf scaling. The highest proportion of mud and the highest surf scaling occurred at Ceriale (Table 6).
| Variable | Factor 1 | Factor 2 |
|---|---|---|
| Surf scaling (ε) | −0.06 | −0.86 |
| Δ breaking | 0.86 | −0.41 |
| Δ closure | 0.80 | −0.04 |
| Median | 0.05 | −0.30 |
| Mud percentage | 0.13 | −0.92 |
| Meadow cover | 0.92 | 0.14 |
| Meadow density | 0.91 | 0.18 |

Mean values (± SE) of living Posidonia oceanica cover and shoot density in the two sites (A and B) of each study area: Imperia, Ceriale, Prelo and Monterosso al Mare.
| Station | ϕ | % | Station | ϕ | % | Station | ϕ | % | Station | ϕ | % |
|---|---|---|---|---|---|---|---|---|---|---|---|
| IA1 | −0.26 | 3.00 | CA1 | 2.64 | 2.06 | PA1 | 1.69 | 1.63 | MA1 | −7.00 | 0.00 |
| IA2 | 3.18 | 2.50 | CA2 | 3.24 | 15.29 | PA2 | 1.51 | 0.65 | MA2 | −7.00 | 0.00 |
| IA3 | 3.18 | 2.50 | CA3 | 3.20 | 15.29 | PA3 | 1.09 | 0.37 | MA3 | 0.74 | 0.50 |
| IA4 | 2.47 | 2.40 | CA4 | 3.76 | 18.23 | PA4 | 1.18 | 2.81 | MA4 | 0.51 | 0.20 |
| IA5 | 2.74 | 0.02 | CA5 | 3.66 | 12.12 | PA5 | 0.64 | 1.80 | MA5 | 0.74 | 0.90 |
| IA6 | 3.48 | 2.40 | CA6 | 4.60 | 11.60 | PA6 | −0.25 | 2.87 | MA6 | 1.00 | 0.50 |
| IB1 | −0.68 | 3.00 | CB1 | 2.74 | 1.95 | PB1 | 0.89 | 0.43 | MB1 | 2.18 | 1.69 |
| IB2 | 0.78 | 0.10 | CB2 | 3.06 | 7.10 | PB2 | 0.79 | 0.43 | MB2 | 2.47 | 1.53 |
| IB3 | 0.51 | 0.18 | CB3 | 3.06 | 8.80 | PB3 | −0.29 | 3.34 | MB3 | 1.20 | 1.36 |
| IB4 | 0.67 | 0.20 | CB4 | 3.15 | 7.96 | PB4 | −0.23 | 1.52 | MB4 | −0.80 | 1.90 |
| IB5 | 0.58 | 0.90 | CB5 | 3.40 | 9.10 | PB5 | −0.19 | 2.87 | MB5 | −0.31 | 1.70 |
| IB6 | 2.47 | 0.7 | CB6 | 4.40 | 9.07 | PB6 | −0.11 | 3.20 | MB6 | −0.38 | 3.01 |
In the scoreplot of the two factors, the six stations of each site are in order along the first axis according to their position down the beach profile; stations 1 (shallower than the breaking limit) cluster to the left, stations 2–5 (between the breaking limit and the closure depth) lie in the central section and station 6 (deeper than the closure depth) to the right (Fig. 5). Along the second axis, the morphodynamics and the grain size play a major role in dividing the Ceriale stations from those of the other areas.

Scoreplot of factor 2 versus factor 1. Labels indicate the study area (C = Ceriale, I = Imperia, M = Monterosso al Mare, P = Prelo), the site (A or B) and the station (1 to 6). db = breaking depth; dc = closure depth.
Discussion
Three distinct zones can be recognized within the Posidonia oceanica meadows down the profile of the submerged beach (Fig. 6): zone a, between the shoreline and the breaking depth, where only dead matte is occasionally found; zone b, between the breaking depth and the closure depth, where meadows often are in poor condition, with reduced cover of living P. oceanica, low density and constant occurrence of dead matte; zone c, beyond the closure depth, where meadows flourish. This zonation occurred in all the sites investigated but the boundaries and extent of the three zones shifted according to the morphodynamics of the beach: zones were narrower and closer to the shoreline in reflective domains, and became larger, with the upper limit moving away from the shore, as the domain became more dissipative. Prelo and Monterosso al Mare, where two distinct morphodynamic domains were found within the same area, offer a striking example of this pattern, as the upper limit in the reflective sites is closer to the shoreline than in the intermediate sites.

Zonation of the submerged beach profile and state of Posidonia oceanica meadow in the three dynamic zones (a, b, c) recognized.
Previous attempts (Infantes et al. 2009) correlated wave energy and the upper limit of the P. oceanica meadow. Our study, which also took into account sedimentological parameters, showed that coastal dynamics is correlated not only with the position of the P. oceanica meadow upper limit but also with the health of its shallow portions. At depths shallower than the breaking depth (zone a), wave energy is a severe limiting factor for P. oceanica growth and survival: the sporadic occurrence of dead mattes suggests that colonization may happen during periods of calm sea. Matte will form if these conditions persist for periods of time compatible with the slow growing rate of P. oceanica, i.e. 1–7 cm·year−1 (Capiomont et al. 1996), and dead matte is then capable of remaining for decades (Leriche et al. 2004). However, development of a meadow is unlikely in the long-term.
Between the breaking depth and the closure depth (zone b), the meadow exhibits stunted development. The dead matte patches might be the result of frequent disturbance and natural environmental harshness (Boudouresque et al. 2006), as well as of pressures resulting from human activities, such as beach filling and coastal development. Land reclamation, for instance, typically implies a shift of the shoreline (Meinesz et al. 1991), thus changing the underwater beach profile and, consequently, the position of the breaking depth. This would cause the meadow upper limit to move toward the open sea. In Liguria, poor conditions of P. oceanica meadows in this zone have traditionally been attributed to anthropogenic impacts (Montefalcone et al. 2009), but our results clearly indicate that changes in natural factors, and especially wave climate, are also implicated. Distinguishing between climate and human-induced alterations of marine ecosystems is often difficult (Morri & Bianchi 2001).
Beyond the closure depth (zone c), hydrodynamic conditions have little influence on the state of health of the meadow, so that humans should bear the major responsibility for meadow degradation observed in this zone. However, other natural factors may cause regression in this zone, such as water turbidity, temperature fluctuations or increase in grazing pressure. This has important consequences for coastal zone management, as the evolution of the upper limit of P. oceanica meadows is part of current protocols for monitoring activities (Boudouresque et al. 2000). Field measurements should prioritize this zone, just beyond the closure depth, rather than the absolute shallowest occurrence toward the shoreline. The results of our paper represent a first step towards the prediction of the meadow characteristics on the basis of the local dynamic conditions of a coastal area and confirm that a multidisciplinary approach is essential for ecological modelling (Infantes et al. 2009) and for correct management of priority habitat.
Acknowledgements
The authors are pleased to acknowledge Roberta Lasagna (Genoa) for precious help in the Prelo cove meadow and Alberto Demergasso (Genoa) for the technical support during all the field and laboratory activities.