Evaluation of anatomical characters and the question of hybridization with domestic cats in the wildcat population of Thuringia, Germany
Abstract
Germany’s large population of wildcats (Felis silvestris silvestris) can be clearly distinguished from domestic cats on the basis of morphological characters. However, an examination of 71 specimens from Thuringia also illustrates the risks involved in using only a few such characters. The most reliable tool for identification in the field are three pelage characters (distinctness of tail bands, stripes on the nape and stripes on the shoulder). Only two morphological characters (intestine length and cranial volume) are unambiguous and demonstrate no overlap in distribution between domestic cats and wildcats. A linear discriminant analysis with forward selection of variables showed that only five skull variables are necessary to distinguish all four groups (subspecies × sex). Additionally, the high degree of correlation between most of the 49 variables examined (as indicated by Pearson’s r correlation matrix) speaks against the utility of measuring such high numbers of characters in the future. Principal component analysis (PCA) enabled the subspecies to be separated clearly. The first PCA axis was highly correlated with variables characterizing overall body size, thus separating male and female into wildcats and domestic cats. Even when the chief differentiating characters are missing, the PCA still resulted in a good separation of subspecies. None of the genetically determined hybrids could have been deciphered unambiguously using the morphological characters still intact after a road death. Hybridization seems to occur whenever wildcats change their ecological function and become field cats. The impulse to hybridize seems to come much more from the wildcat side than the side of feral cats, and deforestation represents the major threat to the wildcat.
Introduction
The long discussion surrounding subspecies of Felis silvestris and the existence of a ‘pure’ European wildcat culminated in the question posed by Daniels and Corbett (2003): ‘when is a wildcat a wild cat?’. The authors argue that ‘protection should move away from efforts to affect a definition based on type, accepting that extensive introgression has already occurred’ (p. 216) given that ‘in Scotland the collection and classification of the type specimen for the wildcat took place in 1904, at least 2000 years after the two forms (wildcat and domestic cat) had been in sympatry’ (p. 213). Their principal idea is that a species concept based purely on typology and morphology should be abandoned in favour of a functional definition in the future protection of wildcats. Because Daniels and Corbett do not limit their suggestion to the local Scottish population, their underlying observation on the high degree of hybridization of the wildcat population needs to be tested elsewhere before their radical recommendation can be accepted, particularly in light of its far reaching consequences given the large amount of resources being invested in the protection of the European wildcat. In other words, can future conservation efforts legitimately be based on a functional species definition.
Recent results from Driscoll et al. (2007) shed new light on a long-standing discussion concerning splitting events within F. silvestris. The species first occurred in Europe at least 350 000–450 000 years ago (Garcia et al. 1997), and split into the European forest wildcat and the African/Asian steppe wildcat lineage around 200 000 years ago (Heptner and Sludskii 1972; Yamaguchi et al. 2004a). The exact timing of these splitting events is contested, Randi and Ragni (1991) proposing on the basis of allozyme electrophoresis data that they took place as recently as 50 000 or 20 000 years ago, respectively. Yamaguchi et al. (2004a) dated the split between F. silvestris silvestris and F. silvestris lybica to 50 000 years ago as the wildcat spread from Europe to Asia and later to Africa. Driscoll et al. (2007) has made clear using a molecular clock approach that the African and Asian wildcats including the domestic cat form a strongly supported clade which diverged from the European wildcat between 173.000 and 230.00 years ago. The last common ancestor of the F. silvestris lybica/F. silvestris ornata clade and hence of domestic cats lived between 107 000 and 155 000 years ago. The domestication of the cat probably took place several times as is illustrated by the presence of five matrilineal mitochondrial DNA lineages in modern domestic cats. However, the dating method in Driscoll et al. failed to reveal a plausibly hypothesized age for cat domestication.
The prevailing hypothesis that the first domestication of the cat occurred in Egypt between 3000 and 1600 bc (e.g. Kratochvil and Kratochvil 1976; Kitchener 1991) was falsified by the discovery of cats introduced to Cyprus by Neolithic settlers as early as 7300–7200 years bc (Vigne et al. 2004). The domestic cat came to France (Lepetz and Yvinec 2002) and the British Isles (Grant 1984) with the Romans, but it has only been abundant in larger parts of Europe since 400–500 ad. We are not aware of any published references concerning the introduction of domestic cats to Germany as it is recognized today.
Our current knowledge of the hybridization of the wildcat and the domestic cat in Europe is based on a number of morphological and molecular studies (Beaumont et al. 2001; Daniels et al. 1998; Daniels and Corbett 2003; Eckert 2003; French et al. 1988; Hertwig et al., 2009, this volume; Hubbard et al. 1992; Kitchener et al. 2005; Lecis et al. 2006; MacDonald et al. 2004; Oliveira et al. 2008; Parent 1974; Pierpaoli et al. 2003; Stahl and Artois 1994). Because numerous morphological characters or combinations thereof are also used to pre-classify samples in genetic studies (e.g. Randi et al. 2001; Pierpaoli et al. 2003), they are an important tool for future studies. Guidelines for selecting morphological characters are provided by the exemplary study by Daniels et al. (1998), in which 26 pelage variables (n = 187), intestine length (ITL, n = 57), limb bone variables (n = 53), and 43 variables from 51 skulls of 333 cats from Scotland were measured. The authors’ principal result was that neither pelage nor cranial variables alone were useful in identifying wildcats, hybrids and domestic cats with certainty. By contrast, Ragni and Possenti (1996) have shown that it is possible to differentiate domestic cats and European wildcats reliably using only pelage variables. Puzachenko (2002) investigated differences between European and African wildcats on the basis of 42 cranial characters, 11 of which he indicated to be both discriminative and to have low intragroup variability. Yamaguchi et al. (2004b) used 31 measurements of the skull and mandible and five derived indices to identify possible differences in the three recent subspecies of F. silvestris. Most recently, Kitchener et al. (2005) studied 20 pelage variables in 135 specimens of ‘presumed wild-living cats from Scotland’ in various collections ‘to develop and test a reliable definition of the Scottish wildcat’.
The morphological identification of individuals with hybrid origin, however, remains difficult because of the long-term sympatry and interbreeding of domestic cats and wildcats and is usually based on the presence of a mixture of characters assumed to be typical for both forms. In most studies, characters are claimed to be intermediate or indicative without knowledge of their variability, first within the subspecies and then between wildcats and domestic cats. However, the practice of classifying as hybrids all those individuals whose characters are not unambiguously identifiable as either wildcat or domestic cat (e.g. Kock and Altmann 1999) is flawed from the start. Characters that do not clearly separate wildcats from domestic cats should be excluded from the analysis because they do not represent a basis on which to declare a specimen a hybrid: overlapping character states do not equal ‘overlapping subspecies’. And as there are no diagnostic, non-overlapping characters which identify hybrids, differential diagnosis is necessary.
Although a number of previous studies have shown a good level of concordance between the outcomes of morphological and genetic methods of identifying domestic cats and wild cats, no evaluation of the morphological characters used has taken place (Randi et al. 2001; Pierpaoli et al. 2003). The aim of this study, therefore, is, through a comparison with the results of our parallel molecular study (Hertwig et al.), to identify the diagnostic value of anatomical characters on the basis of the Thuringian wildcat population (Görner 2000; Klaus 1993). A total of 49 morphometric traits were measured, including 40 skull traits (36 direct measurements and four indices), seven limb skeleton variables, body weight and ITL. Using a range of statistical methods, we aim to provide a reliable, practical diagnostic method based on the lowest possible number of characters, and to provide secondary criteria for those cases where key characters (e.g. ITL) are missing. Our complementary approach has the additional advantage to provide the basis to reduce the measuring effort necessary to distinguish domestic cats from wildcats with special regard to age-related changes and sexual dimorphism in subsequent studies. Finally, we discuss whether or not the Thuringian and German wildcat populations are threatened by crossbreeding with domestic cats, and explore the potential causes of hybridization.
Materials and Methods
Specimens and measurements
Morphological examinations were conducted on the 58 specimens from Thuringia in the collections of the Phyletisches Museum Jena (Appendix S1, Fig. 1), the central collecting institution for wildcats in Thuringia. We feel confident that this number is sufficient given that Ragni and Possenti (1996) showed growth curves of number of phenotypes versus sample size that approximate an asymptotic form in wildcats starting from about 12 specimens.
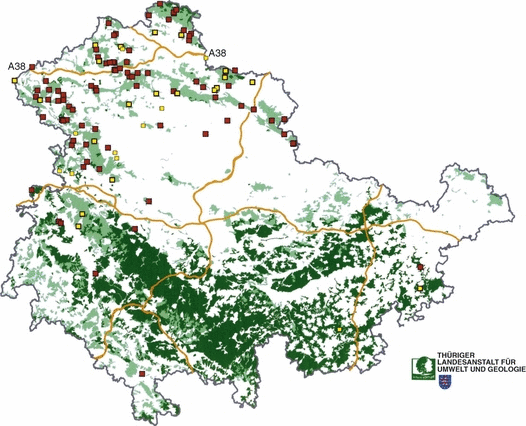
Map of the Free State of Thuringia showing the distribution of dead wildcats (Felis silvestris) as of May 2006. Courtesy of Thüringer Landesanstalt für Umwelt und Geologie
Depending on the condition of the carcasses, we tested a suite of 40 cranial, eight skeletal, 20 pelage characters, and ITL as well as body weight suggested by previous authors (see above) to distinguish between wildcats and domestic cats (Table 1). Pelage characters were not included in the statistical analysis.
All measurements were taken by M.K., with pelage characteristics identified by M.K. and M.S.F. Intestinal length from the pyloric to anal sphincters was measured to the nearest millimetre by Müller (2005), who also checked the pigmentation of the palate. Weight (to the nearest 10 g) was recorded, and total length and tail length were measured (to the nearest mm) as far as the condition of carcasses allowed. Cranial measurements were taken to the nearest 0.5 mm in accordance with previous authors (Driesch 1976; French et al. 1988; Piechocki 1990; Yamaguchi et al. 2004b; Kitchener et al. 2005 and others). Cranial volume (CRV) was estimated using mustard-seed grains (2–3 mm). Age was estimated by counting the cementum layers of the upper canine and/or by epiphyseal ossification following Piechocki and Stiefel (1988).
Elementary statistics
The measurements within each population and between wildcats and domestic cats were evaluated using the coefficient of variation (CV) and the coefficient of difference (CD) (Mayr et al. 1953). CV is calculated as CV = (SD/M) × 100%, expressing the standard deviation (SD) as a percentage of the mean (M). According to Mayr et al. (1953), ‘CV is particularly useful when comparable samples of the same species from different localities are investigated’ (p. 135). CD is obtained by dividing the absolute difference between the means by the sum of both SD: CDBA = |MB – MA|/(SDA + SDB) and measures, roughly speaking, the degree of separation between two distributions. The error of misclassification between the two groups A and B is 10% for CDBA = 1.28, 5% for CDBA = 1.64 and 1% for CDBA = 2.33 (exact values for the special case of equal standard deviations SDA = SDB).
Statistical analyses
All statistical analysis was carried out using aabel 2.3(Gigawiz Co., Houston, TX, USA, 2007), jmp 6 (SAS Co., Cary, NC, USA, 2006), pc-ord and spss 15 (SPSS Co., Chicago, IL, USA, 2006). A nominal alpha value of 0.05 was assumed for all tests. It was not possible to measure all traits in all individuals. To incorporate as much of the available information as possible into the statistical analysis, missing traits were estimated on the basis of the group median within the same subspecies and sex group (the median was chosen to avoid any influence of extremes). Individuals with more than six missing traits were then excluded from the analysis, leaving 46 individuals with 2254 entries in total, 4.5% of them represented by a median. However, CRV [and therefore, cranial index (CRI) in accordance with Schauenberg] was not available for 16 specimens and ITL was not available for 11 specimens. Therefore, a subgroup of 30 cats for which data was available on 42–49 traits (with only 2.6% estimated as median values) was used for the main analysis, while the whole sample of 46 individuals was only examined for 42–46 traits (i.e. excluding CRV, CRI and ITL), to test which other variables might be important for classification.
The correlation matrix of Pearson’s r coefficients was displayed as a heatmap to check which variables are highly correlated and could, therefore, be partially omitted for future measurements. A principal component analysis (PCA) was performed both for the set of 42–49 variables and for the subset of 33–40 skull variables to obtain an overview of how the four target groups (wild/domestic × male/female) could be separated in a low-dimensional projection.
On the basis of these four pre-defined groups, a linear discriminant analysis with forward selection was performed to determine which variables (and in which order) are necessary for accurate classification. The quality of this discrimination was tested by a jackknife procedure.
Results
Evaluation of single characters
Comments on specific characters are provided elsewhere for the sake of simplicity and minimum redundancy.
Pelage characters
We tested all 20 pelage characters discussed in Kitchener et al. (2005), of which the following were considered by the authors to be valuable in wildcat identification (numbering according to the table in which they appear):
(7) Extent of dorsal line
(8) Shape of tail tip
(10) Distinctness of tail bands
(15) Broken stripes on flanks and hindquarters
(17) Spots on flanks and hindquarters
(18) Stripes on nape
(19) Stripes on shoulder.
Characters 15 and 17 were of no indicative value in our sample. The dorsal line stops at the base of the tail (#7) in 20 wildcat specimens, and continues on to the tail in five. The tail tip (#8) is blunt in all wildcat specimens, but also in a few domestic cats. Tail bands (#10) are distinct in all wildcat specimens (Fig. 2). In three cases, however, we observed double bands that did not encircle the whole tail. Four to five stripes on the nape (#18) and stripes on the shoulder (#19) are also distinguishing features for wildcats (Fig. 3). In the Italian sample, the dorsal line (#22 in Ragni and Possenti 1996) was valuable, but not the tail bands. Our sample is also different in that the gular areola is variable in wildcats. The only character on which all studies agree are the 4–5 stripes on the nape.
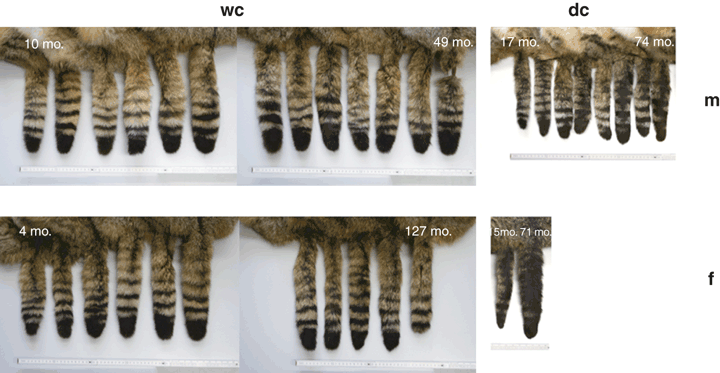
Tail patterning of Thuringian wildcats arranged in ascending age from left to right. Tails of domestic cats of one and seven years of age are shown for comparison
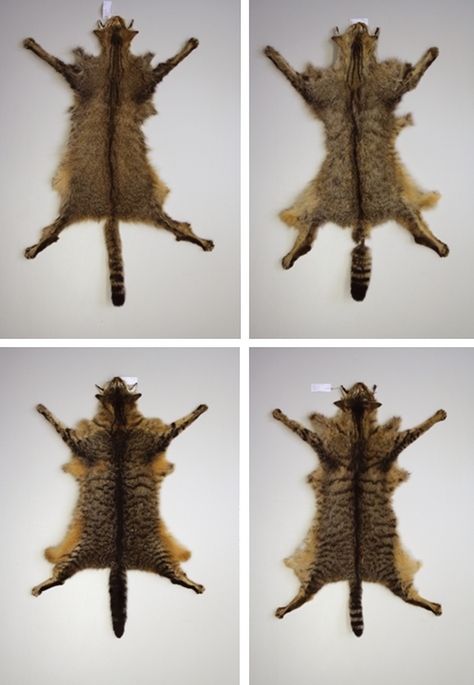
Coat patterning of Thuringian wildcats. Top left: male wildcat, 49 months old, Toba/Helbetal 07.06.1996; top right: female wildcat, 75 months old, Weberstedt 29.08.1996. Bottom left: male domestic cat, 71 months old, Allmenhausen 14.04.2004. Bottom right: female domestic cat, 71 months old, Ebenau/Creutzburg 29.04.1998
An additional character not mentioned by Kitchener et al. (2005) is the colouring of the hind paw (Schwangart 1943). However, Piechocki (1990) doubted the utility of this trait and our sample shows variable paw colouring of the populations.
Metric characters
Coefficient of difference and coefficient of variance
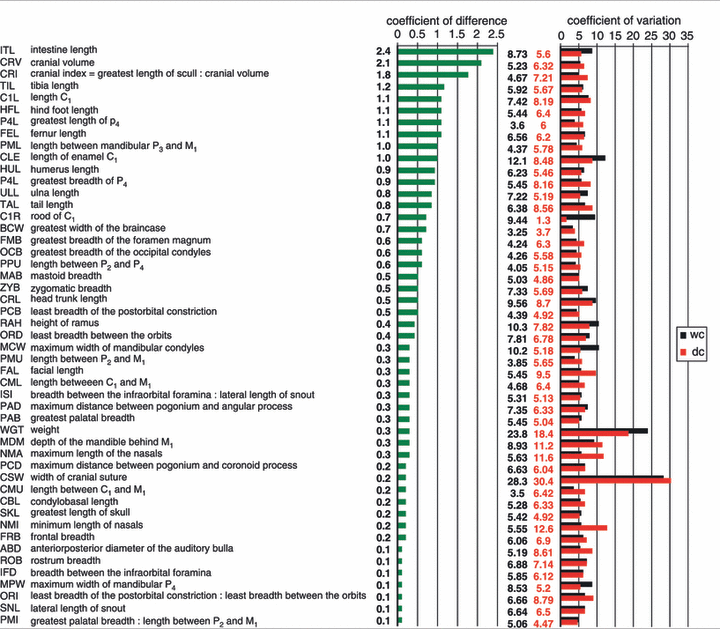
Table 1 presents all characters in descending order according to CD and also gives CV values. With regard to length-related traits, CV usually varies between four and 10 in mammals, as in our sample. The few characters outside this range [width of cranial suture (CSW), body weight] are age-related characters. CV is also a sensitive indicator of homogeneity of samples and suggests that our sample is indeed homogenous. The CD of only two chief differentiating characters (ITL and CRV) and one ratio (CRI) exceed the critical value of 1.28 considered by Mayr et al. (1953) to correspond to the 90% standard of subspecific difference. There is no overlap in the distributions of ITL and CRV between the populations.
As in previous samples (Schauenberg 1977; Piechocki 1990), ITL is the most reliable character in differentiating wildcats and domestic cats (CD = 2.4). The clear gap between ITL distributions in our samples is even wider than previously observed (Braunschweig 1963). The intestine of the domestic cat is more than 40% longer than that of the wildcat (mean 2080 mm, SD 111 mm to mean 1440 mm, SD 126 mm). The longest wildcat intestine (1680 mm) was still considerably shorter than the shortest one of a domestic cat (1880 mm).
Body mass (WGT) is clearly gender-specific but is of no other diagnostic value (CD 0.29) because it varies so much within each sex (e.g. two males of equal head trunk length displayed a 31% difference in body weight). It also depends on many external factors which change daily. The validity of head trunk length (CRL) is limited by the lack of a standard measuring procedure for the nuchal curvature. Additionally, measurements are affected by the condition of the carcasses. Finally, there is an overlap of 58% between CRL distribution in wildcats and domestic cats, and a CD of only 0.48. Almost the same is true for tail length (TAL) with an overlap of 35% (CD 0.84). Tail length is shorter than 50% of CRL in only three specimens. The tail of wildcats is 5% longer on average than that of domestic cats (male wildcat 57%, male domestic cat 52%, female wildcat 61%, female domestic cat 56%). Hind foot length (HFL) is only diagnostic when specimens show extreme values. Lengths higher than 130 mm are definitely wildcats, lower than 115 mm domestic cats. Although Kratochvil (1976a) and Piechocki (1990) accepted this character as highly significant, we found a 39.5% overlap between the groups in our sample. Still, its CD value of 1.1 indicates HFL to be the fifth most diagnostic character.
Although we lack the necessary specimen numbers to discuss postcranial characters in depth, some trends can be identified. Femur (FIL) and tibia (TIL) length are diagnostic only when they are plotted in age and sex classes. Wildcats display femur length above 130 mm for subadult and adult males and 120 for subadult and adult females, whereas domestic males range below 111 mm. TIL is 135 and 125 mm for male and female wildcats, respectively. The CD for TIL is very close to the critical value of 1.28, and the character ranks third. The tibia of the Scottish wildcat is more than 10% shorter than that of the individuals in this study (Daniels et al. 1998).
Cranial characters
We restrict our specific comments here to the cranial characters that are most informative and most often used. The taxonomic value of the other, less frequently used traits can be inferred from Table 1.
The greatest length of the skull (SKL) and the condylobasal length (CBL) have no taxonomic significance because their distributions overlap by 67% (CD 0.22) and 57% (CD 0.23), respectively. There is also high sexual dimorphism in both characters as male specimens are always significantly larger than females in the both the wildcat and the domestic cat.
CRV consistently separated the two groups in our sample (CD 2.1). Wildcats always exceed 34 cm3 (mean 37.3 cm3, SD 1.9 cm3) in contrast to domestic cats (mean 29.3 cm3, SD 1.8 cm3). Schauenberg (1969) and Piechocki (1990) even measured a slightly higher minimum value of 35 cm3 for the wildcat. A gap of 13.8% separates the two groups.
The oft-used CRI (greatest length : CRV), while apparently diagnostic, is less reliable than pure CRV (CD 1.8). Schauenberg (1969), who introduced this index, stated that it is always greater than 2.75 in domestic cats and below this in wildcats. However, the maximum value reached by one of the wildcats in our sample was 2.73.
Zygomatic breadth (ZYB) has two limitations. First, there is a broad overlap in the range of distributions (56.6%, CD 0.49) and second, this factor is strongly age-related (Fig. 4).
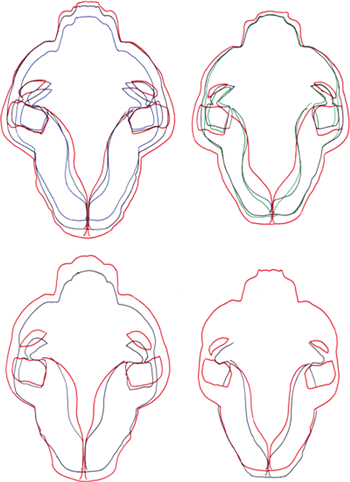
Dorsal view of the skull contours in wildcats and domestic cats. Top right: male wildcats, top left: female wildcats, bottom right: male domestic cats, bottom left: female domestic cats; green: 0–6 months, blue: 7–10 months, black: 11–24 months, red: <24 months. Dorsal view of the skull contours in male wildcats and domestic cats, right: wildcats, left: domestic cats, blue: 7–10 months, black: 11–24 months, red: <24 months
The lengths of upper and lower tooth rows (C to M1), (CMU and CML), both fail completely to distinguish wildcats from domestic cats (CD 0.24 and 0.34 respectively) because of the extensive overlap in their distributions (72.1% and 89.7% respectively) and also because 20% of the domestic cats we sampled displayed longer tooth rows than wildcats. Our results, with the variable showing 86% overlap (CD 0.34), also contradict the conclusion reached by Puzachenko (2002) that the length of P2 − M1 (PMU) in the upper and lower dentition is a significant diagnostic character. The Thuringian wildcats have almost identical values to the sample of Harz wildcats (Piechocki 1990), while values from the Western Carpathian population are 3% higher (Sládek et al. 1972).
Canine length (C1L), which has only been used by Puzachenko (2002) thus far, represents one of the most diagnostic of the easily accessible characters (CD 1.1), but is still hampered by a 27.5% overlap in population distributions. The canine also has to be taken out of its alveole. One factors which counters these disadvantages is that C1L remains useful even in older specimens because worn enamel crowns are compensated by tooth cement in the apical region of the roots. Neither the length of canine enamel (CLE; 36.4% overlap, CD 1.0) nor that of canine root (C1R; 37.7%, CD 0.73) were as informative as total C1L.
Correlation between traits
Pearson’s r correlation matrix of the 49 characters for the 30 individual set in Table 1 showed both expected and surprising correlations (see Fig. 5). An examination of the Pearson correlation coefficients for all possible pairs of traits reveals that 13 (of 1176) exceed an absolute value of 0.9 (with a maximum of 0.989), with another 83 coefficients having absolute values of between 0.8 and 0.9. However, 49 pairs of variables are essentially uncorrelated, with absolute values of r smaller than 0.1. Among the nine non-skull variables TIL, FEL, ULL and HUL were highly correlated with r exceeding 0.85, while HFL, TAL and CRL had correlation coefficients of around 0.75. Body weight (WGT) was slightly positively correlated, while ITL showed weak negative correlations (and almost no correlation to WGT).
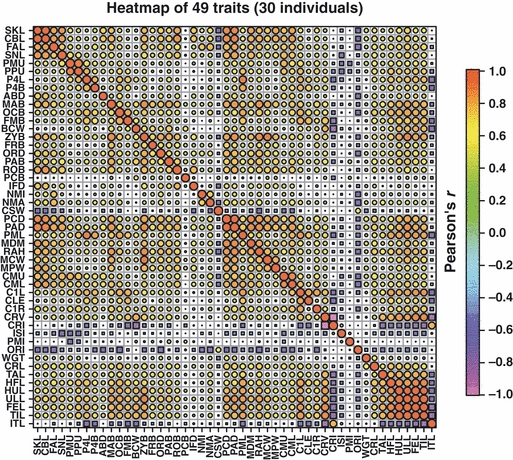
Matrix of Pearson’s pairwise correlation coefficients r, displayed as heatmap for 49 traits from 30 individuals (circles: positive values of r, squares: negative values; size proportional to absolute value)
Among the cranial variables, SKL is identical (0.97) to CBL, and highly correlated (absolute values of r = 0.8–0.9) to each of facial length, lateral length of snout (SNL), rostrum breadth (ROB), distances between pogonium and coronoid or angular process (PCD and PAD), depth of mandible behind M1, maximum width of mandibular P4 (MPW) and length of C1 to M1 (CML). The variability of SKL is due more to size differences in the anterior half of the skull than in the posterior. Additional strong correlations (>0.7) of SKL exists with each of ABD, MAB, ZYB, IFD, RAH, MCW and CMU. Obviously, changes in skull shape are generally size-related in some fashion, albeit with some unexpected non-correlations (e.g. PMI, CRI, PCB, ISI, CLE, BCW and FMB). The high intercorrelation of the characters defining skull shape contradict the alleged disadvantages of size-dependent characters with regard to their low specificity (Reig et al. 2001, p. 130). Contrary to what these authors claim, the same size score in cats is not due to different combinations of shape changes (except for the orbitonasal region; characters 27–30).
The length of the tooth row (C1 – M1) (CMU) correlates strongly with snout length (SNL), as might be expected, and also with each subunit of tooth measurement (e.g. CML, PMU, PPU). CRV, however, does not correlate strongly with any of width of cranial suture, SKL or weight (WGT), but does with several postcranial measurements (TAL, HFL, HUL, ULL, FEL and TIL), tooth characters (PPL, P4L, P4B, C1L, CLE and C1R), and even intestinal length (ITL). No causal functional explanations for these latter correlations are immediately apparent.
All limb measurements correlate almost perfectly (r = 0.85–0.98), meaning that there does not appear to be any need in future studies to measure more than one limb segment. We suggest that the preferred segment should be TIL because it is mostly conserved and easily accessible.
Principal component analysis
A brief look at the two PCA graphs shows that wildcats and domestic cats can be clearly separated, with each group displaying one of the hybrids at its border (Fig. 6a). The sexes do show some overlap within each group, but this appears to be an age-related phenomenon.
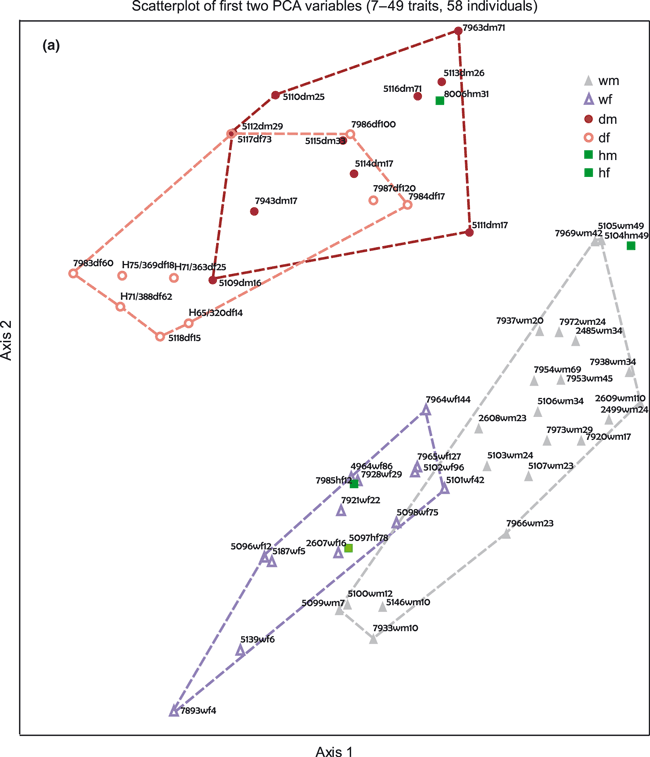

Scatterplot of first two standardized PCA axes PC_1 and PC_2 for all 58 individuals based on all 7–49 traits (a), for 30 individuals based on 42–49 skull traits (b), and for 30 individuals based 33–40 skull traits (c) and for 46 individuals based on 42–46 traits (d), but excluding CRV, CRI and ITL. Outlines correspond to the four groups wild/male, wild/female (grey, violet), domestic/male, and domestic/female (brown, pink). Hybrids are in green. Labelling is ID/ subspecies/sex/age in months
The PCA for the 30 individuals possessing data for all 42–49 characters (Fig. 6b) underlines the highly intercorrelated nature of the characters described previously. The first five axes cumulatively explain 54%, 64%, 71%, 75% and 79% of the total variance. The scatterplot of PCA axes 1 and 2 (hereafter, PC_1 and PC_2) separated both subspecies unambiguously and showed only minor partial overlap between male and female cats within each group. By contrast, scatterplots of PCA axes higher than 2 always showed a distinct overlap between at least two groups (subspecies or sex). Almost the same results were obtained for the subset of only 40 skull variables, with the gap between groups becoming even larger when ITL was included as a 41st character (Fig. 6c).
PC_1 was highly correlated with variables characterizing overall body size. As a result, this axis also tended to separate males and females (because of the slight sexual dimorphism in the species), especially in the wildcat. The highest contributions to PC_1 were made by the skull variables PAD, RAH, PCD, CML, PML, ZYB and MAB, and the non-skull variables ULL, FEL, HUL, TIL and HFL. PC_2 represented a complex cranial shape factor; the highest contributions here were made by CRI, CSW, and CRV, but also by ITL. This axis tended to reflect the quality of the few discriminating traits identified above. The PCA clearly separated the two subspecies, largely because domestic cats showed a substantially higher value on PC_2. Partial overlap between the sexes only occurred for domestic cats and was mainly age-related, with older individuals tending to have larger values for both of the first two PCA axes (see labels in Fig. 6b–d). This seems to be a general phenomenon. Older cats are larger than younger ones, but the shape of their skull also changes. The PCA of skull variables alone gave similar loads, but greatly reduced the contribution of SKL and CBL to PC_1.
Because CRV was not measured in 16 individuals (approximately one third of 46), we used all 46 individuals and replaced the missing trait values (always fewer than six) by the corresponding group median. The PCA analysis for this group, using 42–46 variables but excluding CRV, CRI and ITL, still resulted in a generally clear separation of the subspecies, albeit with a small overlap between them (Fig. 6d). This underlines the fact that CRV (or, to virtually the same degree, CRI) was the most diagnostic cranial variable in terms of separating the two subspecies. On the other hand, using the median of the corresponding group to estimate the missing values for some individuals appears to be an acceptable means (up to a certain proportion of individuals) of avoiding having to throw out otherwise incomplete variables and individuals, and allows the analysis to be based on the most comprehensive data set possible.
Discriminant analysis
Although the first two PCA axes resulted in the best separation of the two subspecies and, to a lesser degree, of the sexes, PCA requires the measurement of 49 variables, which entails both significant effort and the danger of missing data. As a result, we attempted to find smaller subsets of variables that would be sufficient to distinguish between wild and domestic cats and so optimize the cost-benefit ratio. A linear discriminant analysis with forward selection of variables showed that CRV, C1L, CML, MPW and CSW (in this order) were sufficient among the 33–40 skull variables to discriminate all four groups (subspecies × sex) without any classification error (Wilk’s Lambda = 0.010, F = 15.8, p < 0.0001). The canonical plot is given in Fig. 7a. CRV and C1L made the largest contribution to the first canonical axis, with CML being most important for canonical axis 2. When non-skeleton variables were included in the analysis, ITL became the most important variable, with HFL ranking fourth (Fig. 7b; Wilk’s Lambda = 0.0038, F = 24.1, p < 0.0001).
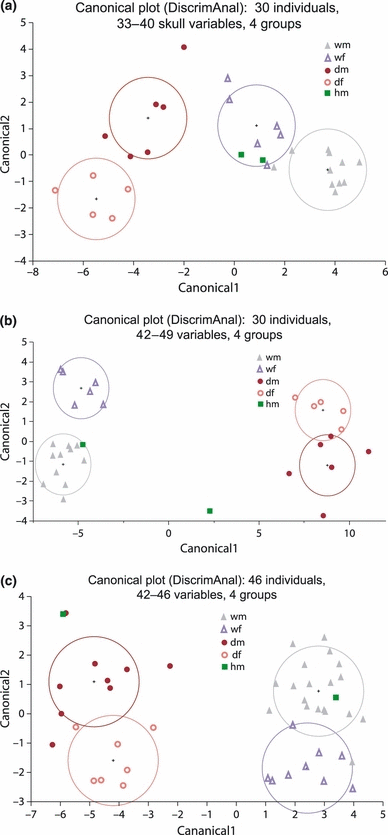
Canonical plot of first two canonical variables for a linear discriminant analysis of four predefined groups (wild/male, wild/female, domestic/male, domestic/female) based on all 33–40 skull traits of 30 individuals (a), on 42–49 traits of 30 individuals (b) and on 42–46 traits, except CRV, CRI and ITL for 46 individuals. Circles correspond to 50% contour lines of a normal distribution of each group
With 42–46 characters, excluding CRV, CRI and ITL, a higher number of variables was needed to achieve sufficient separation between the four groups. In decreasing order of contribution, these were C1L, CSW, TIL, SNL, P4L, ABD and C1R (Wilk’s Lambda = 0.018, F = 17.2, p < 0.0001). Even so, three individuals were still misclassified. If the analysis was restricted to skull variables only (excluding CRV and CRI), the variables needed to achieve good separation were C1L, CSW, P4L, PMU, RAH and ROB (Wilk’s Lambda = 0.037, F = 12.2, p < 0.0001), albeit with four misclassifications (see Fig. 7c).
To distinguish between wild and domestic cats only (i.e. ignoring gender), linear discriminant analysis showed that, among skull variables, CRV alone could classify both subspecies without error (Wilk’s Lambda = 0.189, F = 112, p < 0.0001). If non-skeleton characters were included, ITL performed even better than CRV. In the absence of CRV and CRI, given that values for these traits are often unavailable, C1L, CML, PML were sufficient to discriminate between both subspecies without any misclassifications (Wilk’s Lambda = 0.226, F = 45.7, p < 0.0001), whereas TIL and SKL were necessary for error-free differentiation if non-skull variables were included (and ITL was omitted; Wilk’s Lambda = 0.150, F = 116, p < 0.0001). The importance of the respective variables in the different constellations examined is summarized in Table 2.
| Traits included | % Misclassified |
|---|---|
| 30 Individuals/49 variables | |
| 4 Groups (subsp. × sex) | |
| ITL | 23 |
| C1L | 17 |
| CRI | 10 |
| HFL | 10 |
| CSW | 3 |
| 2 Groups (subspecies) | |
| ITL | 0 |
| HFL | 0 |
| 46 Individuals/46 variables (excluding CRV, CRI, ITL) | |
| 4 Groups (subsp. × sex) | |
| C1L | 22 |
| CSW | 17 |
| TIL | 17 |
| SNL | 13 |
| P4L | 13 |
| ABD | 7 |
| 2 Groups (subspecies) | |
| TIL | 7 |
| SKL | 0 |
| 30 Individuals/40 skull variables | |
| 4 Groups (subsp. × sex) | |
| CRV | 33 |
| C1L | 13 |
| CML | 13 |
| MPW | 7 |
| CSW | 0 |
| 2 Groups (subspecies) | |
| CRV | 0 |
| 46 Individuals/38 skull variables (excluding CRV, CRI, ITL) | |
| 4 Groups (subsp. × sex) | |
| C1L | 22 |
| CSW | 17 |
| P4L | 17 |
| PMU | 15 |
| RAH | 11 |
| ROB | 9 |
| 2 groups (subspecies) | |
| C1L | 4 |
| CML | 9 |
| PML | 0 |
- CRV, cranial volume; ITL, intestine length; C1L, canine length; CRI, cranial index; HFL, hind foot length; CSW, width of cranial suture; TIL, tibia length; SNL, snout length; ABD, anterior posterior diameter of the auditory bulla; SKL, skull length; RAH, height of ramus; P4L, greatest length of P4; ROB, rostrum breadth; MPW, maximum width of mandibular P4; CML, length of lower tooth row.
Identification of hybrids
Morphological identification of the four genetically determined hybrids was rendered difficult by the fact that 14 characters, including the highly diagnostic ones, were missing in one hybrid 7985 (collection number, see Appendix S1). In line with our exclusion of individuals with six or more missing characters, this hybrid is not included in our analyses. CRV and CRI were also unavailable for both of the other two (male) hybrids, and ITL was unavailable for 5104. This lack of the most informative characters rendered the morphologically-based identification of the individuals almost impossible. Unfortunately, a similar lack of data will often be the case for road kills, the most common source of specimens. Nevertheless, our analyses always classified hybrid 8006 as a wildcat, and hybrid 5104 as a wildcat if only skull variables, excluding CRV and CRI, were used, and as a domestic cat otherwise.
To visualize the character state (wildcat, domestic cat, none or both) of each variable in the hybrids, we used a star diagram following Precht et al. (2005) (Fig. 8). Individual 7985 shows the patterning typical of wild coloured domestic cats (Fig. 8), but with 63% of the linear measurements being typical of wildcat, 17% of domestic cat, and 20% being intermediate. The higher-ranking variables for this individual all tended to indicate wildcat affinities. The male hybrids display extremely different character distributions from one another. In terms of coat patterning and 91% of the measured variables, individual 5104 would be unambiguously classified as a wildcat, while genetically it is a clear hybrid. The morphological status of individual 8006 is less decisive: 23% of the variables indicate wildcat-like values, 35% intermediate and 42% domestic cat. This hybrid also more strongly resembles a domestic cat in appearance (Fig. 8). Finally, individual 5097 shows 64% wildcat characters, 16% of intermediate and 20% of domestic cat.
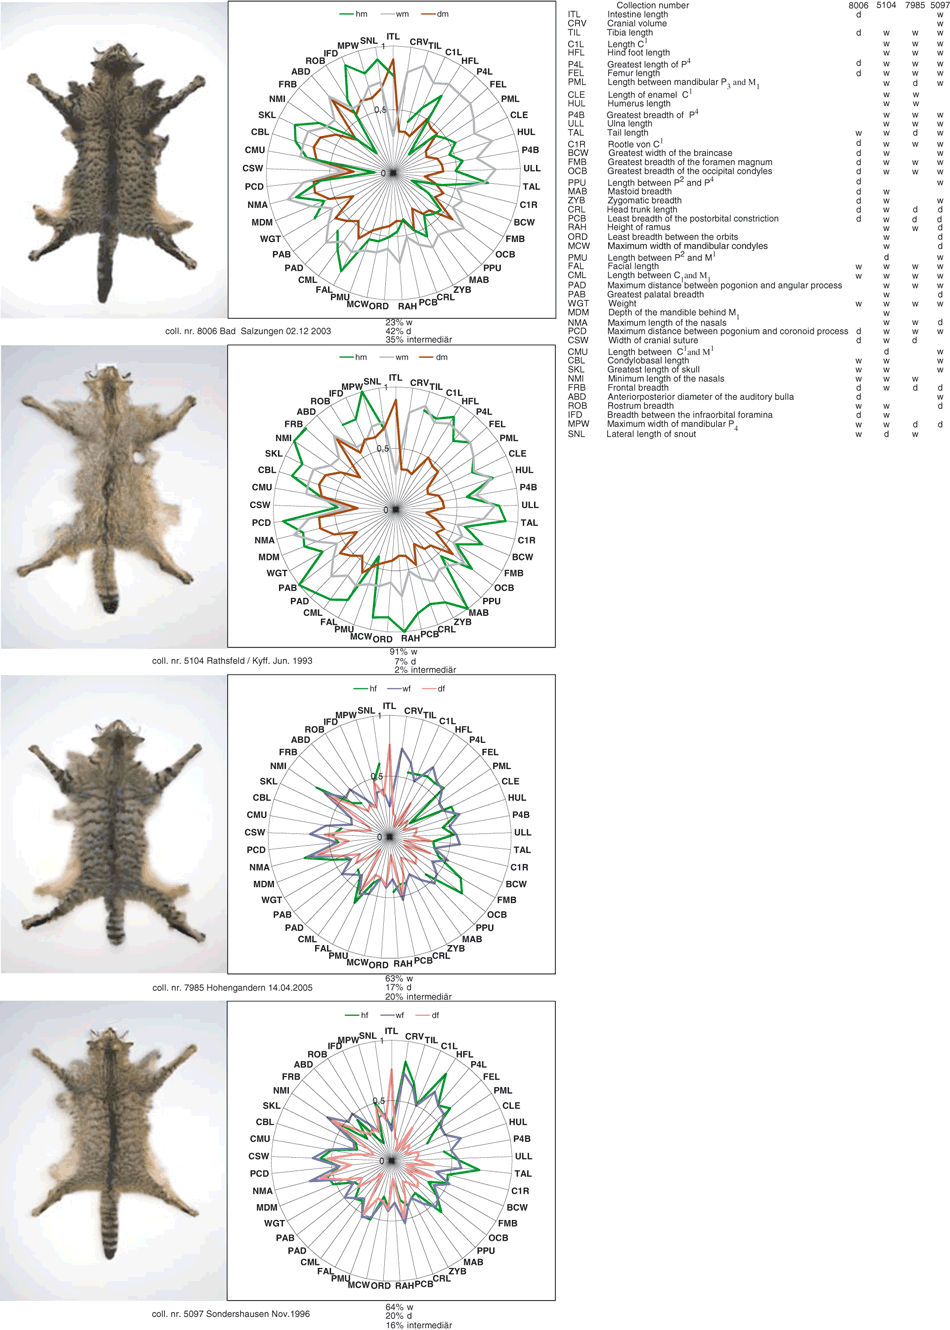
Star diagram following Precht et al. (2005). Genetically identified hybrids are shown in green. For comparison, median values of the appropriate wildcats male (grey) and female (violet), as well as domestic cats male (brown) and female (pink) are presented. Variables are figured clockwise after decreasing coefficients of difference (CD). Measurements are scaled between 0 and 1
Discussion
One of the foci of recent morphological research on wildcats is the undeniable need ‘for a defining characteristic that can be applied reliably by practical people under difficult conditions and before the trigger is pulled or the trap sprung’ (Reig et al. 2001, p. 131). The high degree of introgression of the domestic cat into the Scottish wildcat population has led to different approaches to developing a morphologically based method for identifying the Scottish wildcat, if it still exists (MacDonald et al. 2004). Our complementary approach of independent molecular and morphological analyses enabled us to crosscheck and compare the content of information in the different character sets.
Identification of wildcats
Pelage characters
In addition to the linear measurements discussed below, a set of qualitative pelage characters exists that diagnoses wildcats unambiguously. Three of the 20 pelage characters discussed by Kitchener et al. (2005) were diagnostic in our sample: tail bands (No. 10), 4–5 stripes on the nape (No. 18) and stripes on the shoulder (No. 19). Nuchal stripes are arguably the character of choice, given the work of Ragni and Possenti (1996), who found that the tail bands were more variable in the Italian population and also less pronounced in older specimens, and older males in particular. In our sample, the three pelage characters 10, 18 and 19 match perfectly with the genetically identified wildcat group), and each in isolation can also distinguish wildcats from domestic cats, but not of hybrids. Two of the four hybrids 5104 and 5097 have wildcat and the other two (8006 and 7985) domestic cat pelage characters. Even in the Scottish sample, the absence of one of these characters will definitively identify a domestic cat. If we score these three characters alone according to the scheme presented in Kitchener et al. (2005), a score of >3 will identify a wildcat with certainty. We therefore propose that these three characters be taken as the best means of identifying wildcats in the future, and should prevent the trigger from being pulled – at least under good light and weather conditions.
Biometric characters
In agreement with Schauenberg (1969), we found that only two measurements, ITL and CRV, enable wildcats and domestic cats to be distinguished with absolute certainty. Unfortunately, like many of the other most reliable differentiating characters, these are post mortem characters. Because the maximum length of skull was less robust than CRV in distinguishing the subspecies, the CRI was likewise less reliable than CRV. No other variables than the two measurements and the index possessed a CD score greater than 1.2. The latter phenomenon indicating that the chance of wrongly identifying a random specimen is as high as 11.5%. A CD of 1.8 results in a 3.6% chance and for the CRV (CD = 2, the error is only 1.8%). As such, it is surprising that most of these latter characters continue to be used in recent studies in the light of their enormous variability and inability to reliably assign a subspecies.
Craniometric characters
Postnatal changes in the shape of the skull differ in the wildcat and domestic cat (Fig. 4). The higher CRV of the wildcat is likely due to the more vaulted frontal portion of the skull, where the frontal bone is more in the plane of the skullcap. At the same time, the postorbital processes in the wildcat project almost at right angles to the sagittal plane. Both traits give the wildcat its typical facial expression. In our opinion, this facial difference between the subspecies explains the lack of correlation between the characters associated with overall skull shape (characters 27–30) in the total correlation matrix. The smaller CRV of the domestic cat compared to the domestic cat is often ascribed to the results of domestication. However, this need not be the case, given that comparatively smaller CRV also characterize the subspecies of Felis silvestris native to North Africa (F. silvestris lybica) and South Asia (F. silvestris ornate) (Hemmer 1972). The more parsimonious explanation is that CRV have increased in the wildcat in conjunction with the northern distribution of this form.
Evaluation of characters
A linear discriminant analysis with forward selection of variables showed that CRV together with C1L, CML, MPW, PML and CSW (in this order) was sufficient to discriminate all four groups (subspecies × sex) with no classification errors. As such, correct classification does not require any non-skull skeleton variables. If the non-skeleton variables ITL and WGT were included in the analysis, ITL became the most important variable. In the absence of both CRV and ITL, discrimination becomes extremely difficult. We are convinced that discriminant analysis should precede PCA, and hope that the traits identified in this study will be as reliable in other populations. We also question the use of derived variables (see Yamaguchi et al. 2004a,b) based on largely unassigned variables. Using fewer but more reliable traits results in the unambiguous separation of domestic cat from wildcat. Unfortunately, there do not appear to be any traits that can identify hybrids as such.
We found no correlation between ITL and either body mass or CRL, and therefore cannot support Daniels et al. (1998) in their argument that wildcats are presumably ‘less able to sustain the higher energy costs associated with carrying a longer gut’. Future research in this area should focus on determining whether the length difference over the entire intestine accrues from differences in specific regions of the intestinal tract.
Hybridization of wildcats and domestic cats
The diagnostic value of morphological characters and morphometric data in distinguishing domestic cats from wildcats, and particularly in the difficult task of identifying hybrids, is the subject of intense discussion (Suminski 1962a,b, 1977; Kratochvil and Kratochvil 1970, 1976; Kratochvil 1973, 1975, 1976a,b, 1977; Schauenberg 1977, Ragni and Randi 1986; Puzachenko 1996; Ragni and Possenti 1996; Daniels et al. 1998; Reig et al. 2001; Kitchener et al. 2005). The successful identification of hybrids is intimately linked to the validity of postulated diagnostic characters for the parent taxa. Phenotypically identifying hybrids on the strength of the observation of a set of characteristics halfway between those of wild cats and domestic cats is very likely to be wrong for heuristic reasons. In the light of the broad overlap in the distribution of most biometric characters (Fig. 8) and the heterogeneous distribution of qualitative characters, it is not to pinpoint hybrids on the basis of anatomical characters alone (Kratochvil and Kratochvil 1970, 1976, Kratochvil 1973, 1975, 1976a,b, 1977; Piechocki 1990).
The parallel morphological and genetic analyses of our sample resulted in the correct identification of individuals as wildcats or domestic cats. However, as far as the four individuals genetically identified as potential hybrids were concerned, the picture was less clear. The examination of three hybrids (8006, 5104, 5097) yielded intermediate parameter values, with each specimen displaying also diagnostic characters typical of both wildcats and domestic cats. Morphological characters would especially not allow the recognition of specimen 5104 as a hybrid, because 91% of the characters indicated wildcat affinity. Only one of the genetically identified hybrids (7985) has been identified by morphological traits because it presents a ‘contradiction’ between pelage characters and relevant other characters.
Despite several studies that argue against extensive amalgamation having taken place between wildcats and domesticated cats (Eckert 2003; Fernandez et al. 1992; Hertwig et al. 2009; Kratochvil 1973, 1975, 1976a,b, 1977; Kratochvil and Kratochvil 1970, 1976; Ragni and Randi 1986; Randi et al. 2001; Randi and Ragni 1991; Piechocki 1990; Pierpaoli et al. 2003), there is no doubt that hybridization in Europe has occurred during the extended coexistence of both forms. Ancient hybridization likely caused an introgression of genes from wildcat populations into the domestic cat population and vice versa. However, this relatively rare but probably repeated introgression of alleles, and especially of the maternally inherited mitochondrial genes that can be traced back for a long time (Hertwig et al. 2009; Randi et al. 2001), apparently had no significant influence on the ecological and morphological separation of both sympatric forms of F. silvestris. Cases of historical admixture between the otherwise disjoint genetic lineages could only be detected by the combined use of various genetic markers (Beaumont et al. 2001; Hille et al. 2000; Lecis et al. 2006; Oliveira et al. 2008; Pierpaoli et al. 2003; Vähä and Primmer 2006; Vilà et al. 2003; Wiseman et al. 2000; Yamaguchi et al. 2004a, b) and should be studied more in detail based on the oldest specimens in museum collections. In addition to the traces of repeated past introgression events a certain percentage of hybrids arising from occasional recent interbreeding at most some generations ago seem to exist in all populations of European wildcats, albeit with strong regional variation even within Germany (Hertwig et al. 2009).
The reasons behind the extensive hybridization of F. silvestris with feral cats observed in certain regions of Europe and the continued separation of the two forms in others are the subject of a long-standing and controversial debate (Ragni and Randi 1986; French et al. 1988; Piechocki 1990; Fernandez et al. 1992; Hubbard et al. 1992; McOrist and Kitchener 1994; Beaumont et al. 2001; Randi et al. 2001; Daniels and Corbett 2003; Eckert 2003; Pierpaoli et al. 2003; MacDonald et al. 2004; Biro et al. 2005; Kitchener et al. 2005). In Thuringia, the areas inhabited by F. silvestris silvestris are restricted and isolated from each other by cultivated landscape, but still provide sufficiently structured closed forests to house small, viable wildcat populations. Within the borders of the Hainich Nationalpark in Thuringia, for instance, a population estimated at about 50 specimens favours old forests dominated by Fagus silvatica and adjacent military training areas (T Mölich, personal communication). Studies on the biology of this population, including radio telemetry tracking (Mölich and Klaus 2003), and on populations from other localities (Naidenko and Hupe 2002) showed a low level of overlap between the territories of domestic cats and wildcats because the latter spends most of its time in the forest, in contrast to feral domestic cats. Although a study in northern Switzerland using foto traps could demonstrate that feral cats can intrude far into the forests and come indeed repeatedly into contact with wildcats (D. Weber, personal communication). Our results, however, support rather the hypothesis that the wildcat in Thuringia represents a scattered but distinct population that is clearly separated both morphologically and genetically from domestic cats.
Factors which promote the reproductive interaction of wild cats and free-ranging domestic cats include the small population densities of wildcats compared to free-ranging domestic cats and extensive deforestation which has created a mosaic-like landscape structure dominated by agriculture, settlements and small patches of forest (see Lecis et al. 2006 and Oliveira et al. 2008 for a further discussion). Because these factors also apply to most other European countries, they do not explain the differences observed on a regional scale. The question remains, therefore, of why such a high percentage of feral cats, particularly those in Scotland and Hungary, show ‘admixing genotypes, which probably originated through a protracted process of hybridization and introgression’ (Pierpaoli et al. 2003, p. 2594). Especially the surprising high percentage of hybrids in the western population in Germany and its influence on the morphological and genetic integrity of the wildcat in this region needs further investigation effort.
Comparison of these populations with the situation of the wildcat in Thuringia points to the existence of areas of contiguous and appropriately structured forest as being a crucial factor in hybridization levels. Radical deforestation in Scotland and perhaps also in the native wildcat localities in Hungary has forced the forest cat to become a field cat reliant on the same resources as feral cats. Arguably it is only the loss of its primary ecological niche that causes the wildcat to start to interbreed with feral or even domestic cats. The theory that domestic cats derive from the steppe wildcat lineage (Yamaguchi et al. 2004a) lends force to the idea of ecological separation. The major threat to the European wildcat, then, is the fragmentation of forest and not the diffusion of free-ranging domestic cats (contra Pierpaoli et al. 2003).
Acknowledgements
The authors are grateful to Dr Siegfried Klaus (Thüringer Landesanstalt für Umwelt und Geologie, Jena) for many years of successful cooperation and the reliable provision of carcasses together with the precise locality in which they were found. Thomas Mölich (Bund für Umwelt und Naturschutz Deutschland, Landesverband Thüringen e. V., Projektleiter Rettungsnetz Wildkatze) provided us with basic insights into the Thuringian wildcat population and also supplied us with roadkill. The authors thank Dr Dietrich Heidecke (Zoologisches Institut der MLU, Halle/Saale) for allowing us access to the collections and for morphometric data on four domestic cats. The authors finally wish to thank Dr Franz Müller (Vorderau Museum Fulda) for his standardized measurement of intestine length.


