Morphological evolution in marmots (Rodentia, Sciuridae): size and shape of the dorsal and lateral surfaces of the cranium
Abstract
enMarmots are the largest ground squirrels and have been extensively studied by sociobiologists investigating the evolution of mammal societies. Being a member of the sciurid clade, traditionally considered inclined to convergence, they are also a group on which to test the hypothesis of sciurid propensity to homoplasy of osteological characters. In the present analysis, the dorsal and lateral surfaces of the cranium of all living marmot species are compared with geometric morphometric techniques. Phenetic groups are found which reflect the subgeneric classification of marmots and are consistent with previous morphometric analyses of the mandible and ventral cranium. Two species have distinctive morphologies and phenetic relationships not congruent with phylogeny. Marmota vancouverensis is highly divergent for osteological characters, fur colour and behaviour despite its young age and close genetic similarity to Marmota caligata. Its small population may represent a rare chance to study evolutionary processes during rapid allopatric speciation in mammals, but strong conservation efforts are required to preserve this unique component of the Vancouver Island biodiversity. Also, Marmota monax has distinctive cranial traits. These are possibly related to its long separate evolutionary history and unique ecology and behaviour. Size-related convergence is not evident in Marmota. When outgroup species are included, Spermophilus, Cynomys, Tamias, and Sciurus group together on one branch, Marmota on the other. This is best explained as a retention of the ancestral morphology in the smaller members of the Marmotini (Spermophilus, Cynomys, and Tamias) and the evolution of derived morphology in Marmota.
Riassunto
itLe marmotte sono i piú grandi sciuridi viventi e sono state intensamente studiate dai sociobiologi nel tentativo di comprendere le dinamiche evolutive delle societá mammaliane. Questa linea di scoiattoli terricoli rappresenta, inoltre, un ambito per la verifica dell'ipotesi di propensione all'omoplasia nella forma delle ossa degli sciuridi. Nella presente indagine, le superifici dorsale e laterale del cranio di tutte le specie viventi di marmotte sono state analizzate e confrontate servendosi di tecniche di morfometria geometrica. I raggruppamenti fenetici scoperti rispecchiano la classificazione in sottogeneri delle marmotte e sono congruenti con i risultati di precedenti studi sulla morfologia della mandibola e del lato ventrale del cranio. Due specie, tuttavia, hanno caratteristiche peculiari e le loro relazioni fenetiche con gli altri membri del genere non-riflettono i rapporti filogenetici. Marmota vancouverensis, a dispetto della recente origine evolutiva e della somiglianza genetica con M. caligata, possiede caratteri osteologici fortemente divergenti, oltre a tratti del comportamento e colore della mantello unici tra le marmotte. La piccola popolazione di M. vancouverensis potrebbe rappresentare una rara opportunitá di indagare i meccanismi evolutivi dei processi di speciazione rapida in allopatria. La sopravvivenza di questa componente unica della biodiversitá dell'isola di Vancouver dipenderá, tuttavia, da un'efficace e duratura politica conservazionista. Anche Marmota monax presenta caratteri craniometrici peculiari parallelamente ad aspetti singolari della sua ecologia ed etologia, ma, diversamente da M. vancouverensis, ha alle spalle una lunga storia evolutiva. Le marmotte non-sembrano, invece, caratterizzate da forme convergenti in specie di taglia simile. I rappresentanti dei generi Spermophilus, Cynomys, Tamias e Sciurus, adoperati come outgroup, si raggruppano insieme, ben separati dalle marmotte. Questo si puó spiegare con la conservazione di caratteri plesiomorfici nei membri di piccola taglia dei Marmotini (Spermophilus, Cynomys, and Tamias) e con l'evoluzione di tratti autoapomorfici nelle ben piú grosse marmotte.
Introduction
Marmots, the giant ground squirrels of the Recent fauna, constitute the genus Marmota comprising 14 species. Their ranges extend from the eastern USA through Alaska and Siberia to Europe, with six species in North America and eight species in Eurasia, commonly at high elevations (Steppan et al. 1999). Because of their occurrence at high altitudes and latitudes, marmots are frequently subject to climatic extremes. This is believed to have led to the observed late dispersal of young animals and increased sociality of most species of marmots, which in turn have caused them to be favoured subjects in studies of social behaviour and ecology (Armitage 1981, 1999, 2000). Accordingly, many aspects of their biology are known, and it is of great interest to map interspecific similarities and differences on a phylogenetic tree to estimate how evolution has occurred.
The history of the unstable taxonomy and phylogeny of marmots has been reviewed recently in Steppan et al. (1999), who provided a phylogeny of the 14 species based on the complete sequence of the cytochrome-b gene (Fig. 1). They adduce strong support for the subgenus Petromarmota, which includes four species of Western North America: Marmota caligata, Marmota flaviventris, Marmota olympus, and Marmota vancouverensis. This same well supported node was found by Kruckenhauser et al. (1999), using both cytochrome-b and 1.2 kb of NADH-4, in a study 10 of the 14 species. Of special note for contrast with the remarkable behavioural and morphological divergence of M. vancouverensis (Blumstein 1999; Armitage 2000; Cardini 2003) is the close genetic similarity of M. caligata and M. vancouverensis, a sister group strongly supported in both studies. The phylogeny of the other 10 species, the subgenus Marmota, is more ambiguous. All its representatives are Palaearctic except two. Probably, the solitary Marmota monax of North America is basal to the others, suggesting that sociality evolved twice within the genus (Kruckenhauser et al. 1999), but the basal branches for this subgenus are short and the nodes not convincingly supported. There are three well supported nodes within the subgenus, however. These are (1) Marmota caudata and Marmota menzbieri; (2) Marmota baibacina and Marmota bobac; and (3) Marmota camtschatica, Marmota sibirica, and Marmota himalayana. The last five species together form another supported clade, but their relationships to the North American species M. monax and Marmota broweri, the Alpine M. marmota, and the Asian sister pair, M. caudata and M. menzbieri, are less certain.
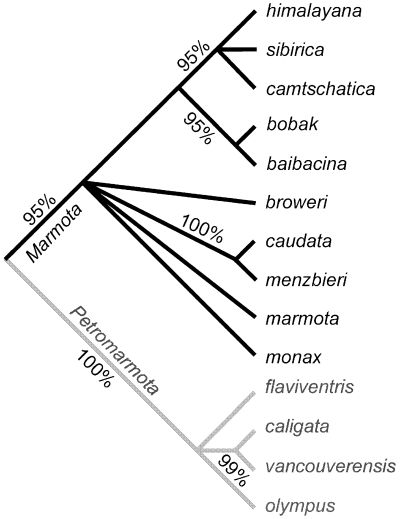
Marmot cytochrome b gene tree (bootstrap percentages for well supported clades; from Steppan et al. 1999, modified)
Marmot anatomy has been well studied for several species (Parsons 1894; Bryant 1945) but comparative studies within the genus have been conducted only recently. Cardini (2003) performed a morphometric analysis on the mandible of all 14 species, using landmark data from the labial side and various analytic procedures, and has extended the study with landmark data from the lingual side of the mandible (Cardini 2004), and an analysis of the ventral surface of the cranium (Cardini and O'Higgins 2004). In the first study, the phenetic pattern reflected the phylogenetic pattern, distinguishing the North American subgenus, Petromarmota, although M. vancouverensis did not group closely with M. caligata, as it did in the genetic data. Addition of data from the lingual side identified unique features in some species but reduced the evidence for a phylogenetic signal in the phenetic pattern, perhaps because of the reduced sample size (and larger sampling error). In the analysis of the ventral side of the cranium three main phenetic groups were found, which reflect phylogeny (subgenus Petromarmota, and Palaearctic subgenus Marmota) or geographical distribution (Palaearctic vs. Nearctic subgenus Marmota). Convergence in skeletal characters due to size similarities is a common finding in the sciurid skeleton in morphological analyses (Hafner 1984; Roth 1996; Velhagen and Roth 1997). For instance, Hafner (1984) found sciurid phenetic clusters reflecting either size (small, medium, large species) or ecological similarities (diggers and climbers, and, among climbers, desert/scrub foragers, terrestrial/arboreal foragers, adept climbers) in his analysis of cranial and post-cranial characters, and Roth (1996) presented a cladogram based on ‘qualitative characters of the cranium’ that is ‘what one might have expected had we performed our analysis on just a single character: size’. However, the same kind of homoplasy was not found either by Cardini (2003) or Cardini and O'Higgins (2004) within the Marmotini. Moreover, both studies indicated that the Vancouver Island marmot has divergent morphological features in the mandible and cranium despite a genetic distance between M. vancouverensis and M. caligata similar to that among different populations of the latter species. Cardini and O'Higgins suggested that also M. monax has a distinctive shape of the cranium, while its mandible is fairly similar to those of the Palaearctic marmots.
In this study of the geometric morphometrics of the dorsal and lateral views of the cranium, we address three specific issues.
- 1
What is the congruence between the phylogeny based on molecular data and the phenetics based on the dorsal and lateral surfaces? We also compare our results with those from previous morphological analyses of the marmot mandible and ventral cranium. These previous analyses emphasized areas associated with the teeth and with jaw mechanics and they included endochondral bones. The current analysis emphasizes areas reflecting brain size and predominantly dermal bones.
- 2
Is there skeletal convergence among animals of similar size? A positive answer would support the hypothesis of sciurid propensity to skeletal homoplasy, contrary to the findings from the mandible (Cardini 2003) and ventral cranium (Cardini and O'Higgins 2004), but congruent with previous studies on sciurids (Hafner 1984; Roth 1996; Velhagen and Roth 1997).
- 3
Is there evidence of rapid morphological evolution in M. vancouverensis as suggested by the study of the marmot mandible (Cardini 2003) and partially supported by the ventral cranium too (Cardini and O'Higgins 2004)?
Materials and Methods
Dorsal and lateral views of more than 330 adult specimens of all 14 living marmot species were examined (Table 1). Adults were distinguished as described by Cardini (2003) on the same sample, using tooth wear and differences in mandibular size and shape between young and adults. A further 35–39 specimens belonging to four other sciurid genera were included in the present study as outgroups.
| Species1 | Dorsal | Lateral | ||||
|---|---|---|---|---|---|---|
| n females | n males | n
 |
n females | n males | n
 |
|
| Marmotini | ||||||
| Marmota (MAR) | 148 | 144 | 334 | 159 | 147 | 355 |
| Marmota baibacina (bai) Kastschenko 1899 | 7 | 8 | 23 | 7 | 9 | 25 |
| Marmota bobak (bob) (Müller 1776) | 8 | 10 | 18 | 9 | 9 | 20 |
| Marmota broweri (bro) (Hall and Gillmore 1934) | 2 | 2 | 4 | 1 | 2 | 3 |
| Petromarmota caligata (cal) (Eschscholtz 1829) | 25 | 19 | 45 | 27 | 17 | 45 |
| Marmota camtschatica (cam) (Pallas 1811) | 9 | 10 | 21 | 9 | 10 | 21 |
| Marmota caudata (cau) (Geoffroy 1844) | 17 | 14 | 34 | 20 | 14 | 37 |
| Petromarmota flaviventris (fla) (Audubon and Bachman 1841) | 28 | 22 | 53 | 29 | 22 | 54 |
| Marmota himalayana (him) (Hodgson 1841) | 12 | 12 | 29 | 13 | 12 | 29 |
| Marmota marmota (mar) (Linnaeus 1758) | 7 | 8 | 27 | 7 | 7 | 29 |
| Marmota menzbieri (men) (Kashkarov 1925) | 3 | 3 | 6 | 4 | 3 | 7 |
| Marmota monax (mon) (Linnaeus 1758) | 17 | 18 | 43 | 20 | 21 | 51 |
| Petromarmota olympus (oly) (Merriam 1898) | 3 | 5 | 8 | 2 | 6 | 8 |
| Marmota sibirica (sib) (Radde 1862) | 7 | 10 | 17 | 7 | 11 | 18 |
| Petromarmota vancouverensis (van) Swarth 1911 | 3 | 3 | 6 | 4 | 4 | 8 |
| ‘Outgroup’ | ||||||
| Spermophilus | 7 | 6 | 17 | 7 | 7 | 19 |
| Spermophilus beldingi (speb) Merriam 1888 | 1 | 2 | 4 | 1 | 2 | 4 |
| Spermophilus citellus (spec) (Linnaeus 1766) | 4 | 3 | 7 | 3 | 4 | 7 |
| Spermophilus richardsoni (sper) (Sabine 1822) | 1 | 1 | 1 | 1 | 3 | |
| Spermophilus undulatus (speu) (Pallas 1778) | 3 | 3 | 3 | 3 | 3 | 3 |
| Otospermophilus variegatus (spev) (Erxleben 1777) | 2 | 2 | 2 | 2 | ||
| Cynomys | 1 | 1 | 4 | 2 | 3 | 5 |
| Leucocrossuromys leucurus (cynle) Merriam 1890 | 1 | 1 | 1 | 1 | ||
| Cynomys ludovicianus (cynl) (Ord 1815) | 3 | 1 | 3 | 1 | 3 | 4 |
| Tamias | 3 | 4 | 8 | 4 | 4 | 9 |
| Eutamias sibiricus (tamsi) (Laxmann 1769) | 2 | 2 | 1 | 2 | 3 | |
| Neotamias amoenus (tama) Allen 1890 | 2 | 1 | 3 | 2 | 1 | 3 |
| Tamias striatus (tams) (Linnaeus 1758) | 1 | 1 | 3 | 1 | 1 | 3 |
| Sciurini | ||||||
| Sciurus vulgaris (sciv) Linnaeus 1758 | 3 | 3 | 6 | 3 | 3 | 6 |
- 1Abbreviations for species names used in figures are given in parentheses. Specimens belong to the following collections: British Museum of Natural History (London, UK); Museum of Vertebrate Zoology (Berkeley, CA, USA); National Museum of Natural History (Washington, DC, USA); Zoological Institute of the Russian Academy of Sciences (St Petersburg, Russia); Museo di Storia Naturale di Milano (Italy); National Park Gran Paradiso (Torino, Italy); collection of Dino Scaravelli; Department of Animal Biology, University of Modena and Reggio Emilia.
- 2Including specimens of unknown sex.
- 3No available information on sex.
Geometric morphometrics is a powerful set of techniques for quantitative analysis of the form of organisms or of their organs (Adams et al. 2004). The geometry of shape is captured by a configuration of topographically corresponding landmarks (Marcus et al. 2000) digitized on each specimen. Size and shape are separated, and shape differences can be visualized with deformation grids in the style of Thompson (1917).
Landmarks were digitized on standardized pictures (Fig. 2) of the dorsal and lateral views of the cranium. Landmarks were digitized only on the left side to avoid redundant information in symmetric structures. Landmark precision was tested as described in Fontaneto et al. (2004). After unreliable landmarks were excluded, configurations of, respectively, 11 and 8 landmarks were used to describe the dorsal and lateral side of the cranium (Table 2).
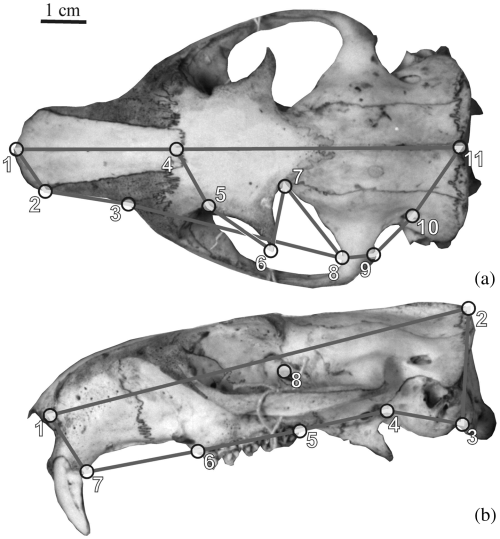
Landmark configurations on the dorsal (a) and lateral (b) marmot cranium
| Number | Definition1 |
|---|---|
| Dorsal cranium | |
| 1 | Anterior (midsagittal) tip of the nasal |
| 2 | Anterior tip of suture between nasal and premaxilla |
| 3 | Anterior tip of suture between premaxilla and maxilla |
| 4 | Meeting point between nasal and frontal along the midsagittal plane |
| 5 | Supraorbital notch |
| 6 | Tip of the postorbital process of the frontal |
| 7 | Posterior base of the postorbital process |
| 8 | Most posterior point of the orbit along the squamosal process of the zygomatic arch |
| 9 | Most posterior meeting point between jugal and squamosal process of the zygomatic arch |
| 10 | Temporal foramen |
| 11 | Most posterior point of the parietal along the midsagittal plane |
| Lateral cranium | |
| 1 | Anterior tip of suture between nasal and premaxilla |
| 2 | Most posterior point of the parietal along the midsagittal plane |
| 3 | Most ventral meeting point between mastoid process of the occipital bone and the tympanic bulla |
| 4 | Most ventral meeting point between tympanic bulla and alisphenoid |
| 5–6 | Posterior and anterior end of the toothrow |
| 7 | Posterior most ventral point of the upper incisor alveolus |
| 8 | Dorsal tip of the optic foramen |
- 1The terms ‘anterior’ and ‘posterior’ are used with reference to Fig. 1.
Size was standardized and landmark configurations were registered with a generalized Procrustes analysis (GPA, Rohlf and Slice 1990) to remove artefactual differences (translation and rotation in the process of data collection) in landmark coordinates. Size was calculated as centroid size, i.e. the squared root of the sum of squared distances between each landmark and the centroid (centre of gravity) of a landmark configuration. Shape variables (Bookstein 1991, and Dryden and Mardia 1998, for computational details) were computed as linear combinations of the original variables after the GPA. Shape differences were visualized with transformation grids using Bookstein's (1991) thin plate spline (TPS) algorithm. Deformations shown in figures are from the average landmark configuration (reference, grey lines) to a target configuration (black lines).
Points representing landmark configurations are projected into a Euclidean tangent space that approximates the curved shape space to aid statistical analyses. This approach is satisfactory when variations are small (Rohlf 2004), as in the present data (results not shown).
Group differences were tested in each data set with analyses of variances (Tables 3 and 4) of the morphometric variables (sex × species anova for the centroid size; sex × species manova for the shape variables). Canonical variate analysis (CVA) was also used for analysing shape variation. Shape variables were regressed onto the first two canonical axes, and deformation grids for the most extreme points (specimens) along each axis were shown to illustrate shape variation along these axes. Also, principal component analysis (PCA) was applied to investigate phenetic relationships.
| Cranial view | Effect | Sum of squares | d.f. | F | p-value1 |
|---|---|---|---|---|---|
| Dorsal | Sex | 575.099 | 1 | 43.334 | 2.54 × 10⁻⁶ |
| Species | 1077.169 | 13 | 23.136 | 0 2 | |
| Sex × species | 25.899 | 13 | 1.042 | 0.411 | |
| Error | 24.857 | 264 | 24.857 | ||
| Lateral | Sex | 375.474 | 1 | 16.698 | 5.74 × 10⁻⁵ |
| Species | 1029.789 | 13 | 45.797 | 0 2 | |
| Sex × species | 18.829 | 13 | 0.837 | 0.620 | |
| Error | 22.486 | 278 |
- 1Excluding M. broweri (smallest sample), p-values in all analyses are similar to those found including all species.
- 2p-values smaller than the minimum value that can be displayed by Statistica for Windows (1997).
| Cranial view | Effect | λ Wilks | F | d.f. | p-value1,2 |
|---|---|---|---|---|---|
| Dorsal | Sex | 0.884 | 1.80 | 18,247 | 0.0261 |
| Species | 1.59 × 10⁻⁴ | 14.53 | 234,2648.6 | <0.0001 | |
| Sex × species | 0.423 | 0.96 | 234,2648.6 | 0.660 | |
| Lateral | Sex | 0.918 | 1.98 | 12,267 | 0.265 |
| Species | 0.00427 | 13.01 | 156,2393.9 | <0.0001 | |
| Sex × species | 0.558 | 1.04 | 156,2393.9 | 0.348 |
- 1Excluding M. broweri (smallest sample), p-values in all analyses are similar to those found including all species except for the sex effect in the lateral cranium that becomes close to significance (p = 0.0555).
- 2After removing the proportion of shape variance of the cranium explained by size in a mancova, the only appreciable change in p-values is that of sex effect (p = 0.291) for the dorsal cranium.
The dorsal and lateral cranium shape was analysed also with the separate subset method of Adams (1999) to combine shape information from both views of the cranium. Landmarks 2 and 11 were excluded in the dorsal cranium configuration to avoid redundancy (they are the same as landmarks 1 and 2 in the lateral cranium). Mean landmark configurations of each species were computed separately for the nine dorsal landmarks and the eight lateral ones. Shape variables of the two datasets were then combined, Euclidean distances among mean shapes were computed on the resulting matrix (dorsal and lateral information combined) and the distance matrix was analysed with multidimensional scaling (MDS) and unweighted pair-group method using arithmetic averages (UPGMA) cluster analysis.
All analyses of variance and multivariate regression were repeated after excluding M. broweri to verify whether the inclusion of this very small sample (n ≤ 4) could lead to unstable results. No appreciable differences were found, and thus M. broweri was included in all analyses.
Programs of the TPS Series (Rohlf 2004), Morpheus et al. (Slice 1999) and Morphologika (O'Higgins and Jones 1999) were used for geometric morphometric analyses. Statistical analyses were performed with NTSYS-pc (Rohlf 2002), Statistica for Windows (1997) and sas 8.02 (SAS 2001).
Results
For simplicity, the following conventions will be used in this section and in the Discussion: (a) to avoid confusion between Marmota as a genus and Marmota as a subgenus, the latter will be indicated as MarmotaSG; (b) all observations concern both dorsal and lateral cranial surfaces, unless differently specified.
Species differences are always highly significant (either for size or shape in both datasets). Sexual dimorphism is highly significant for size, but negligible for shape (p > 0.01). Males are always larger than females (the only exception is the lateral cranium of M. baibacina with virtually no sexual dimorphism for size). Interactions (sex × species) are never significant. That shape differences between sexes are small compared with interspecific differences is confirmed in cluster analyses for either dorsal or lateral cranium mean shapes with separate sexes: males and females of each species group together in both datasets except for three cases in the lateral cranium. Thus, all further analyses are performed with pooled sexes.
Canonical variate analysis (with species as grouping variable, and pooled sexes) are highly significant (p < 0.0001) in both datasets and hit ratios (i.e. the ratio, expressed as percentage, of the number of correctly classified individuals to the total number of individuals) for the dorsal and lateral cranium are respectively ≤93.7 and ≤81.4%. Three main clusters are found in the plot of the first two CVA axes (3, 4): MarmotaSG (excluding M. monax), Petromarmota and M. monax. Marmota monax is always clearly separated from all other species, and its cranium is enlarged in the posterior region (dorsal view) and dorso-ventrally compressed (lateral view). Large overlapping is visible between MarmotaSG (excluding M. monax) and Petromarmota, and ‘group-specific’ shape traits are less clearly identifiable. Separation among the three groups are not evident in the plots of the first two PCA axes of both datasets (3, 4).
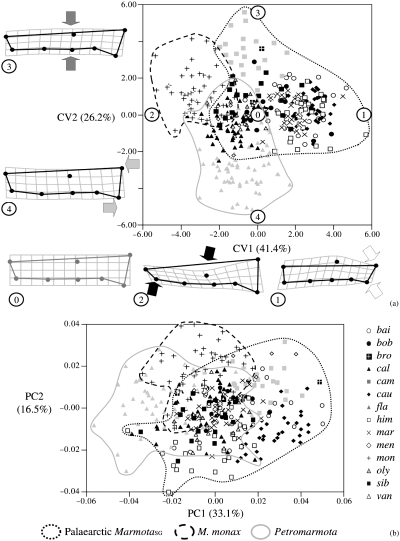
Dorsal cranium. Scatterplot of CV1, CV2 (a) and PC1, PC2 (b) (percentage of variance in parentheses). For the CVA plot, TPS deformation grids for the extreme points (encircled numbers) of each axis are shown (deformation grids exaggerated × 3). In this Figure, and in Fig. 4, the reference is shown separately (grey) from the target (black), while in all other figures both reference and target are shown in the same deformation plot (See Table 1 for abbreviations)
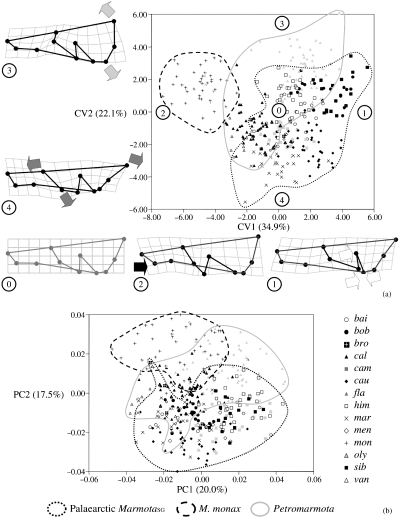
Lateral cranium. Scatterplot of CV1, CV2 (a) and PC1, PC2 (b) (percentage of variance in parentheses). For the CVA plot, TPS deformation grids for the extreme points (encircled numbers) of each axis are shown (deformation grids exaggerated × 3)
Phenetic relationships among marmot species are shown in the MDS plot with dorsal and lateral cranium information combined (Fig. 5a). Species-specific cranial traits are described with deformation grids for the dorsal and lateral cranium in Fig. 6. Marmota vancouverensis is clearly separated from all other species in the MDS plot. The most peculiar trait visible in M. vancouverensis cranium is the anterior displacement of L4, which implies short nasals and elongated frontal-parietal bones. Three main groups of possible phylogenetic/zoogeographic relevance are visible. All Palaearctic species of MarmotaSG plus M. broweri (the Alaskan marmot) group together (clusters I and II). In this cluster, M. baibacina, M. bobac, M. camtschatica, M. himalayana and M. sibirica are close one another (cluster I), and generally characterized by a fairly elongated cranium. They all belong to the same clade according to Steppan et al. (1999). A second, less clearly defined, phenetic group (II) consists of M. caudata, M. marmota, M. menzbieri and M. broweri. These species are basal lineages in the marmot gene tree (Steppan et al. 1999).
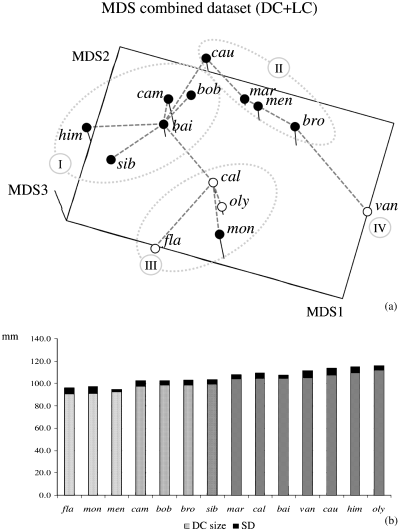
(a) MDS plot of mean shapes with dorsal and lateral cranium information combined. A minimum spanning tree (Rohlf 1970) is superimposed to aid detection of possible deformation of the multivariate space in the three-dimensional scatterplot. Four main clusters are visible (Roman numbers). (b) Histogram bars proportional to dorsal cranium (DC) average size (grey tones) plus standard deviation for each marmot species (black). Different tones of grey are used to emphasize four main size groups
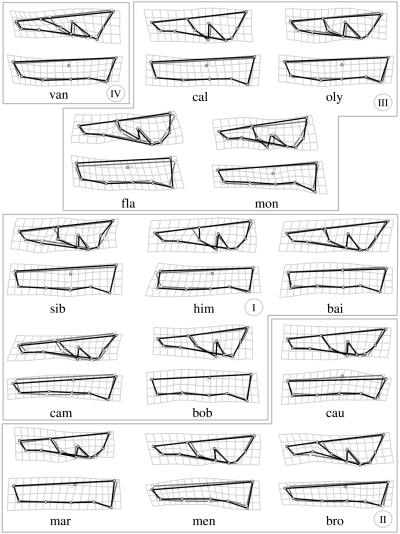
TPS deformation grids for dorsal and lateral cranium of all marmot species. The four main cluster found in the MDS (combined dataset) are shown
The third cluster (III) in the MDS includes all Petromarmota species, except M. vancouverensis. It also includes M. monax, that together with M. broweri, is the only Nearctic species of MarmotaSG. Petromarmota (especially M. caligata and M. flaviventris) has a relatively thick (lateral view) cranium.
The average size of the dorsal cranium is shown in Fig. 5b with histogram bars ordered according to increasing size [the size of the dorsal cranium is highly correlated to that of the lateral cranium (r = 0.991)]. No shape clusters clearly reflect cranial size.
The same clusters of the MDS are found in the UPGMA phenogram of the combined dataset (shown in Fig. 7, together with the outgroups). The only exception is M. bobac relatively close to species of cluster II. The cranial morphology discriminates the sciurid genera well. However, genera belonging to the tribe Marmotini do not cluster together. Cynomys, Spermophilus, and Tamias group with Sciurus rather than with Marmota. A short snout and relatively dorso-ventrally compressed cranium characterize these outgroup species, all of which are remarkably smaller than Marmota.
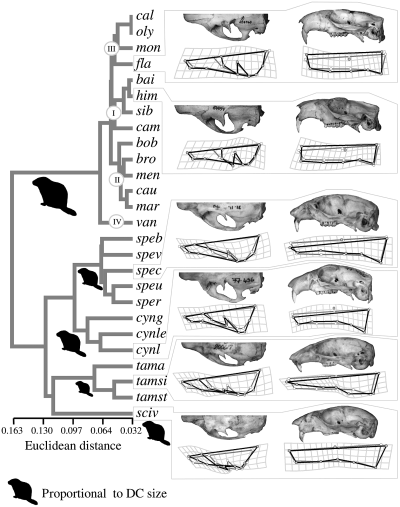
UPGMA phenogram for the mean shapes with dorsal and lateral cranium information combined. The outgroup species are included, and the four main clusters found in the MDS are shown. Sciurid-like icons proportional to the average size of each genus are drawn to help detect possible convergencies due to size similarities. Pictures and deformation grids are shown for representatives of all genera
Discussion
The comparison of the dorsal and lateral surfaces of the cranium among all living marmot species complements the analyses by Cardini (2003) and Cardini and O'Higgins (2004) on the mandible and the ventral side of the cranium. These are the first morphological analyses involving all marmot species.
Two main issues inspired Cardini's (2003) analysis of the marmot mandible: (1) the comparison of phenetic clusters and phylogenetic clades, and, thus, the congruence between groups suggested by shape similarities and those (presumably) reflecting evolutionary relationships; (2) the hypothesized propensity of the sciurid skeleton to homoplasy. A phylogenetic signal was detected at intermediate taxonomic levels (marmot subgenera and tribe Marmotini) while no support for the pattern of osteological convergence was found. The unexpectedly pronounced morphological divergence of M. vancouverensis despite a short evolutionary history suggested that this taxon may have evolved quite rapidly as a peripheral isolate (the third question in Cardini and O'Higgins 2004, and in the present study). The analysis of the ventral surface of the cranium (Cardini and O'Higgins 2004) corroborated Cardini's (2003) outcomes on the mandible but suggested also that atypical traits are present in the cranium of the only solitary marmot species, M. monax. The three issues investigated by Cardini and O'Higgins (2004) were considered again in the present analysis using different cranial traits (dorsal and lateral surfaces) and will be discussed in the following paragraphs. Also, particular attention was paid to the occurrence of a distinctive morphology in the cranium of M. monax, a species which is highly peculiar among marmots for the forest-dwelling aspects of its ecology and its solitary behaviour.
As in the previous studies, our morphological analysis did not attempt to find clades using cranial measurements. Whether or not morphometric characters may be suitable for phylogenetic analysis is a matter of debate (Rae 1998; MacLeod and Forey 2002). However, this study was not aimed at phylogenetic reconstruction. Our main purpose was to find phenetic groups based on the shape of the cranium and to compare these cluster to clades, determined from molecular data, in order to understand whether the shape of this structure reflects phylogenetic relationships.
(1) The CVA and manova suggest that some discrimination among species is possible and (as in all previous studies) sexual dimorphism in shape is negligible compared with interspecific differences. In the CVA scatterplot (3, 4) three groups can be distinguished. These are the same as in Cardini and O'Higgins: Petromarmota, Palaearctic MarmotaSG plus M. broweri, and M. monax. CVA is commonly used in geometric morphometrics (for instance, Rohlf et al. 1996; Duarte et al. 2000; Corti and Rohlf 2001; Harvati 2003; Kassam et al. 2003). The space represented in the CVA is based on statistical distances and gives us information about the chance of confusing two (or more) groups. Violations of the statistical assumptions (generally difficult to test in taxonomic comparisons –Marcus 1990) may affect results of the CVA. Indeed, when specimens are compared using the PCA, a spatial representation which preserves the geometric properties of the shape space, no clear separation is evident among most marmot species. A few common patterns are found both in the CVA and PCA. Marmota monax is more or less separated from other marmots. Its cranium is dorso-ventrally compressed and relatively short and large. Also M. flaviventris (the marmot with the smallest skull) shows only a limited overlap with other marmots. Marmota caligata, M. olympus and M. vancouverensis are next to M. flaviventris but largely overlap with MarmotaSG species. The morphological divergence of cranial traits of marmots seems, thus, relatively modest.
In the second part of the interspecific comparison, average shapes are computed and information on the dorsal and lateral cranial surfaces is combined and summarized with ordination techniques and cluster analyses. The ordination gives a more accurate representations of the phenetic relationships compared with the phenogram (correlation with the matrix of the original distances is respectively 0.951 and 0.705). However, the phenogram topology helps visualizing clusters. Both phenograms and ordinations show similar relationships (results not shown) when genera are compared (outgroup species included). Thus, the ordination is preferred for discussing intrageneric relationships and the phenogram will be used for comparing genera.
The scatterplot of the average shapes (Fig. 5) provides a good discrimination of the marmot subgenera. Marmota vancouverensis (isolated from all other species) and M. monax (close to Petromarmota) represent two exceptions. The overall pattern is similar to Cardini and O'Higgins (2004) analysis of the ventral side of the cranium, although in the present study the morphological distinctiveness of M. vancouverensis is more pronounced and the two Nearctic representatives of MarmotaSG (M. monax and M. broweri) do not form a separate cluster. The marmot subgenera are, thus, supported in the ordination and also the Asiatic clade formed by the M. camtschatica group (sensuSteppan et al. 1999) and its sister clade M. bobac–M. baibacina receives some support. The observation of a good correspondence between similarity groups obtained with craniometric data and clades in the marmot gene tree (Steppan et al. 1999) at intermediate taxonomic levels, first made by Cardini (2003), is corroborated by the analysis of dorsal and lateral surface of the cranium.
(2) Convergence due to size similarities (Fig. 5) is not found in Marmota (e.g. M. caudata, M. himalayana and M. olympus, the three largest species, do not group together). This is consistent with previous findings on the mandible and ventral cranium (Cardini 2003, 2004; Cardini and O'Higgins 2004). In contrast, when the outgroups are included (Fig. 7), small species of Marmotini cluster with the common tree squirrel (Sciurini). All these small species are characterized by a short rostrum, an elongated cranial vault (frontals and parietals) and a dorsoventrally compressed muzzle. Interestingly, similar traits are visible in juvenile marmots. Marmots represent a relatively recent branch in the radiation of the polyphyletic genus Spermophilus (Herron et al. 2004). A small size is thus considered plesiomorphic in the evolution of the ground-squirrel clade. Therefore, cranial traits in common between small species of Marmotini and Sciurus are interpreted as ancestral features retained in these outgroup genera. Support for a cluster including Marmota, Cynomys and Spermophilus, found in previous studies on the mandible and ventral cranium (Cardini 2003; Cardini and O'Higgins 2004), may be explained by the evolution, and covariation, of synapomorphic traits in this monophyletic group.
(3) Marmota vancouverensis is confirmed as the most divergent marmot in cranial morphology. The short nasals are the most distinctive feature in the cranium. All the specimens available for this study were collected in 1910 on Mount Douglas or in the area of the King Solomon Basin. It may be argued that these individuals are strictly related and the atypical shape of the nasals is not representative of the real variation in the Vancouver Island marmot population. The same trait is, however, visible in a specimen (University of Montana Zoological Museum 13521), not available at the time of data collection for this study, collected on Mount Washington in 1968. A similar observation, on the same specimen, can be made for the bent tip of the coronoid process, which is one of the most divergent traits of the mandible of M. vancouverensis. The Vancouver Island marmot has thus several divergent skeletal traits which contribute to make this melanistic population (only 10 000–100 000 years old –Bryant 1997) unique among marmots. The young age and the small genetic distance (cytochrome b) to M. caligata (Steppan et al. 1999) on the one hand, and the peculiar morphology and unusual behavioural traits (characteristic vocalizations with unique components –Barash 1989; Blumstein 1999) on the other hand, suggest that the Vancouver Island marmot population may represent an interesting case of ongoing speciation in a mammal species isolated from its parental population.
Strong efforts to save the few surviving wild specimens of M. vancouverensis from extinction are required to preserve a unique component of the Vancouver Island biodiversity and to have a chance to study how this species evolved and what its interactions were with the native American populations with which it has coexisted for most of its history (Nagorsen et al. 1996).
Two-dimensional geometric morphometric analyses are particularly suitable for flat structures, where the error introduced by the study of a three-dimensional objects in two dimensions is minimized. The marmot hemimandible is very suitable in this respect and also the ventral cranium has several almost coplanar landmarks. The same does not hold for the dorsal and, especially, the lateral surface of the cranium, with a deep orbit and pronounced curvatures of the zygomatic arch and rostrum. Nevertheless, a careful choice of landmarks and the combination of both views led to results similar to those of previous analyses for the genus Marmota. This observation increases our confidence in the main patterns suggested by all the studies.
Acknowledgements
Several people contributed to this research directly and indirectly with their help, support and advice. Special thanks to J.G. Mead, C. Potter, C.A. Shaw, C.A. Ludwig, L. Gordon, D. Allen, D.F. Schmidt, E.M. Sampaio, S.C. Peurach, S.A. Jansa, L.R. Parenti, K. De Queiroz, C. Schennum, K. Ferrell and C. Clark, National Museum of Natural History, Washington; R. Ramousse, University of Lyon 1; P. Tongiorgi, Università di Modena e Reggio Emilia; M. Ferraguti and M. Di Lorenzo, University of Milano; L. Spezia, Museo di Storia Naturale di Milano; S. Elton, University of Hull; F.J. Rohlf, State University of New York; C.P. Klingenberg, University of Manchester; T.C. Rae, University of Durham; S. Steppan, Florida State University at Tallahassee; D.W. Nagorsen, Mammalia Biological Consulting, Victoria, British Columbia; P. Jenkins, and the mammal section staff of the British Museum of Natural History, London; B. Stein, then at the Museum of Vertebrate Zoology, University of California at Berkeley; M. Podestà, Museo Civico di Storia Naturale, Milano; A.O. Averianov, G.I. Baranova, K. Tsytsulina and the other very friendly colleagues of the Zoological Institutes of the Russian Academy of Sciences, St Petersburg; D. Dyer, University of Montana Zoological Museum, Missoula; and Dino Scarevelli, then Museo di Storia Naturale, Cesena. Thanks also to F. Daverio for his hospitality during A. Cardini's stay in London for data collection, and to V.L. Roth and an anonymous referee for their helpful comments on a previous version of this manuscript.
This work was supported by grants from Italian Ministero dell'Università e della Ricerca Scientifica e Tecnologica (60% funds), and was done when A. Cardini was a Smithsonian Fellow at the National Museum of Natural History, Washington, DC, USA.


