Use of a test day model for dairy goat milk yield across lactations in Germany
Summary
Breeding value prediction for dairy goats in Germany is still based on herd mate comparison within breeding society. The objective of this study was to estimate genetic parameters for milk yield based on a test day model. For the analysis 35 308, 30 551 and 23 640 test day records from lactations 1, 2 and 3 from 5079, 4118 and 3132 animals, respectively, were used. The data between 1987 and 2003 were obtained from six German breeding societies. The multiple trait (lactations 1, 2 and 3) repeatability model (RPT) included the fixed effects of breeding society–breed–herd–year, litter size, lambing season, and days in milk of third-order Legendre polynomials nested within herd–year, and the random effects of animal additive and permanent environment. The three-trait random regression model (RR) also included the random regressions based on second-order Legendre polynomials for animal additive and permanent environmental effects. Heritability estimates in RPT were 0.27 ± 0.02, 0.20 ± 0.02 and 0.37 ± 0.02 for the first, second and third lactation, respectively. The genetic correlation between the first and second lactation was 0.69, between the second and third lactation 0.79, and between the first and third lactation 0.45. Heritability estimates from the RR in the first and second lactations decreased from the beginning to the end of the lactation, with average values of 0.28 and 0.27, respectively. Estimates in the third lactation showed a maximum in the middle of lactation, averaging 0.37. Genetic correlations between the first and second lactation averaged 0.64, between the second and third lactation 0.72, and between the first and third lactation 0.46. Despite the small data set and restricted relationship structure the estimates were reasonable with the exception of estimates from the third lactation, which seemed inflated. RR could be used for genetic evaluation of dairy goats in Germany.
Introduction
Dairy goat breeding in Germany has a long tradition. The stock declined dramatically after the Second World War, reaching its low in the late 1970s, but the number of dairy goats and also the demand for goat dairy products have increased significantly during the previous decade. In Germany, the whole goat population is about 170 000 heads (FAO, 2007). Most of them are dairy goats. While herd sizes of less than 10 animals prevail, there are also specialized goat farms with large herd sizes.
The most common breeds are German Fawn and White Goat, representing about 90% of the dairy goat population. However, milk performance test has annually been conducted for only about 5000 dairy goats (BDZ, 2001). The estimation of genetic parameters is essential for the prediction of breeding values, and thus, for an efficient breeding programme. Goat-breeding societies in Germany are regional and are responsible for the genetic improvement of all the goat breeds in the respective regions. Currently, each of the 12 goat-breeding societies in Germany has its own breeding programme for all the breeds in the region. In most cases the breeding programmes are based on herd mate comparisons. The performance tests comprise the following trait complexes: milk performance (240-day performance) and exterior (frame, form, udder and muscling).
Implementation of milk recording is a major economical constraint because of the relatively high costs of the milk recording method practised. In Germany, the most complex and costly methods are prevalent – monthly test of morning and evening milking (A4 and B4) – with a minimum of eight recordings per lactation for milk yield, fat and protein content, and somatic cell count. As more and more larger commercial herds tend to renounce milk recording, simplified methods such as reducing the number of test day milk recordings per lactation should be offered to the breeders and/or other commercial herds.
Of late, the breeding societies have been working towards a common breeding value estimation. A common database for small ruminants has been developed as a basis for a joint breeding value estimation. The positive genetic trends reported for milk performance traits in different dairy goat breeds (e.g. Montaldo & Manfredi 2002) encourage the present endeavours in Germany.
Genetic parameters for milk performance traits in dairy goats have been estimated only for the first lactation or for various lactations together, mainly on the basis of a lactation yield model (e.g., Belichon et al. 1998; Bömkes et al. 2004a,b; Delgado et al. 2006). Information about genetic parameters across different lactations has not been studied yet. Test day models, if properly applied, can be more efficient than lactation yield models. Using a test day model, test day records can be directly included in genetic evaluations and environmental effects can be better accounted for. Test day models offer the possibility to simplify the recording scheme. Based on genetic parameters of test days in different stages of lactation it can be explored if estimated breeding values (EBVs) with a minimum loss of accuracy can be obtained with less test day records per lactation. The objective of this study is to compare genetic parameters for milk yield estimated with a repeatability and a random regression multiple trait test day model for the first three lactations.
Materials and methods
Data
Data were provided from six breeding societies and their associated milk recording organizations. While some breeding societies’ data were available since the end of the 1980s (Baden-Württemberg: 1987–2001, Bavaria: 1990–2002) or mid-1990s (Westfalen: 1996–2001), the data from the breeding societies of the new states (former East Germany) were available only since 1999 (Berlin-Brandenburg: 1999–2003, and Mecklenburg-Western Pomerania: 1999–2002) or later (Saxony: 2001–2002). Preliminary data editing included matching of data from breeding society with data from the milk recording association and plausibility checking. About half of the test day records received from the milk recording associations had to be discarded, mainly because of identification problems (Zumbach & Peters 2004). For this study, data of the first three lactations collected between 1988 and 2003, comprising about 90 000 test day records with days in milk (DIM) ≤ 300 from about 7000 animals (Table 1) of about 500 herds were used. The number of records, mean and standard deviation values, and minimum and maximum values by lactation are shown in Table 2. More than 95% of the animals belonged to the breeds German Fawn (71.3%) and White Goat (25.2%), and the rest were Toggenburg (3.0%), Thüringerwald (0.4%) and Anglo Nubian Goat (0.1%). The pedigree file had 12 878 animals listed, including 5849 parents without records. For 61% of the animals with records both parents were known, while for 13% only the sire or dam was known (Table 3).
| Breeding society | No. animals | Breeds |
|---|---|---|
| Bavaria | 3558 | GF, GW |
| Baden-Wuerttemberg | 1655 | GF, GW |
| Westphalia | 488 | GF, TO, TW, GW |
| Saxony | 984 | GF, TW, GW |
| Berlin-Brandenburg | 331 | AN, GF, TO, TW, GW |
| Mecklenburg-Western Pomerania | 13 | TO, GW |
| Total | 7029 |
- AN, Anglo Nubian; GF, German Fawn; GW, German White; TO, Toggenburg; TW, Thüringer Waldziege.
| Lactation no. | No. animals | No. test day records | Mean | SD | Min. | Max. |
|---|---|---|---|---|---|---|
| 1 | 5079 | 35 308 | 2.2 | 1.0 | 0.1 | 9.0 |
| 2 | 4118 | 30 551 | 2.7 | 1.2 | 0.1 | 8.6 |
| 3 | 3132 | 23 640 | 2.9 | 1.2 | 0.2 | 9.0 |
| Criteria | No. animals |
|---|---|
| Sire and dam known | 4273 |
| Only sire known | 574 |
| Only dam known | 287 |
| No pedigree information | 1895 |
There were some restrictions with regard to genetic links among breeding societies and herds. Different identification systems in some of the herdbook societies (e.g. Baden-Wuerttemberg, Bavaria) impeded traceability of genetic links with the other herdbook societies, while Saxony, Berlin-Brandenburg and Mecklenburg-Western Pomerania shared the same identification and herdbook system. On the other hand, artificial insemination in dairy goats is very uncommon although insemination results are comparable with those of dairy cows. To avoid contagious diseases such as Caprine Arthritis Encaphalitis (CAE), breeding males were only used in natural service within a flock. Nevertheless, the favourable reproductive performance of the goats, with multiple births being common, led to genetic links being secured between herds through the active exchange of breeding animals between flocks within and among breeding societies.
Test day models


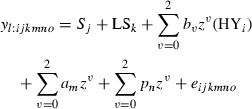
Multiple-trait model

Results
Repeatability model
Variance components from RPT for milk yields in the first three lactations are presented in Table 4. The estimates for the additive genetic variances (Va) for milk yields in lactations 1 and 2 (0.11) were similar, while in lactation 3 (0.24) the estimate was twice as high. In lactation 1 the permanent environmental (Vp) and the residual variances (Ve) were smaller than that in lactation 2. Therefore, the heritability estimated in lactation 2 (0.20) was lower than that in lactation 1 (0.27). The heritability estimate in lactation 3 (0.37) was the highest, although Ve was higher than those in lactations 1 and 2. This value should be considered with caution because in lactation 3 the number of records was relatively small. Therefore, a major impact of the unfavourable data structure (small herd sizes, restricted relationship) was to be expected.
| Lactation | V a | V p | V e | h 2 | r |
|---|---|---|---|---|---|
| Lactation 1 | 0.11 | 0.10 | 0.18 | 0.27 | 0.54 |
| Lactation 2 | 0.11 | 0.19 | 0.23 | 0.20 | 0.56 |
| Lactation 3 | 0.24 | 0.13 | 0.27 | 0.37 | 0.58 |
- aSE of additive and permanent environmental variances: 0.01–0.02; SE of residual variance: <0.01; SE h2: 0.02.
- V a, additive genetic variance; Vp, permanent environmental variance; Ve, residual variance.
The RPT phenotypic and genetic correlations among lactations are shown in Table 5. Genetic correlations between adjacent lactations (first and second lactations, second and third lactations) were higher than those between first and third lactations. The phenotypic correlations were of the same magnitude as the genetic correlations.
| Lactation 1 | Lactation 2 | Lactation 3 | |
|---|---|---|---|
| Lactation 1 | 0.69 | 0.45 | |
| Lactation 2 | 0.65 | 0.79 | |
| Lactation 3 | 0.55 | 0.80 |
Random regression model
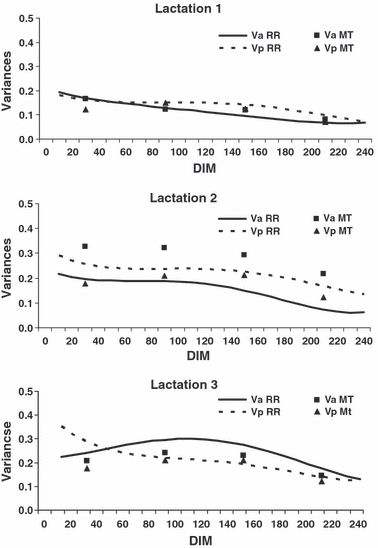
Figure 1 presents Va and Vp obtained by RR during the course of the lactations. For the first and second lactations, Va decreased from about 0.2 at the beginning to about 0.06 at the end of lactation. Lactation 3 showed a maximum (0.29) in the middle of the lactation. The averages of Va over the DIM 10 to 240 were 0.11, 0.14 and 0.23 for lactations 1, 2 and 3, respectively. The MT estimates of the first lactation were very close to the corresponding RR estimates. The MT estimates of Va during the second lactation were about 0.1 units higher than the corresponding RR estimates throughout the lactation. The MT estimates of Va for the third lactation were about 0.04 units less than the corresponding RR estimates.

Additive genetic (Va) and permanent environmental variances (Vp) in lactations 1 to 3 according to days in milk (DIM). RR = random regression; MT = multiple trait.
The curves of Vp slightly decreased from the beginning to the end of lactation. They were similar in amount to Va. MT estimates were lower in the beginning and end of lactation, indicating that RR estimates in these stages could be overestimated. The average Vp over the DIM 10 to 240 estimated by RR for lactations 1, 2 and 3 were 0.13, 0.22 and 0.22, respectively.
Because of convergence problems, Ve was set to be homoscedastic. This assumption might not be true, as the MT estimates for residuals were not the same in different stages of the lactation. These ranged from 0.12 to 0.18, 0.15 to 0.25 and 0.16 to 0.29 in lactations 1, 2 and 3, respectively. The RR estimates for Ve were 0.14, 0.16 and 0.19 in lactations 1, 2 and 3, respectively. They were lower than those estimated with RPT.
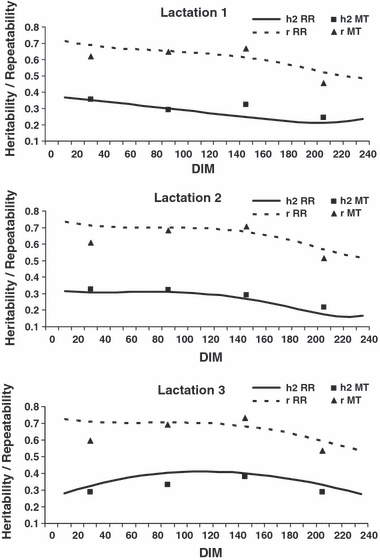
The RR heritability and repeatability estimates are shown in Figure 2. The heritability curves followed the same pattern as Va obtained with RR. The corresponding MT estimates were close to the curves of all three lactations, however not as close as for Va in first lactation. The average RR estimates over the DIM 10 to 240 for heritability were 0.28, 0.27 and 0.37 for lactations 1, 2 and 3, respectively. The RR repeatability estimates over the DIM 10 to 240 were about twice as high as the heritability estimates averaging 0.61, 0.67 and 0.67 in lactations 1, 2 and 3, respectively. Similar to that for Vp, MT estimates were lower at the beginning and at the end of the lactations.

Heritability (h2) and repeatability estimates (r) for milk yield in lactations 1 to 3 according to days in milk (DIM). RR = Random Regression; MT = Multiple Trait.
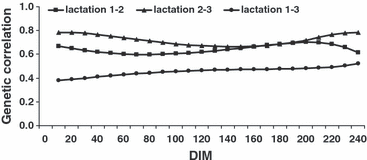
The RR estimates for genetic correlations among lactations are presented in Figure 3. The curves were almost flat throughout the course of lactation. The genetic correlations between adjacent lactations were larger than those between lactations 1 and 3 and very similar to the RPT estimates. The average genetic correlations between first and second lactation, second and third lactation, and first and third lactation were 0.64, 0.72 and 0.46, respectively. The average RR phenotypic correlations between first and second lactation, second and third lactation and first and third lactation were 0.51, 0.55 and 0.34, respectively.

RR estimates of genetic correlation for milk yield among lactations 1 to 3 according to days in milk (DIM).
Tables 6 and 7 show the rank correlations between EBVs of the different models for sires and does, respectively. The correlations between RR and RPT were close to 1 for both sires and dams, suggesting that the two models conformed with regard to selection strategies. The correlations between RR and MT were lower: they ranged from 0.79 to 0.91 for does and from 0.69 to 0.89 for sires according to lactation number and stage of lactation. These estimates were rather high considering the restricted sample sizes (63–136 sires, 2700–4500 does) and the relatively low accuracies (sires with only 10 progeny are included). RR EBVs seemed to be therefore good estimates for different stages of the lactation.
| Lactation no./model | |||
|---|---|---|---|
| Days in milkb | 1 | 2 | 3 |
| RR-RPT | |||
| 5–300 | 0.97 | 0.92 | 0.97 |
| RR-MT | |||
| 30 (5–60) | 0.89 | 0.83 | 0.86 |
| 90 (61–120) | 0.91 | 0.87 | 0.82 |
| 150 (121–180) | 0.91 | 0.86 | 0.88 |
| 210 (181–300) | 0.89 | 0.79 | 0.87 |
- RR, random regression model; RPT, repeatability model; MT, multiple trait model.
- aDoes with ≥5 test day records; first lactation: n = 4481, second lactation: n = 3575; third lactation: n = 2762.
- bDays in milk periods for MT in parenthesis.
| Lactation no./model | |||
|---|---|---|---|
| Days in milkb | 1 | 2 | 3 |
| RR-RPT | |||
| 5–300 | 0.98 | 0.95 | 0.99 |
| RR-MT | |||
| 30 (5–60) | 0.83 | 0.79 | 0.86 |
| 90 (61–120) | 0.82 | 0.82 | 0.89 |
| 150 (121–180) | 0.77 | 0.78 | 0.88 |
| 210 (181–300) | 0.81 | 0.69 | 0.88 |
- RR, random regression model; RPT, repeatability model; MT, multiple trait model.
- aSires with ≥10 progeny; first lactation: n = 136, second lactation: n = 111; third lactation: n = 63; bDays in milk periods for MT in parenthesis.
Discussion
The study was based on the records of representative dairy goat breeds in Germany and allowed consideration of the first three lactations as different traits. To enhance the present movement towards a common breeding value estimation for dairy goats in Germany and maintain the genetic resources, it is important that all breeders participate. Therefore, it seemed appropriate to include the available data of ‘small’ breeds, for which the amount of data is not sufficient to estimate genetic parameters. Preliminary results (S. Tsurata, B. Zumbach, I. Misztal and K. Peters, unpublished data) showed that the genetic parameters considering all breeds, German Fawn and German White goats differed minimally. The correlation between breeding values of the whole data set and German Fawn or German White goats only, were 0.93 and 0.94, respectively. These results may justify the consideration of different breeds in the analysis. There were no relationships among different breeds (i.e. no crossbred animals). Parameter estimations or genetic evaluations in goats, including different breeds, were also carried out in the United States (Wiggans et al. 1999) and Canada (Sullivan 2000; Weppert & Hayes 2004).
The results obtained with the three models (RPT, RR and MT) were plausible and in agreement, although there were limitations in the data structure with regard to small herd sizes and limited connectedness among herds and breeding societies. RPT delivered average estimates over each of the three lactations. RR and MT parameter estimates decreased from the middle towards the end of each lactation.
Bömkes et al. (2004a,b) estimated genetic parameters on German Fawn and German White Goats separately with a repeatability model over all lactations: Va (0.14) and Vp (0.16) in German White goats were an average of the estimates over the three lactations obtained in this study. For the German Fawn Goat, the most common goat in Germany, the estimates of Va were considerably higher (0.22). Heritability estimates were 0.19 and 0.30 for the German White and Fawn goat, respectively. The differences might be due to the restricted data set and a non-optimal statistical model with regard to the fixed effects and the use of non-orthogonal polynomials. Zumbach et al. (2004) used a six-trait model to estimate variance components of the first lactation for different time periods. In their statistical model, they included herd–year–season as a fixed effect with a minimum group size of 3. This reduced the data set considerably. Heritability estimates throughout the lactation ranged from 0.25 to 0.41. However, genetic correlations among time periods were not plausible. The present study showed that with an adequate statistical model and sufficient data MT, RPT and RR can give reliable estimates.
An overview of literature estimates of heritability and repeatability for milk traits in dairy goats up to 2002 was presented by Olivier et al. (2005). Heritability estimates varied according to breeds and environments. They ranged from 0.14 for Murciano-Granadina goats in the highlands of Spain (Delgado et al. 2006) and Skopelos goats in Greece (Kominakis et al. 2000) to 0.35 for Alpine and Saanen in France (Boichard et al. 1989), Saanen in France (Ilahi et al. 2000), and in New Zealand (Morris et al. 2006). Repeatability estimates were generally about twice as large as the heritability estimates and ranged from 0.30 for Murciano Granadina in Spain (Delgado et al. 2006) to 0.54 for Alpine in France (Ilahi et al. 2000).
We considered the first three lactations as different traits, which is common in dairy cattle genetic evaluation (e.g. Reinhardt et al. 2002). This would involve a genetic evaluation for each lactation, separately. However, the parameters of the third lactation estimated in this study should be considered with caution. The relatively high Va, and consequently the heritability, could be an artefact because of the restricted data set and structure.
Random regression model revealed that genetic parameters were not constant throughout the lactations. The higher Va and heritability in the beginning of the lactation would result in higher genetic response when selecting for the first part of lactation. The relatively high correlations between RR and MT EBVs indicated that such a response could be realized. The use of RR for genetic evaluation of dairy goats has been shown to be feasible under the present breeding structure. Structural improvements through concerted actions of regional goat-breeding societies are indispensable for an efficient breeding programme. These should include implementation of a standardized identification system, a common data bank and systematic utilization of available milk recording data, and a common platform for buck selection (Zumbach & Peters 2007).
Conclusions
Despite the small data set and restricted relationship structure – use of selected males in natural service within herds – the estimates were reasonable with the exception of estimates from the third lactation, which seemed inflated. The results of RPT and the RR averages are similar. So was the pattern of genetic variances and heritability of RR. The MT estimates were in agreement with the RR estimates at different stages of lactation. Judging from genetic parameters estimated with the three models, the results from the RR model seemed to be acceptable. The genetic correlations between lactations ranging from 0.4 to 0.8 suggest that the three lactations can be considered as separate traits. These results suggest that RR models should be used for genetic evaluation of dairy goats in Germany. They have the most potential, especially when only partial records are available. When sufficient data are available, genetic parameters for different breeds should be investigated.


