A cis-acting sequence involved in chromosome segregation in Escherichia coli
Summary
Eukaryotic chromosomes contain a locus, the centromere, at which force is applied to separate replicated chromosomes. A centromere analogue is also found in some bacterial plasmids and chromosomes, although not yet identified in the well-studied Escherichia coli chromosome. We aimed to identify centromere-like sequences in E. coli with the premise that such sequences would be the first to migrate towards the cell poles, away from the cell centre where DNA replication is believed to occur. We have labelled different loci on the chromosome by integrating arrays of binding sites for LacI–EYFP and phage λcI–ECFP and supplying these fusion proteins in trans. Comparison of such pairs of loci suggests the presence of a centromere-like site close to the origin of replication. Polar migration of the site was dependent on migS, a locus recently implicated in chromosome migration, thus providing strong support for migS being the E. coli centromere.
Introduction
Chromosome replication and segregation are the two major steps of chromosome maintenance in growing cells. In contrast to DNA replication, our knowledge of chromosome segregation in bacteria is only beginning to emerge owing largely to recent advances in fluorescent microscopy. These studies have revealed that there is spatial control of chromosome replication and segregation, and that segregation starts concomitantly with replication initiation and does not wait till completion of replication as is the norm in eukaryotes (Sherratt, 2003; Gerdes et al., 2004). In Bacillus subtilis and Escherichia coli, DNA replication initiates at the cell centre and the newly replicated daughter origins move rapidly away from each other towards the cell pole when much of the DNA is still unreplicated. The speed of movement is about an order of magnitude faster than the cell elongation rate, implying an active mechanism for segregation (Gordon et al., 2004). In E. coli, the origins end up in cell quarter positions rather than close to the cell poles. In dividing cells, the terminus region stays at the cell centre during the entire replication period. In Caulobacter crescentus, the replication initiation happens at the flagellated pole of the cell and soon thereafter one of the daughter origins moves to the opposite pole (Jensen et al., 2001; Viollier et al., 2004). These results leave little doubt that there is positional information in bacteria that determines the location of the origin region and that this localization is likely to be one of the events required for proper chromosome segregation. However, the bases for the directional movement of origins and their capture at defined locations are not clear yet. It has been suggested that in B. subtilis and E. coli the act of replication may provide energy to push the origins in opposite directions towards their final destinations (the ‘extrusion–capture’ model; Lemon and Grossman, 2001; Sawitzke and Austin, 2001). This mechanism differs from that in eukaryotes where chromosomes are pulled by their centromeres, rather than pushed from the cell centre in a non-sequence specific manner.
The ‘capture’ portion of the above model suggests that there could be cis-acting sites involved in origin positioning. In B. subtilis, two cis-acting regions in the vicinity of the origin are proposed to position origins at the poles during vegetative growth (Kadoya et al., 2002). The situation is different in sporulating cells of B. subtilis where a newly identified protein, RacA, anchors the origin region to the cell pole using several binding sites distributed over a broad region surrounding the origin (Ben-Yehuda et al., 2003). In E. coli, deletion of the normal origin, oriC, and effecting replication initiation from an ectopically integrated plasmid origin maintains the localization pattern of the region surrounding oriC (Gordon et al., 2002). Additionally, plasmids containing oriC do not localize in a discrete fashion inside the cell (Niki and Hiraga, 1999). These results show that the ‘centromere’ analogue is likely to be in the vicinity of oriC but not at oriC. This prompted us to look for such sequences in E. coli with the premise that a centromere analogue would be the first region to move away from the cell centre, ahead of oriC, although replicating later than oriC.
We developed new tools to differentially mark two nearby loci on the chromosome so that their relative positions can be determined. When four loci at 79′, 84′(oriC), 89′ and 94′ were marked, two at a time, and their locations mapped, the 89′ locus was the most polar of all. Recently, using a different approach, a 25 bp site (migS) near the 89′ locus was shown to influence chromosome (nucleoid) segregation in E. coli (Yamaichi and Niki, 2004). This was inferred from analysing separation of oriC foci in fixed cells. The foci were present in the middle of cells (covering 35–65% of the cell length) about three times more frequently (21.8% in ΔmigS cells compared with 8.7% in wild type). In our assay using live cells, deletion of migS also abolished the preferential polar positioning of the 89′ locus. Since we show an effect of deleting migS using a different assay the locus is likely to play a significant role in determining the polar localization of a region neighbouring the origin. This, in turn, is likely to be part of multiple mechanisms that segregate the chromosome.
Results
Development of tools for cytological analysis
To visualize two loci simultaneously in a single cell, we have used two different fluorescent labels to mark DNA loci. The genes for LacI or phage λcI repressor were fused to genes encoding either EYFP or ECFP. Expression of the operon containing the fusion genes was placed under the control of the PBAD promoter. An array of 64 binding sites for each repressor was integrated at different locations on the E. coli chromosome allowing one site to be fluorescently labelled with EYFP and the other with ECFP (Fig. 1). To eliminate trans-interactions between duplicated arrays (via interactions between the DNA-bound repressors), mutant repressors were exploited. The LacI used was missing 11 carboxyl-terminal residues required for tetramerization (Chen and Matthews, 1992). The λ repressor had the G48S change that strengthens DNA binding and the Y210H change that reduces tetramerization (Nelson and Sauer, 1985; Burz and Ackers, 1994).
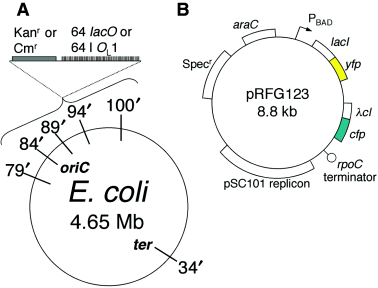
A. Locations of insertions of the lacO array and the λOL1 arrays in the E. coli chromosome map. B. The map of plasmid pRFG123 used to express the LacI and λcI fusion proteins.
The PBAD promoter has been shown to have an all-or-none response at suboptimal inducer concentrations (Khlebnikov et al., 2001). To ensure uniform expression of fusion proteins in a population of cells, the operon encoding the AraFGH arabinose transporter was deleted and the gene for the AraE transporter was placed under a constitutive phage CP18 promoter. The uniformity of fluorescent protein expression, at various suboptimal arabinose concentrations, was confirmed by flow cytometry (data not shown).
The original array of 256 LacI binding sites (Robinett et al., 1996; Lau et al., 2003; Gordon et al., 2004) was found to suffer deletions in E. coli. To avoid this instability, we constructed arrays of lacO and λOL1 binding sites using fewer tandem repeats in each array (Fig. 1): 2, 4, 8, 16, 32 and 64 repeated sites. Most experiments were carried out in a recA mutant host even though it was later found that the arrays were stable in a rec+ host and could be transduced to different strains using phage P1. To determine the sensitivity of the technique, arrays of 16, 32 and 64 lacO sites were inserted into the chromosome close to the origin of replication. The array with 16 operators was visible as a focus by fluorescence microscopy (data not shown), but foci bleached too quickly making them inconvenient for routine use. The arrays of 32 and 64 operators made distinct foci that did not bleach as quickly. The array of 64 operators was selected for further use.
It has been reported that cell growth is impaired when DNA binding proteins fused to fluorescent proteins are expressed in cells which contain their binding site arrays (Lau et al., 2003). Expression of both LacI–EYFP and λcI–ECFP together had no effect on growth of cells containing the operator arrays until inducer concentrations reached 1000 times those used in our experiments (data not shown).
Poleward movement of chromosomal loci
To determine cellular positions of chromosomal loci, different locations around the E. coli chromosome were marked in pair-wise combination with arrays of 64 lacO and λOL1 (TableS1 in Supplementary material). DIC images were taken to detail cell morphology, and phase and fluorescent pictures were overlaid for statistical analysis (Fig. 2; Fig.S1 in Supplementary material). The X and Y co-ordinates for each focus and the cell poles were acquired, and the position of each focus relative to the cell poles was determined (Fig. 3). Measurements were made from the pole closest to the nearest focus. To measure the extent by which one focus leads or trails another differently tagged focus in cells with two of each kind, we paired the focus closest to a pole with the closest differently tagged focus and calculated the distance between them as a proportion of cell length. The difference between the remaining pair was similarly expressed. Cells with two foci of one colour and one of the other (two to one) or two of each colour (two to two) accounted for roughly 50% of the cells. The remaining 50% of the cells contained variable numbers of foci, such as one of each or three or more of a particular focus, and were not considered as they may contain none or more than one replication factory, making their accounting irrelevant or too complicated. Detailed analysis of the positions of foci in cells labelled at different loci with patterns of two to one or two to two follows.
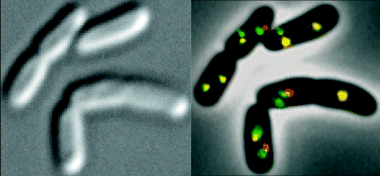
Photomicrographs of E. coli containing insertions at oriC and 89′ loci. Left. A DIC image. Right. A phase contrast image overlaid with images of λcI–ECFP labelling 89′ (pseudo-coloured green) and LacI–EYFP labelling oriC (pseudo-coloured red). Colocalization of red and green appear yellow.
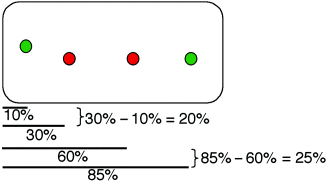
Calculation of distances between two loci as percentages of cell length. Measurements were made from the pole closest to a focus.
oriC and ter. To test the functioning of our new system, the lacO array was inserted near oriC and the λOL1 array near the terminus of replication (ter) approximately at map positions 84′ and 34′ respectively (Fig. 1). These two loci were chosen because they had been previously mapped using fluorescent microscopy (Li et al., 2002; Lau et al., 2003). The oriC was most often found at the cell centre in cells containing a single oriC focus (Fig. 4A and B). In cells containing multiple oriC foci, they were widely distributed, but typically present at cell quarter positions in medium-sized cells, eighth positions in the largest cells and not at the cell poles (Fig. 4B). Most cells contained a single ter focus that was most often located at the pole in small cells or near the cell centre in larger cells. Cells occasionally contained two ter foci, usually located at the cell quarter positions, and rarely more than two. There was a correlation between the number of oriC foci and cell size. Cells with a single oriC focus generally ranged in size from 0.8 to 1.5 µm, cells with two oriC foci ranged in size from 1 to 2.3 µm, cells with three oriC foci ranged in size from 1.2 to 2.5 µm, and cells with four oriC foci ranged in size from 1.5 to 2.9 µm. Overall, these results agreed with those previously published (Li et al., 2002; Lau et al., 2003), and confirmed the reliability of our technique. This encouraged us to map closely linked loci and to determine which locus moves away from the cell centre first.
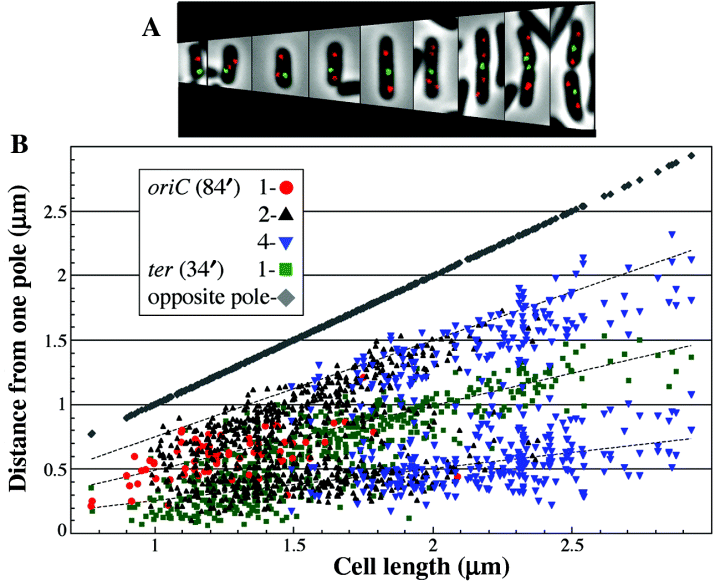
Cellular positioning of oriC and ter. A. Phase images of cells of various lengths overlaid with images of LacI–EYFP foci (marking oriC, 84′) and λcI–ECFP foci (marking ter, 34′). B. Positions of foci in cells containing 1 ter and 1, 2 or 4 oriC. Dotted lines mark the cell quarter and half positions.
oriC and 89′. In order to compare movements of oriC and the 89′ locus, the lacO array was inserted near oriC and the λOL1 array near the 89′ locus (Fig. 1). When the fusion proteins were expressed, more cells contained a single oriC focus and two 89′ foci rather than two oriC foci and a single 89′ focus (9.9% and 1.9%, respectively; Table 1). A few cells are shown in Fig. 2 and a representative field is shown in Fig.S1 in Supplementary material. As oriC is the first locus to replicate, our results suggest that the duplicated oriC remains paired even after replication and separation of the duplicated 89′ loci. We also found that quite frequently the oriC focus was between the two 89′ foci, suggesting bidirectional movement of the 89′ loci (Fig.S1 in Supplementary material).
 |
 |
 |
||||
| Loci | Total No. of cells in field | No. of cells with 2A : 2B foci (% of total) | No. of cells with 2A : 1B foci (% of total) | No. of cells with 1A : 2B foci (% of total) | ||
|---|---|---|---|---|---|---|
| A | B | |||||
| oriC | ter | 974 | 25 (2.6) | 371 (38.1) | > | 9 (0.9) |
| oriC | 89′ | 2144 | 690 (32.2) | 41 (1.9) | < | 213 (9.9) |
| oriC | 79′ | 808 | 217 (26.9) | 37 (4.6) | > | 9 (1.1) |
| oriC | 94′ | 1811 | 473 (26.1) | 224 (12.4) | > | 46 (2.5) |
| 89′ | 79′ | 1573 | 523 (33.2) | 35 (2.2) | < | 80 (5.1) |
| 89′ | 94′ | 1347 | 473 (35.1) | 34 (2.5) | > | 7 (0.5) |
| migS deletion | ||||||
| oriC | 89′ | 1116 | 312 (28.0) | 73 (6.5) | > | 50 (4.5) |
The largest class of cells had two oriC and two 89′ foci (32.2% of total; Table 1). The relative positions of the foci in this class were analysed quantitatively (Fig. 5A). To test the expectation that the locus migrating from the cell centre first would also be closest to the cell pole, we measured the cellular position of each focus from the cell pole and calculated the difference for each pair of foci (Fig. 3). For example, if focus ‘a’ is at cellular positions 10% and 85%, and focus ‘b’ is at cellular positions 30% and 60%, then ‘a’ is 20% and 25% polar to ‘b’. To simplify analysis, differences were binned into ranges of 5%; they are shown as an inset in Fig. 5A. The inset graph indicates that when oriC and 89′ are in the same half of the cell then the 89′ locus is more polar (67% of time) suggesting that the 89′ locus leads oriC away from the cell centre and may thus qualify as a centromere-like site.
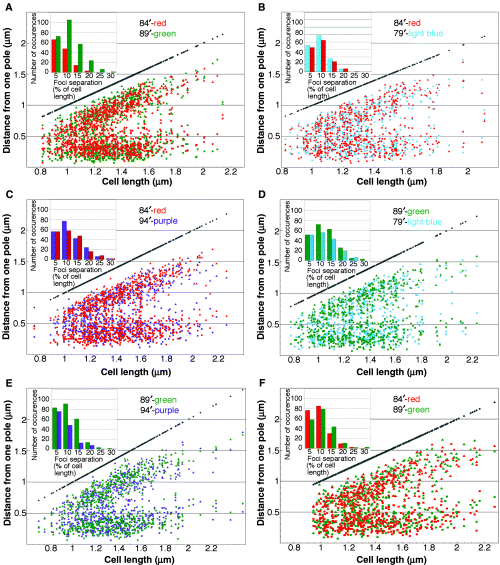
Positions of foci in cells with two foci of each colour marking two of the following: 84′– red, 89′– green, 79′– light blue and 94′– purple. Insets graph the difference in relative cellular position of the two types of foci (normalized to 200 cells, actual number of cells are shown in Table 1). The method for calculating the difference is illustrated in Fig. 3, and data were binned into 5% of cell length for graphing.
oriC and 79′, oriC and 94′. When foci were analysed from cells containing the lacO array inserted near oriC (at 84′) and the λOL1 array was inserted at the 79′ or the 94′ locus, the position of oriC relative to these two loci was ambiguous. In cells with three foci, those having two oriC foci and a single 79′ or 94′ focus (4.6% or 12.4%, respectively; Table 1) were more numerous than those containing a single oriC and two 79′ or two 94′ foci (1.1% or 2.5%, respectively; Table 1). This suggests that replicated oriCs separated before the replicated 79′ or 94′ loci did, or that these two loci had not replicated by the time that separation of oriC loci was observed. The 79′ locus is expected to replicate at approximately the same time as the 89′ locus, both being equidistant from oriC. The different timing of migration of 79′ and 89′ loci with respect to oriC suggests that oriC sequestration (Hiraga, 2002) is not the cause of 89′ migrating ahead of oriC.
A plot of the positions of the foci in cells containing two oriC and two 79′ or 94′ foci (Fig. 5B and C, respectively) shows that 53% of the pairs had both 79′ or 94′ foci polar to oriC foci, suggesting that there is no preferential positioning of the oriC with respect to the 79′ and 94′ loci. As oriC preferentially locates at the one quarter and three quarter positions (Sherratt, 2003), the absence of positional preference with respect to oriC may mean that the 79′ and 94′ loci have no positional preference within the cell, producing the 50 : 50 distribution seen with these strains. In any event, these results gave no indication of a centromere-like sequence at either 79′ or 94′.
89′and 79′, 89′and 94′. To further characterize the positioning of the 89′ locus with respect to the 79′ and 94′ loci, the lacO array was inserted near 89′ in strains containing the λOL1 array near 79′ or 94′. We expected that if a domain near 89′ was responsible for initiating chromosome partitioning, then in cells with two 89′ and two 79′ or 94′ foci the 89′ locus would be polar to both the 79′ and 94′ foci and in cells with three foci, the majority would have two 89′ loci.
The expected two to one pattern was seen for the 89′ and 94′ pair (Table 1). A larger number of cells containing two 89′ foci and one 94′ focus (2.5%) were observed compared with cells containing one 89′ focus and two 94′ foci (0.5%). When the positions of foci in cells with two of each focus were analysed and plotted (Fig. 5E) and their differences calculated (inset in Fig. 5E), we found that 64% of the time the 89′ locus was polar to the 94′ locus. These results are consistent with the notion that the 89′ locus moves away from the cell centre first.
The pattern was ambiguous for the 89′ and 79′ pair. In cells with three foci, 2.5% of cells had two 89′ foci and one 79′ focus, whereas 5% of cells had a single 89′ focus and two 79′ foci (Table 1). In cells with four foci, however, 55% of the time the 89′ locus was ahead. The lack of a clear bias in the polar positioning of the 89′ and 79′ loci pair is the only result at odds with our inference on the centromeric status of the 89′ locus.
Relation of migS to the centromere-like function of 89′
During the course of this work, Yamaichi and Niki (2004) reported that a 25 bp inverted repeat sequence (migS) located at 89.1′ participates in chromosome segregation in E. coli. To test whether migS might be responsible for the polar movement of the 89′ region, we analysed the effect of deleting the migS sequence on the positioning of oriC and the 89′ locus.
The entire open reading frame of yijF (containing migS) was deleted in the strain already containing the lacO array at oriC and the λOL1 array at the 89′ locus (≈ 3.5 kb from yijF). The frequency of cells containing two 89′ loci and a single oriC decreased from 9.9% to 4.5% (Table 1). The frequency of cells containing a single 89′ locus and two oriC also increased reciprocally from 1.9% to 6.5%. Among cells containing two oriC and two 89′ loci (Fig. 5F and inset), the previous bias towards a polar 89′ was also abolished: ≈ 50% of the time oriC was polar and 50% of the time the 89′ locus was polar (as with oriC and 79′ or 94′ loci). These data suggest that the deleted region of yijF is required for polar localization of the 89′ locus.
In the above four foci cells the position of oriC was not significantly affected even though migS was deleted (Fig. 6), suggesting that the 89′ locus was randomly located with respect to oriC. In wild-type cells containing two oriC loci and two 89′ loci, the oriC loci were localized to an average position of 26.3 ± 9.2% and 66.7 ± 10.7% of cell length. When migS was deleted, the average positions of the oriC loci were 25.2 ± 9.6% and 64.1 ± 10.1% of cell length.
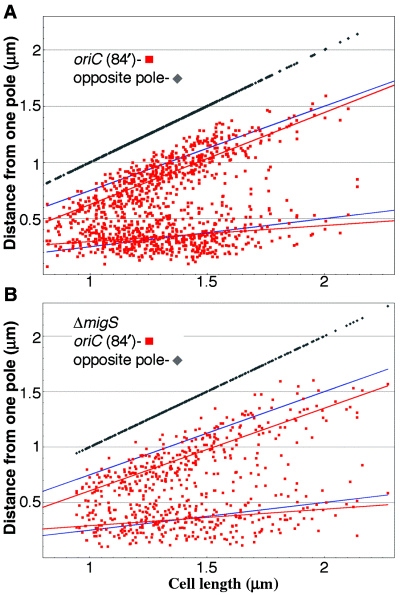
Positions of oriC in cells with two oriC and two 89′ foci. Blue and red lines mark the cellular quarter positions and the average oriC positions respectively. A. Cells with migS present. B. Cells with migS deleted.
To determine whether deletion of migS affected growth rate, doubling times of the migS deletion mutant and its isogenic wild-type strain were compared in minimal and rich media, and at 30°C and 37°C (data not shown). Deletion of migS caused a slight decrease in growth rate during log phase (doubling times were 31 min at 37°C in LB in the mutant compared with 29 min in the wild type). The deletion also increased the number of nucleoid-free cells by 2% (going from 10% to 12% when approximately 3500 cells of each were scored; the high number of nucleoid-free cells in wild type most probably results from the presence of recA1 mutation in all of our strains). Therefore, the role migS plays in chromosome segregation appears to be required for optimal cell growth. The strain lacking migS was also more sensitive to the DNA damaging drug Zeocin (Invitrogen). At high Zeocin concentrations, the deletion strain had up to 20% more nucleoid-free cells compared with the wild type.
Homologues of migS
A sequence that is 100% homologous to migS was found in two different Shigella flexneri strains (2a str. 301 and 2a str. 2457T). Interestingly, like E. coli, S. flexneri does not have any homologues of plasmid partition proteins (ParA, ParB, ParM, ParR). Additionally, S. flexneri 2a str. 301 contains a frame shift mutation in codon 55 of the 205 codon open reading frame of yijF, and S. flexneri 2a str. 2457T contains a deletion of the amino-terminal 58 codons of yijF, suggesting that the open reading frame is not required in S. flexneri.
Two other sequenced strains of E. coli (OH157 : H7 and CFT073) also contain migS sequences but with two base changes compared with E. coli K-12 (MG1655). One of the changes is shared by the two strains. The functioning of these sites and the interacting components of migS remains to be identified.
Discussion
Using fluorescent tags that allow two DNA loci in individual E. coli cells to be visualized simultaneously, we find that the 89′ region of the chromosome tends to be more polar than the three other loci in its vicinity including the origin of replication (oriC) at 84′. This suggests that the 89′ region may be the first to move from the cell centre and thus may contain a centromeric site. We also find that a previously identified 25 bp sequence, migS, located at 89.1′ and implicated in chromosome segregation, is necessary for the polar segregation of the 89′ locus. Thus migS could be the E. coli centromere.
The chromosomal loci were mapped using LacI–EYFP and λcI–ECFP fusion proteins bound to lacO and λOL1 arrays. The arrays were placed at intervals of 5′ (233 kb) on the chromosome and were easily resolved from each other under the fluorescent microscope. We believe that with our technique, discrimination of foci separated by even smaller distances should be possible. We first demonstrated the validity of this technique with cells in which the oriC and ter, the terminus of replication, were simultaneously tagged. Our results, obtained using a recA mutant, are consistent with previously published data obtained by using recA+ hosts that showed that the oriC moves from the cell centre to the quarter positions while the ter lingers in the cell centre until septation is almost complete (Li et al., 2002; Lau et al., 2003).
When positions of four loci at 79′, 84′, 89′ and 94′ were mapped in a pair-wise combination, the 89′ locus was most polar relative to others. The 84′ locus, being closest to the origin of replication, replicates first and could be expected to separate before other loci and move towards the pole. Their retardation relative to the daughter 89′ loci suggests that either the 89′ loci are actively pulled or pushed from the cell centre or the oriC loci are temporarily prevented from separating after replication. Sequestration of oriC by SeqA after replication (Lu et al., 1994) could be responsible for holding the origins near the cell centre longer than the 89′ locus. As oriC did not trail the 79′ locus as markedly as the 89′ locus (which are equidistant from oriC but on opposite sides), we do not favour sequestration as the main reason for the polar positioning of the 89′ locus. The requirement of migS for 89′ localization further supports this view. An active mechanism for migration of the 89′ locus mediated by migS seems to describe our results best.
An exception to the polar positioning of the 89′ locus was found when the 89′ and 79′ pair was analysed. The 89′ locus was not ahead of the 79′ locus in cells with three foci (Table 1) and was only marginally ahead in cells with four foci (Fig. 5D). The relative positions of the 79′ locus and oriC also differed only slightly and inconsistently. oriC was ahead in three foci cells (Table 1) and 79′ was slightly ahead in cells with four foci (Fig. 5B). Therefore, we cannot exclude the possibility that there could be a second centromeric sequence near the 79′ locus, although, oriC sequestration could be causing it to trail 79′.
The deletion of migS caused a minor disturbance in the mean positioning of oriC (Fig. 6). Yamaichi and Niki (2004) identified migS on the basis that the distribution of oriCs overlap more upon migS deletion. In our view their data also suggest that the mean oriC positioning remains essentially unchanged upon migS deletion. It is believed that multiple mechanisms contribute to chromosome segregation: localization to a replication factory (Koppes et al., 1999), replication which may orient and push the origins in opposite directions (Dingman, 1974), sequestration of the origin by SeqA and binding of SeqA to newly replicated hemimethylated DNA near replication forks (Slater et al., 1995), condensation of the chromosome by negative superhelicity, MukB and CspE (Hu et al., 1996; Mangoli et al., 2001; Nordstrom and Dasgupta, 2001), transertion which is the co-transcription/translation/insertion of proteins into the membrane (Norris, 1995; Woldringh et al., 1995), and bipolar migration mediated by migS (Yamaichi and Niki, 2004). A defect in any one step may therefore not have strong effects on chromosome segregation and cell viability, while combining defects may. For example, a Δ(mukBmigS) strain shows a stronger phenotype than the strains with individual deletions (Yamaichi and Niki, 2004). Without the help of migS, the oriC could be left to move freely until localized by another system, such as the replication factory. This would explain the minimal effect of deleting migS upon oriC localization seen here, and support the view that E. coli has several mechanisms that can accomplish the important task of chromosome segregation.
Experimental procedures
Bacterial strains and plasmids
All bacterial strains used in this study are derivatives of the recA1 strain Stbl2 (Invitrogen; TableS1 in Supplementary material), in which direct DNA repeats are reported to be stable. All modifications to the chromosome were performed using the λ Red system (Datsenko and Wanner, 2000). The plasmid pKD46 was used to supply λ Red proteins and pCP20 was used to supply the Flp recombinase protein.
To ensure homogeneous cell-to-cell expression of genes under the control of the Pbad promoter in the Stbl2 strain, the araFGH operon was deleted, and araE gene put under the constitutive PCP18 promoter (Khlebnikov et al., 2001). BW27269 and BW27750 (respectively) were used as templates to obtain polymerase chain reaction (PCR) products containing the respective mutations and the kanamycin markers flanked by flp recombinase sites. They were then integrated into the chromosome of the Stbl2 strain and the kanamycin resistance genes were then removed using Flp recombinase. Expression patterns were tested by flow cytometry using a FACS Vantage SE with DiVa option and DiVa software (BD Biosciences).
The lacO operator array was made by annealing two oligonucleotides to form a duplex containing two tandemly repeated LacI binding sites and inserted into pUC19 (New England Biolabs). Amplification to give arrays of 2, 4, 8, 16, 32 and 64 binding sites was performed using unique SalI and XhoI restriction sites on opposite ends of the arrays as described (Robinett et al., 1996). The λOL1 operator arrays were made in the same manner and cloned in pACYC184 (New England Biolabs). Genes providing resistance to chloramphenicol or kanamycin were cloned next to the operators. For chromosomal integration, primers (Sigma-Genosys) were designed to contain between 38 and 45 bases of homology to the plasmids containing the arrays and approximately 50 bases of homology to the chromosome. PCRs to amplify the operators with their respective antibiotic resistance gene were performed using puReTaq Ready-To-Go PCR beads (Amersham Biosciences). Products were isolated from agarose gels using MinElute Gel Extraction Kit (Qiagen) and used to transform by electroporation cells carrying pKD46 (Datsenko and Wanner, 2000) prepared in 0.2% arabinose.
Expression plasmids were constructed by fusing the genes for LacI and λcI to the genes for EYFP and ECFP (Clontech) and placing them under the PBAD promoter in pBAD24 (Invitrogen). The gene encoding LacI was amplified from pSG20 (Gordon et al., 1997) and fused to the amino-terminus of the fluorescent proteins. The gene for λcI with the Y210H change was amplified from JL6309 (kindly provided by John Little) using primers which introduced additionally the mutation G48S. The λcI and LacI fusion genes were then linked to form a single operon with a spacer of 47 bp. Using Western blotting (Living Colors A.v. peptide antibody, Clonetech) and flow cytometry, this arrangement was found to allow equal expression of both fusion proteins. A fragment comprising the fused genes, PBAD promoter, and araC was cloned into pGB2 whose replicon is that of pSC101 (Churchward et al., 1984). A rpoC terminator was placed at the end of the operon to restrain transcript elongation into the origin of replication (pRFG123, Fig. 1).
Microscopy and data analysis
All microscopy was performed on an Eclipse E1000 microscope (Nikon), using a Sensicam QE CCD camera (Cooke Corporation) controlled by IP Laboratories software (Scanalytics).
For statistical analysis, cells containing an expression plasmid and operator arrays integrated into the chromosome were grown overnight at 30°C in LB containing antibiotics, diluted 100-fold in the same medium, grown for 2 h at 30°C, induced with varying levels of arabinose for 2 h and then pelleted in a microfuge at 3000 r.p.m. for 3 min. Cells were resuspended in 50 mM Hepes, pH 7.6, at a final OD600 of approximately 20. When required, the DNA stain Hoechst 33342 (Molecular Probes) was added to a final concentration of 50 µg ml−1 and the cells were allowed to sit at room temperature for 10 min. Approximately 3 µl of cells were then placed on a slide and overlaid with a coverslip treated with poly- l-lysine (Sigma Diagnostics).
Image J (Wayne Rasband, [email protected]) using a customized script was employed to determine foci co-ordinates, and a program was written to determine focus-to-focus and focus-to-pole distances.
Acknowledgements
We thank John Little for mutant λcI genes, Barry Wanner for stains containing modifications to the araE and araFGH genes, Wayne Rasband for writing Image J and its scripts, and Michael Yarmolinsky and Christie A. Fekete for encouragement and critical reading of the manuscript.
Supplementary material
The following material is available from http://www.blackwellpublishing.com/products/journals/suppmat/mmi/mmi4392/mmi4392sm.htm
Fig. S1. Photomicrographs of E. coli containing insertions at oriC and 89′ loci.
Table S1. Strains and plasmids used in this study.


