Cell size and nucleoid organization of engineered Escherichia coli cells with a reduced genome
Summary
The minimization of a genome is necessary to identify experimentally the minimal gene set that contains only those genes that are essential and sufficient to sustain a functioning cell. Recent developments in genetic techniques have made it possible to generate bacteria with a markedly reduced genome. We developed a simple system for formation of markerless chromosomal deletions, and constructed and characterized a series of large-scale chromosomal deletion mutants of Escherichia coli that lack between 2.4 and 29.7% of the parental chromosome. Combining deletion mutations changes cell length and width, and the mutant cells with larger deletions were even longer and wider than the parental cells. The nucleoid organization of the mutants is also changed: the nucleoids occur as multiple small nucleoids and are localized peripherally near the envelope. Inhibition of translation causes them to condense into one or two packed nucleoids, suggesting that the coupling of transcription and translation of membrane proteins peripherally localizes chromosomes. Because these phenotypes are similar to those of spherical cells, those may be a consequence of the morphological change. Based on the nucleoid localization observed with these mutants, we discuss the cellular nucleoid dynamics.
Introduction
Identification of the minimal gene set and clarification of the functions of these genes would improve our understanding of the mechanism of cell proliferation. A study of the orthologues that are shared by the genomes of two microorganisms represented the first step taken towards this goal (Mushegian and Koonin, 1996), but a more extensive analysis of numerous sequenced genomes has revealed that the minimal gene set is not defined by the orthologues that are common to all living creatures (Koonin, 2003). To define experimentally the minimal gene set, various approaches have been made (Koonin, 2003; Smalley et al., 2003). One is the systematic disruption of each gene in the genome. Such experiments revealed that the eukaryote Saccharomyces cerevisiae has 1105 essential genes (Giaever et al., 2002) but that the prokaryote Bacillus subtilis has only 271 essential genes (Kobayashi et al., 2003). However, this method is also limited as it fails to take into account essential functions that are mediated in a redundant fashion by more than one gene. In other words, if two redundant genes are involved in an essential step, these genes will both be identified by this method as non-essential genes when at least one should be included in the minimal gene set. Thus, the set of essential genes identified by the gene-disruption method may not be the complete minimal gene set. Yet another strategy to define the minimal gene set is to experimentally reduce the size of the genome (Kolisnychenko et al., 2002; Yu et al., 2002; Goryshin et al., 2003). Analyses of bacterial genomes containing large-scale deletions have been started recently, but the deletions made to date have not been big enough to identify the minimal gene set, and the engineered bacteria have not been well characterized, especially with respect to the effects of genome reduction on cell morphology and chromosome structure (Kolisnychenko et al., 2002; Yu et al., 2002; Goryshin et al., 2003).
In eubacteria, a major determinant of cell shape is the peptidoglycan (PG) layer of the cell wall. Peptidoglycan is built from long glycan strands, which are cross-linked by short peptides. The precursor for PG synthesis is a disaccharide pentapeptide. That is synthesized in the cytosol and transferred to the outside of the inner membrane. Penicillin binding proteins (PBPs) add precursors to the existing high molecular weight PG by transglycosylation and transpeptidation (Goffin and Ghuysen, 1998; Holtje, 1998). Recently, the broadly conserved morphogenes, mreB and mreB-homologue, mbl, were shown to encode actin homologues, which could assemble into filamentous helical structures, in B. subtilis (van den Ent et al., 2001; Jones et al. 2001; Carballido-Lopez and Errington, 2003). These helical cables comprise cytoskeletal elements. These results indicate that the cytoskeletal elements also play a direct role in cell shape determination. The mechanisms by which these cytoskeletal elements control the topology of PG synthesis have not been clarified. In B. subtilis, the cylindrical part of the cell wall is synthesized in a helical pattern governed by the Mbl protein, but there also a few rod-shaped bacteria, which have no MreB system, suggesting that the cellular morphology may be controlled by diverse molecular strategies (Daniel and Errington, 2003).
Bacterial chromosomes are not compartmentalized within a membrane-bound structure, unlike eukaryotic chromosomes. Nevertheless, the bacterial genome is not uniformly diffused throughout the cell; rather, it forms a nucleus-like structure known as the nucleoid. The mechanisms that control nucleoid organization and its changes have not been clarified. Normally, chromosomes assembled into one or two nucleoids in the middle of the cell, although the nucleoid DNA is somewhat spread out around the cell periphery, perhaps as a result of a process called ‘transertion’, which is the cotranscriptional translation and translocation of membrane proteins (Woldringh et al., 1990; Norris, 1995; Woldringh, 2002). However, when an inhibitor of protein synthesis is added to the cell, it causes the chromosomes to condense into packed nucleoids, with the number of packed nucleoids being equal to the number of replicated chromosomes. When there is only one packed nucleoid, it locates at the cell center. In contrast, when there are two nucleoids, they locate half a cell length apart at the cell quarters. It has been proposed on the basis of these results that replicated nucleoids rapidly separate by half a cell length within a few minutes of the completion of replication (Donachie and Begg, 1989a; Hiraga et al., 1990; Donachie, 2001), although there is another explanation for the results (Roos et al., 2001).
With regard to the mechanism that drives the bacterial chromosome segregation (for review see Wake and Errington, 1995; Hiraga, 2000; Draper and Gober, 2002), many models have been proposed. Especially, recent studies suggest that DNA polymerase is anchored in place like a factory, and based on these results the extrusion-capture model was proposed (Lemon and Grossman, 1998; 2000; 2001). This model proposes that newly replicated DNA is fed from the fixed replication factory towards the cell poles, causing the new chromosomes to form in each cell half. Another experimental results that the newly replicated origins cohere to each other suggest the sister chromosome cohesion model (Hiraga et al., 2000; Sunako et al., 2001; Hiraga, 2002). In this model, the replicated chromosomal regions remain paired until late in the replication cycle, at which stage the entire chromosomes segregate together. Thus, the difference between the two models is that the first proposes that the replicated DNA segregates progressively, while the second suggests that the DNA segregates as an entire unit (Li et al., 2002).
The organization of the nucleoid and how it changes in bacteria that are grown at high rates, where multiple replication cycles overlap, are also not clear at this point. There are several possibilities. One is that each replicated part of the chromosome forms a single nucleoid and many ‘small nucleoids’ segregate independently. Another possibility is that the chromosomes that contain several newly replicated origins of replication assemble into two ‘large nucleoids’, which then behave as ‘segregation units’. With wild-type bacteria, it is difficult to observe their nucleoid organization and dynamics because the chromosomal DNA is diffuse, perhaps as a result of transertion. Thus, our understanding of nucleoids may depend largely on studying mutant bacteria, in which nucleoid dynamics can be observed.
We are currently constructing large-scale chromosomal deletion mutants of Escherichia coli to identify its minimal gene set. Here we describe the construction of a series of the mutants. Their characterization revealed that the cell size and nucleoid organization are changed in these mutants. Abnormal localization of the mutant nucleoids enables us to speculate the nucleoid dynamics during cell cycle.
Results
Construction of the large-scale deletion mutants
We constructed two series of chromosome deletion mutants. Before their construction, we classified each E. coli gene as ‘essential’, ‘non-essential’, or ‘unknown’ according to the published literature. The results of this classification are shown in the Profiling of E. coli Chromosome (PEC) database (http://shigen.lab.nig.ac.jp/ecoli/pec/). It is difficult to judge the essentiality of the genes from reports based on various types of experimental methods; thus, we first established a set of criteria that we used to classify the E. coli genes. These criteria are described in PEC. On the basis of our classification, we designed our first series of 163 deletion derivatives. This series is denoted the MD (medium-scale deletions) series, and its deletions cover most of the chromosomal regions, except for those containing known essential genes and those that have been deleted in the 20 long deletion mutations isolated previously (Supplementary material, Table S1 and the PEC database). We then successfully constructed 75 MD deletion mutants using the E. coli homologous recombination system (Experimental procedures, Supplementary material, Fig. S1 and Tables S2 and S3).
Based on these results, we predicted which long regions could be deleted and constructed the long deletion units, termed the LD (large-scale deletion) series. To construct these deletions, we developed the ‘CRS cassette method’, which uses the red recombination system of phage lambda (Fig. 1 and Supplementary material, Fig.S2). Using this method, we constructed markerless deletion mutations (Supplementary material, TableS4). A marker gene is needed for the construction and combination of deletion mutations. However, in the course of combining multiple deletion units to reduce a genome, a single-marker gene, which is replaced with the deleted region, can be used only for the first selection. Moreover, when many copies of marker genes remain on a chromosome, this could lead to secondary DNA rearrangements. For these reasons, we believe that the markerless type of deletion mutation approach is the best for combining deletion mutations. In the CRS cassette method, two types of strains are constructed for a single deletion mutation. One strain is constructed by replacing the chromosomal region with the CRS cassette by using a positive-selection marker (CmR) of this cassette. This inserted cassette is removed by using two negative-selection markers (sacB+ and rpsL+) to construct the other strain. These two types of strains are then used to combine the deletion units. The deletion unit is transferred by transduction with the P1 phages prepared from the former strain (with CRS cassette) using the positive-selection markers. Next, the cassette is removed by transduction with the P1 phage prepared from the latter strain (without CRS cassette) using the negative-selection markers. In other words, the strains, in which the CRS cassette is removed, are selected as those resistant to both streptomycin and sucrose. We used this method to construct 16 deletion units and then combined them in a cumulative manner to construct the Δ1-16 series of LD mutants (Fig. 2). The exception to the cumulative pattern of LD construction was that when the deletion unit 13 was added to generate the Δ13 mutant, the deletion unit 16-2 (which was added in the construction of Δ7) was replaced with the corresponding intact region. As a result, the Δ13 mutant has lost only 816 kb of genome sequence compared to the preceding mutant in the series, Δ12, which has lost 821 kb. As a result of the cumulative deletion of the units, the Δ1 mutant lacks 2.4% of the wild-type chromosome (0.11 Mb), while the Δ16 mutant, which has the largest number of deletions, lacks 29.7% (1.38 Mb). The deletions in all the mutants were verified by pulsed-field gel electrophoresis (PFGE) (Fig. 3) and hybridization with DNA arrays (Fig. 4). In the PFGE analysis, all of the NotI and XbaI sites, except for one XbaI site within the deletion unit 4, could be detected.
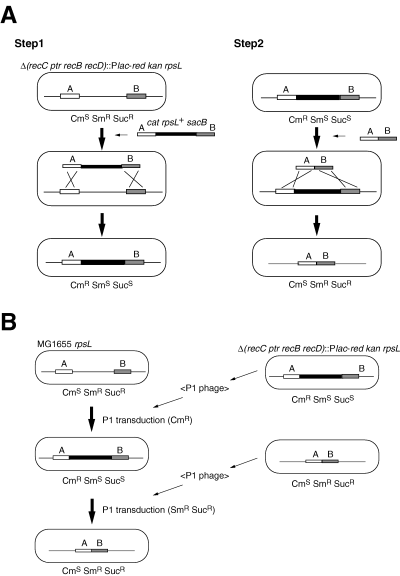
Large-scale deletion (LD) mutant construction. The solid bar shows the CRS cassette (see LD mutant construction in Experimental procedures). A. The construction of deletion units by the CRS cassette method. B. The combination of the deletion units.
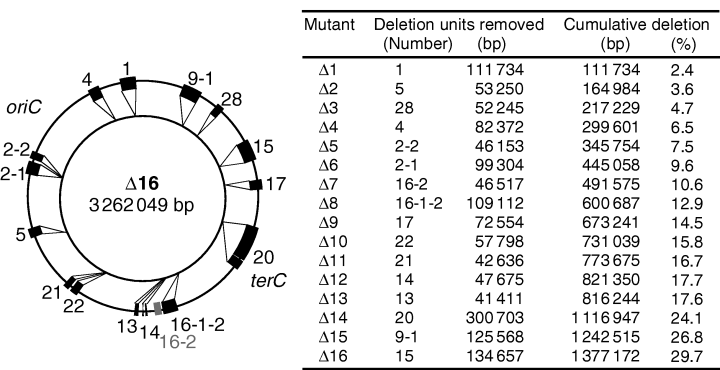
Units deleted in the construction of the large-scale deletion (LD) series. The outer and inner circles represent the genomes of MG1655 and the largest deletion mutant (Δ16), respectively. The closed boxes labelled with numbers indicate the sequences that were deleted. oriC and terC show the map position of origin and terminus of replication, respectively. Note that the construction of the Δ13 mutant (where unit 13 was deleted) was accompanied with the reconstitution of the unit 16-2 region (which is shown in gray and was deleted in the construction of the Δ7 mutant) with the intact wild-type region. Consequently, the Δ7–Δ12 mutants have the unit 16-2 region, while the Δ13–Δ16 mutants lack it.
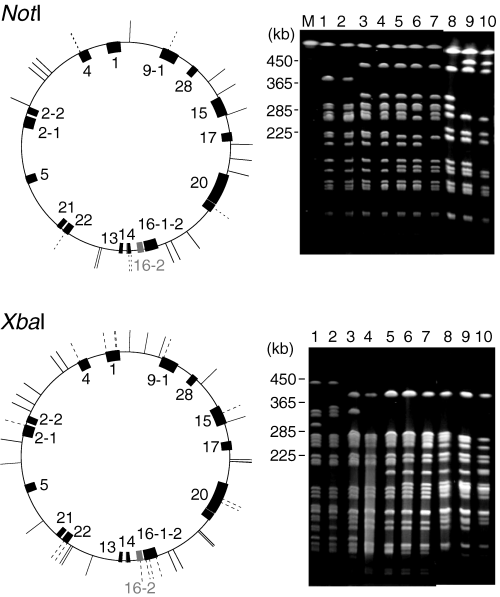
Pulsed-field gel electrophoresis (PFGE) analysis of the deletion mutants. Chromosomal DNA was digested to completion with NotI or XbaI and analysed by PFGE. The DNA was visualized by ethidium bromide staining and UV irradiation. The patterns for MG1655 match those predicted from the genome sequence except for an XbaI site at 4 308 141. The shifts in the band position of DNA prepared from the deletion strains conform to all predictions, except for the restoration of the unit 16-2 region during the construction of deletion strain Δ13 and the absence of the XbaI site from deletion unit 4 as described above. The lines outside the circles that represent the chromosome indicate the positions of the NotI or XbaI sites. The dotted lines show the sites that were lost when the deletion units were combined. Lane 1, MG1655 rpsL; lane 2, Δ1; lane 3, Δ6; lane 4, Δ8; lane 5, Δ9; lane 6, Δ11; lane 7, Δ13; lane 8, Δ14; lane 9, Δ15; lane 10, Δ16; M, DNA size marker (Saccharomyces cerevisiae chromosomal DNA).
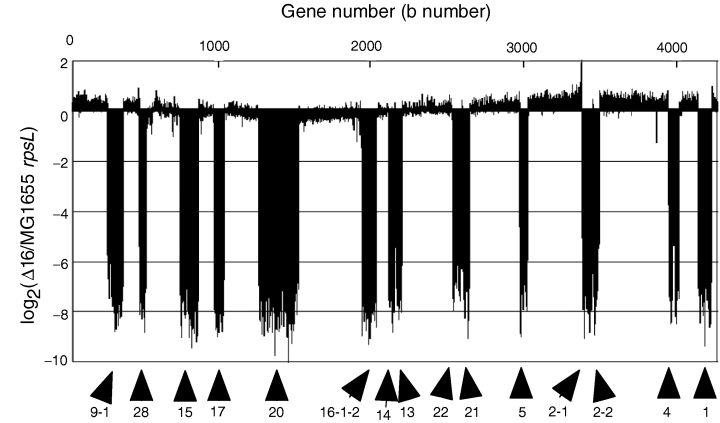
Microarray map of the deletions in the Δ16 mutant. Each bar represents the log ratio of normalized signal intensities for a particular open reading frame (ORF) from the deletion strain relative to its parental strain.
Cell growth and cell shape
We first examined the growth of the mutant strains. The deletion mutants and their parental strain were inoculated from a log or early stationary phase culture and grown in Antibiotic Medium 3, which contains 0.1% dextrose, at 37°C with vigorous shaking. The optical densities were measured and the generation time was calculated (Table 1). The mutants with large deletions grew more slowly than did the parental strain. With regard to preference for culture media, the mutants, especially those with larger deletions, grew better in Antibiotic Medium 3 than in LB medium (data not shown). The MG1655 strain grows somewhat slower in Antibiotic Medium 3 than in LB, but the growth of the mutants with larger deletions is much worse in LB than that of the parental strain in LB.
| Strain | Generation time (min) |
|---|---|
| MG 1655 rpsL | 26.2 |
| Δ1 | 29.4 |
| Δ2 | 29.5 |
| Δ3 | 30.6 |
| Δ4 | 31.4 |
| Δ5 | 29.0 |
| Δ6 | 29.3 |
| Δ7 | 30.5 |
| Δ8 | 33.7 |
| Δ9 | 32.9 |
| Δ10 | 30.9 |
| Δ11 | 33.6 |
| Δ12 | 34.1 |
| Δ13 | 35.2 |
| Δ14 | 39.1 |
| Δ15 | 44.8 |
| Δ16 | 45.4 |
Microscopic observation showed that the cell shape of the mutants was also altered (Fig. 5). After the addition of unit 2-1 to construct the mutant Δ6, the cells of Δ6 and subsequent mutants gradually widened and shortened compared to the parental cells. However, after unit 13 was added to construct Δ13, the cells lengthened again. Thus, the gene that is responsible for the cell length or/and growth rate appears to be contained within the chromosomal region of the deletion unit 13. It is also suggested from the result that the mutant with the deletion unit 13 alone is larger and wider than the parental cells (Fig. 5B, b, lane 14). The mutant cells with larger deletions (Δ14–16), all of which have the deletion unit 13, were also longer and wider than the parental cells. As shown in Fig. 5B, b, lanes 8, 9 and 13, the cell size of the other mutants with individual deletion units were somewhat changed; there may be responsible genes in the regions of those deletion units. But many individual deletion units had little effect on cellular dimensions (Fig. 5B, b and d). The drastic changes in the cumulative deletion mutants may be due to the loss of multiple genes or DNA sites.
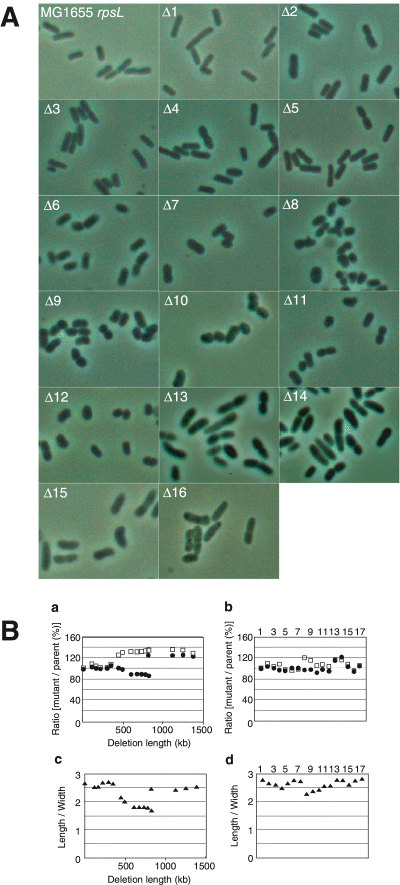
Length and width of mutant cells. A. The mutant cells (Δ1–Δ16) were inoculated from a log or early stationary phase culture and grown at 37°C in Antibiotic Medium 3 and observed with an incident fluorescence microscope equipped with phase-contrast optics. B. The cell length and width (a) and their ratio (c) of the set of cumulative deletion mutants were plotted against the length of the regions deleted in the mutant to show the relationship between cell size and the deletion length. In b and d, data for the original mutants, each of which has a single deletion, are shown against the deletion units: lane 1, no deletion; lane 2, unit 1; lane 3, unit 5; lane 4, unit 28; lane 5, unit 4; lane 6, unit 2-2; lane 7, unit 2-1; lane 8, unit 16-2; lane 9, unit 16-1-2; lane 10, unit 17; lane 11, unit 22; lane 12, unit 21; lane 13, unit 14; lane 14, unit 13; lane 15, unit 20; lane 16, unit 9-1; lane 17, unit 15. 200 cells in 2-3 fields were measured for determining the cell length and cell width in each experiment. Closed circles and open squares represent the values of the length and width of the cells relative to the parental dimensions, respectively. Closed triangles show the ratio of length to width. Bar = 5 µm.
Nucleoid organization
Next, we observed the 4,6-diamidino-2-phenylindole-stained nucleoids of the LD mutants by fluorescence and phase-contrast microscopy. Few cells were anucleate, which indicates that deleted chromosomes segregated into daughter cells as stably as the parental strain. It is consistent with that the mutants do not delete the dif site, xerC, xerD and muk genes, which are involved in stable maintenance of chromosomes. The shapes and behaviour of the nucleoids were changed. Figure 6shows examples of the nucleoids in the Δ14 mutant. The parental strain cells had one or two nucleoids that were localized midcell or at the 1/4 and 3/4 positions (Fig. 6A and B). In contrast, most of the mutant nucleoids were present as four or more pieces that were apparently irregularly distributed (Fig. 6A and C). In a minority of the cells, the sister nucleoids appeared as two or more spread forms that localized peripherally (Fig. 6A and C). Similarly, abnormal nucleoids were observed in the other deletion mutants, and the frequency of cells with four or more distributed nucleoids increased with the extent of the genome that was deleted. The example of the nucleoids in the Δ9 mutant is shown in Fig. 6A. With regard to the mutant cells that carried the individual deletion units, which were used in the construction of Δ16, only few cells with these aberrant nucleoids were observed, indicating that this phenotype is also due to the multiple deletions (data not shown).

The large-scale deletion mutants have nucleoids with an abnormal shape and location. Chromosomal DNA was observed by 4,6-diamidino-2-phenylindole staining after fixation as described (Hiraga et al., 1989). The deletion mutants, Δ9 and Δ14 (A and C), and the parental strain (A and B) were inoculated from a log or early stationary phase culture and cultured at 37°C for 2 h and incubated in the presence or absence of chloramphenicol (0.24 mg ml−1, 20 min). The image of each cell was cut from several fields as shown in (A) and collected (B and C).
The abnormal nucleoid organization in the mutant cells was also indicated by time-lapse microscopic observation of single living cells using a previously described method (Mason and Powelson, 1956). This method shows chromosomal DNA as bright images and the cytoplasm as a dark space. The nucleoids of the parental strain were localized in the middle part of the cell or at the 1/4 and 3/4 positions (Fig. 7A and D). In contrast, the middle space of the mutant cells was dark and the peripheral area was bright, indicating that the nucleoids of the mutant are localized peripherally near the envelope (Fig. 7B–D). This altered positioning continues during one round of the cell cycle.
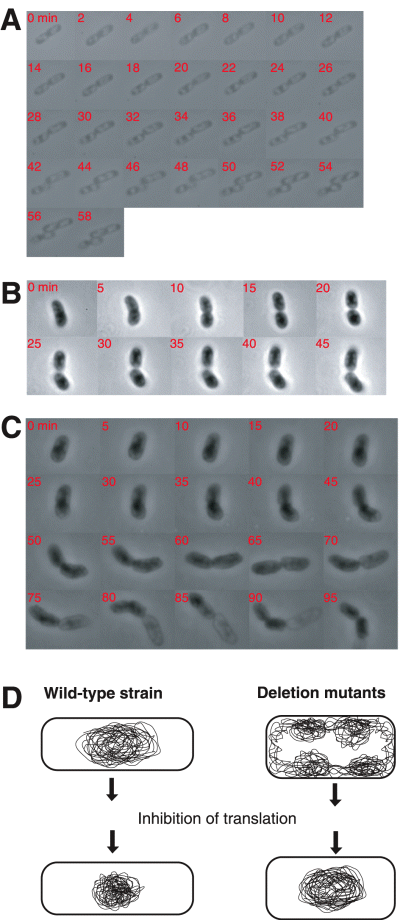
Peripheral localization of nucleoids in large-scale deletion mutants. The nucleoids were observed in living cells using gelatin (22–23%) as described (Mason and Powelson, 1956). MG1655 rpsL (A) and the deletion mutant Δ14 (B and C) were grown at 37°C. The chromosomal DNA is bright while the cytoplasm appears as a dark space. The numbers in a, b and c represent the time (min) from the start of observation. A model of the nucleoids in the deletion mutants is shown (D).
When the Δ14 deletion cells were treated with the protein synthesis inhibitor chloramphenicol, the scattered nucleoids were condensed into one or two nucleoids, which is similar to what was observed for the parental strain (Fig. 6B and C). Therefore, the abnormal nucleoid positioning may be due to transertion (Woldringh et al., 1990; Norris, 1995; Woldringh, 2002).
Flow cytometry analysis
To determine whether replication was affected by these deletions, we assessed the mutants using flow cytometry. The result that the DNA content per cell of the mutant is less than that of the parental cells confirms that the size of the mutant genome was reduced (Fig. 8A). Similarly, the peaks for the Δ14 mutant are not the same as 4 and 8 chromosome equivalents as shown in the parental strain but about 3.5 and 7 chromosome equivalents (Fig. 8B). The reduced values may reflect that about 24% of chromosomal regions are deleted for this Δ14 mutant. To investigate the timing of replication initiation, we conducted a run-out replication analysis. As shown by Fig. 8B and Supplementary material, Fig. S3, there were generally four or eight origins per wild-type cell under the culture conditions used. However, some Δ9–Δ15 mutant cells had abnormal numbers of chromosomes, such as 6 and 12. For example, 24% of all the Δ14 cells had chromosome numbers other than 4 or 8, which suggests that the timing of replication initiation is partially unregulated and causes multiple origins in a single cell to fire asynchronously. However, the majority of the mutant cells did have four or eight origins, indicating that the timing of replication initiation was not markedly perturbed in these cells (Fig. 8C).

Flow cytometry analysis. A. DNA content of the cells. B. Run-out replication assay. C. Cell age at replication initiation (Ai). The Ai of newborn cells is 0.0 and the Ai of cells just before cell division is 1.0. The Ais of the deletion mutants (closed circles) were calculated for cells that had four or eight origins. The Ai range of the parental strain was obtained by repeated experiments and is indicated by the broken lines.
Discussion
We developed a new system for construction and combination of the markerless chromosomal deletion mutations. Using this system, we succeeded in deleting many non-essential regions. Then we characterized the resultant large-scale chromosome deletion mutants. The engineered bacteria with large deletions grew more slowly than did the parental strain. This slow growth was attributed to the effect of combining the multiple deletions as the mutants with individual deletion units grew as well as the parental strain (data not shown). The additive effects caused by loss of functions of multiple genes are characteristic of the large-scale deletion mutations. If a certain cellular process is supported by multiple systems, we can not necessarily detect the phenotype resulting from the defect of each system. Using the engineered bacteria, which are defective in multiple systems, it may be possible to investigate the biological systems, which are cryptic in the wild-type strain.
Combining chromosomal deletions also changes the cell length and width. When the deletion unit 2-1 was added to construct Δ6, cells became wider than Δ5 (Fig. 5B, a). This is an additive effect because the cells with the deletion unit 2-1 alone are not wider than the parental strain (Fig. 5B, b). By addition of the deletion unit 16-2 and 16-1-2 to construct Δ7 and Δ8, cells became a little bit wider. Because the cell width of the strain having each of these deletion units is larger than that of the parental strain, these are the effects of loss of the genes located in these deleted regions. The pbpG gene, which codes for PBP7, is located in the region of the deletion unit 16-2, and this gene may be participated in the change of cell morphology (Henderson et al., 1995). The cell length of Δ13 became much longer than that of Δ12. When Δ13 was constructed from Δ12, the deletion unit 13 was added. The change in cell length may be due to this deletion because the cells with the deletion unit 13 alone are longer than the parental strain (Fig. 5B, b). Just upstream of the deleted sequence of the deletion unit 13, there locates the nrdB gene, which codes for a ribonucleoside reductase. This gene was identified as ftsB, the deficiency of which causes filamentation (Taschner et al., 1987). The expression of this gene may be affected by the deletion unit 13. In addition to deletion of the unit 13, replacement of the unit 16-2 with the corresponding intact region occurred. The recovery of the pbpG gene located in this region may effect on cell morphology.
With regard to the mutants Δ13–Δ16, both cell length and width are larger than those of the parental strain, indicating that cell volume increases in these deletion mutants. To characterize these mutants, we examined their protein content per cell volume. Those are 23–25% less than that of the parental strain (data not shown). The chromosomes per cell are reduced in these mutants. The results suggest that the cells may be swollen by decrease in integrity of peptidoglycan and/or by impaired osmotic regulation.
In the large-scale deletion mutants, the multiple small nucleoids are distributed peripherally near the envelope. Because this pattern resembles those for the mutant cells with increased cell width such as the rodA, pbpA and mreB mutants (Iwaya et al., 1978; Donachie and Begg, 1989b; Zaritsky et al., 1999), the abnormal nucleoid organization and localization of the large-scale deletion mutants may be due to the increased width. A subjective estimate of the proportion of cells with the abnormal nucleoids showed that this proportion increased with the total length of the deletion (and thus in proportion to cell width) in a strain. These results suggest that multiple genes are responsible for the increase of cell width. Besides the increase of cell width, there may be other reasons for the abnormal nucleoid organization and localization. Flow cytometry analyses showed that the regulation of replication initiation was not severely disturbed in the engineered cells. The progression of replication was not significantly affected in the majority of mutant cells bearing four or eight origins. Hybridization analysis showed that the ratio of the copy numbers of oriC and terC was almost the same in the Δ14 mutant and the parental strain (data not shown), which suggests that the replication elongation step was not severely inhibited by the deletions. Therefore, genome reduction may cause replication to terminate early, resulting in the early separation of the sister nucleoids. Alternatively, the mutants may be partially deficient in chromosome assembly.
The mutant nucleoids appear in multiple small nucleoids. What are these multiple small nucleoids? Are they normal individual genomes or abnormal amplified genomes? To answer this question, we measured the DNA content per cell by flow cytometry. The results clearly showed that the DNA content per cell of the mutant is less than that of the parental cells (Fig. 8A). It was also confirmed by run-out replication analysis that there is little difference in the copy number of the replication origin between the majority of the mutant cells and the parental cells as most of the mutant and parental cells have four or eight copies of oriC. These results suggest that the replicated genome regions condense individually into nucleoids. However, it can not be ruled out that the separately condensed regions may contain genes from future distinct chromosomes.
From observation of the mutant nucleoids, we can speculate on the dynamics of these small nucleoids. As described in the Introduction, in the extrusion-capture model, the replicated chromosomes segregate progressively. If the replicated nucleoids segregated independently, they would be aligned in the cells (model A in Fig. 9; Sawitzke and Austin, 2001). However, few of the mutant cells showed multiple aligned nucleoids. Indeed, in most of the cells the sister nucleoids are apparently distributed separately. Their distribution is not random. From our observation of the various sizes of the cells, we speculate the nucleoids behave as shown in model B of Fig. 9. In this model, a pair of the replicated genomes line up and these nucleoids then turn around and segregate.
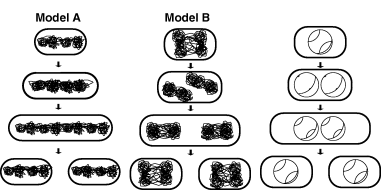
Models for mutant nucleoids. Schematic depiction of the two models that may explain the behaviour of the small nucleoids in the mutants. In model A, the replicated sister nucleoids align and then progressively move to both sides. In model B, the replicated sister nucleoids line up and then turn around. The chromosomal replication pattern is also shown.
The small nucleoids assemble into one or two packed nucleoids in the presence of protein synthesis inhibitor. These results indicate that the chromosomes are organized into nucleoids by two steps: they are first condensed into small nucleoids and then could assemble into one or two large packed nucleoids. In the mutants, the assembly into the packed nucleoids was observed in the presence of inhibitor of protein synthesis. Transertion does not particularly perturb the condensation into the small nucleoids because in the absence of the inhibitor chromosomes are not diffused but condensed into the nucleoids. However, the transertion affects their positioning. Although the cellular position of the small nucleoids is apparently irregular, that of the packed nucleoids seems to be fixed: the approximate location of a single packed nucleoid is in the cell centre, and the pairs of packed nucleoids are located half a cell length apart at the cell quarters. The assembly position of the mutant nucleoids is similar to that of the wild-type ones. The mechanism of assembly into packed nucleoids has not yet been clarified. Although most chromosomal DNA is replicated and forms a small nucleoid, the terC region may remain unreplicated. Then, in the absence of the force of transertion, chromosomal DNA may condense into packed nucleoids centring on the terC region. Alternatively, there may be an unknown mechanism by which the replicated sister nucleoids assemble at a particular cellular position.
In this work, we showed that cell size and nucleoid organization are changed in large-scale deletion mutants. By using these mutants, we can investigate further the mechanisms that control nucleoid behaviour. Further analysis by FISH, for example, would help to clarify nucleoid behaviour more precisely. Thus, engineered bacteria whose genomes have been reduced by the deletion of non-essential chromosome regions may be valuable for elucidating the basic mechanisms of cell proliferation.
Experimental procedures
Strains and media
All E. coli strains used are derivatives of MG1655. The MD series was constructed in MG1655 rpsL polA12. The LD series was built by using MG1655 red (KmR) rpsL hsdR::ApR, which was constructed by using KM22 (Murphy, 1998). MG1655 rpsL was used to combine the deletion units. Antibiotic Medium 3 (Becton Dickinson, USA) was used for all experiments except for those involving sacB selection, for which LB (–N) Suc was used (LB broth with 10% sucrose and lacking NaCl). The approximate formula per litre of the Antibiotic Medium 3 is beef extract 1.5 g, yeast extract 1.5 g, peptone 5.0 g, dextrose 1.0 g, sodium chloride 3.5 g, dipotassium phosphate 3.68 g and monopotassium phosphate 1.32 g.
MD mutant construction
The MD series was constructed with the E. coli homologous recombination system using plasmids and the polA mutant. The vector 664BSCK2-4 is a derivative of pHSG664 (Hashimoto-Gotoh et al., 1986) and has two positive selection markers (CmR and KmR), two negative selection markers [rpsL+ (SmS) and sacB] and multicloning sites flanking the KmR marker [Supplementary material, Fig. S1A and B, and Appendix A1 (664BSCK2)]. To introduce deletions, both chromosomal regions flanking the region to be deleted were cloned into 664BSCK2-4. The resulting plasmid was then introduced into MG1655 rpsL polA12. A CmR transformant was selected at 42°C (Supplementary material, Fig. S1C) and incubated at 30°C to obtain the SmR KmR derivatives. CmS colonies were then isolated and the deletions were confirmed by polymerase chain reaction (PCR). The deletions were designed so that 71 deletions (OCR1-71) were clockwise with respect to the oriC position and 92 deletions (OCL1-89) were counterclockwise. The primers used are listed in Supplementary material, Tables S2 and S3. Of these 163 deletions, 75 deletion mutants were successfully constructed (Supplementary material, Tables S2 and S3).
LD mutant construction
The LD series was constructed with the phage λ homologous recombination system using linear DNA fragments and an E. coli strain in which the recB recC genes were replaced with the λred region. The deletion units were built by using the ‘CRS cassette method’ and combined. For each deletion unit, two deletions were constructed, one with the CRS cassette and the other without. The CRS cassette is approximately 5 kb in size and bears one positive selection marker, CmR, and two negative selection markers, rpsL+ (SmS) and sacB[Fig. 1A and Supplementary material, Appendix A1 (CRS cassette)]. Introduction of the rpsL+ (SmS) and sacB genes makes the host strain sensitive to streptomycin and sucrose, respectively.
In the first step, two rounds of PCR were carried out to prepare a DNA fragment in which the chromosomal regions flanking the region to be deleted were joined to the sides of the CRS cassette (Supplementary material, Fig. S2). This linear DNA fragment was introduced into MG1655 red (KmR) rpsL hsdR::ApR by electroporation. CmR colonies were selected and the deletions were confirmed by PCR. In the second step, two rounds of PCR were carried out to prepare a DNA fragment in which the same flanking chromosomal regions were directly joined to each other. This fragment was introduced into the CmR colonies obtained at the first step, SmR and sucrose-resistant colonies were selected, and the deletions were confirmed by PCR. Sixteen deletion units were constructed in this way. The primers used are listed in Supplementary material, Table S4.
P1 phage was prepared from strains with or without the CRS cassette corresponding to each deletion unit. To combine the deletion units, the deletion unit bearing the CRS cassette was first introduced by transduction with P1 phage prepared from the CRS deletion mutant using the positive selection marker CmR. Next, a recombinant, from which the CmR marker was lost, was obtained by transduction with P1 phage prepared from the cassetteless deletion mutant using the negative selection markers rpsL+ (SmR) and sacB (sucrose resistance) (Fig. 1B).
PFGE
Pulsed-field gel electrophoresis was performed by using the CHEF-DR II system (Bio-Rad) with 1% PFU agarose (Bio-Rad) in 0.5 X TBE buffer. The running time was 22 h, voltage 200 V, ramping 10–30 s.
Microarray analysis
DNA microarrays were purchased from Takara Shuzo, Co. Ltd, Japan. Genomic DNA was prepared and hybridized as described (Oshima et al., 2002). The data were analysed as described (Porwollik et al., 2002).
Flow cytometry analysis
Basically the same method described by Katayama et al. (1997a,b). Briefly, cells were inoculated from a log phase culture and grown exponentially for about 10 generations at 37°C in Antibiotic Medium 3 until the optical density (A660) reached 0.2. The cells were then further incubated for 4 h in the presence of rifampicin (150 µg ml−1) and cephalexin (10 µg ml−1) at the same temperature, and harvested in cold buffer (10 mM Tris-HCl, pH 7.5; 20 mM magnesium sulphate). We ascertained that cell division in the deletion mutant is as effectively inhibited by cephalexin as in the parent cells. Chromosomal DNA was stained with mithramycin (27 µg ml−1) and ethidium bromide (5 µg ml−1), and the cells were analysed with a BRYTE-HS flow cytometer (Bio-Rad) (Skarstad et al., 1995). Cell age at replication initiation (Ai) was calculated as described (Wold et al., 1994).
Supplementary material
The following material is available from http://www.blackwellpublishing.com/products/journals/suppmat/mmi/mmi4368/mmi4368sm.htm
Fig.S1. MD mutant construction.
Fig.S2. The DNA fragments used for the CRS cassette method.
Fig.S3. Flow cytometry analysis (DNA histograms of cells).
TableS1. Long deletion mutations used to design the MD series.
TableS2. Primers used to construct the OCL series of MD mutants.
TableS3. Primers used to construct the OCR series of MD mutants.
TableS4. Primers used to construct the deletion units for the LD series.
Appendix S1. Sequences.
Acknowledgements
We thank Dr S. Hiraga for critical reading of the manuscript and for helpful suggestions, Dr H. Niki for useful advice about observing nucleoids in living cells and Dr S. Matsuyama for kindly providing us the KM22 strain. We are also grateful to T. Ikegami, Y. Imai, N. Chiku, A. Takahashi, H. China and S. Fukuda for technical assistance. This work was supported by a Grant-in-Aid for Scientific Research on Priority Areas (C) ‘Genome Biology’ from the Ministry of Education, Culture, Sports, Science and Technology of Japan.
Note added in proof
During the review process, a paper describing the data analysis of microarray map was published (Fukiya, S., Mizoguchi, H., Tobe, T, and Mori, H. (2004) Extensive qenomic diversity in pathogenic Escherichia coli and Shigella strains revealed by comparative genomic hybridization microarray. J Bacteriol186: 3911–3921).


