Nitrogen deposition drives lichen community changes through differential species responses
Abstract
Nitrogen (N) deposition has increased globally over the last 150 years and further increases are predicted. Epiphytic lichens decline in abundance and diversity in areas with high N loads, and the abundance of lichens decreases along gradients of increased deposition. Thus, although N is an essential nutrient for lichens, excessive loads may be detrimental for them. However, these gradients include many correlated pollutants and the mechanisms behind the decline are thus poorly known. The aim of this study was to assess effects of N deposition, alone, on the epiphytic lichen community composition in a naturally N-poor boreal forest. For this purpose, whole spruce trees were fertilized daily with N at five levels, equivalent to 0.6, 6, 12.5, 25, and 50 kg N ha−1 yr−1, during four consecutive growing seasons (2006–2009), and changes in the abundance of lichens were monitored each autumn from the preceding year (2005). The studied lichen communities were highly dynamic and responded strongly to the environmental perturbation. N deposition detectably altered the direction of succession and reduced the species richness of the epiphytic lichen communities, even at the lowest fertilization application (6 kg N ha−1 yr−1). The simulated N deposition caused significant changes in the abundance of Alectoria sarmentosa, Bryoria spp., and Hypogymnia physodes, which all increased at low N loads and decreased at high loads, but with species-specific optima. The rapid decline of A. sarmentosa may have been caused by the added nitrogen reducing the stability of the lichen thalli, possibly due to increases in the photobiont: mycobiont ratio or parasitic fungal attacks. We conclude that increases in nitrogen availability, per se, could be responsible for the reductions in lichen abundance and diversity observed along deposition gradients, and those community responses may be due to physiological responses of the individual species rather than changes in competitive interactions.
Introduction
Nitrogen (N) deposition has increased globally over the last 150 years and further increases are predicted (Galloway et al., 2004, 2008). This is considered one of the major global threats to biodiversity (De Schrijver et al., 2011; McLean et al., 2011). Nutrient-poor boreal forests are considered particularly sensitive to N deposition, and even relatively low rates may drive changes in species composition, diversity, and ecosystem functions in them (Bobbink et al., 2010). Moreover, epiphytic lichens are considered to be among the most sensitive organisms in boreal forests (Cornelissen et al., 2007; Geiser et al., 2010; De Schrijver et al., 2011), and several studies have shown that lichen abundance and diversity decrease, and N-sensitive species are replaced with more tolerant species, along gradients of increasing N deposition (Söchting, 1995; Van Dobben & Ter Braak, 1998; Van Herk, 1999; Wolseley et al., 2006; Davies et al., 2007; Rogers et al., 2009; Geiser et al., 2010; Gilliam et al., 2011). However, as N deposition is often correlated with other pollutants (e.g., SO2, H2SO4, heavy metals, and O3) and forestry practices that influence lichens negatively, it is difficult to separate the direct effects of N from other factors (Van Dobben et al., 2001; Gilliam, 2006; Hauck, 2009).In addition to atmospheric N deposition, direct forest N fertilization poses potential threats to lichens, as highlighted by the disappearance of the pendulous lichen Alectoria sarmentosa following 7–8 years of fertilization in a Norway spruce forest recorded by Hesselman (1937).
Short-term exposure to high concentrations of N has been shown to have direct, toxic effects on lichen, such as membrane damage (Munzi et al., 2009) and chlorophyll degradation (Gaio-Oliveira et al., 2004). The gaseous form is the most detrimental (Sheppard et al., 2011), but in addition, NH4 + is generally more detrimental to lichen vitality than NO3 − at high concentrations (Brown & Tomlinson, 1993; Sheppard et al., 2011). An important aspect of N is that, unlike most other pollutants, it is an essential nutrient (De Schrijver et al., 2011). Thus, nontoxic increases in N availability usually increase growth, even of N-sensitive species (Crittenden et al., 1994; Welch et al., 2006). Lichens have been shown to respond to increases in N availability by investing more N in their photosynthetic capacity, as the N concentrations of their thalli increase (Palmqvist et al., 2002), thereby balancing their carbon to nitrogen ratio and potentially explaining the observed growth increases (Dahlman et al., 2003; Palmqvist & Dahlman, 2006). However, even if N availability is optimal, there may be other exogenous restrictions on growth increases, such as limitation by light (Cabrajic et al., 2010) or other nutrients (Johansson et al., 2011). If nitrogen addition leads to increased growth, it might also intensify the competition for light and space, possibly leading to slow-growing species being outcompeted (Welch et al., 2006; Armstrong & Welch, 2007). Various examples of such phenomena have been observed and characterized in boreal ecosystems (Cleland & Harpole, 2010). For instance, some effects of N addition on boreal forest floor vegetation (Strengbom et al., 2002; Nordin et al., 2009) and mire communities (Wiedermann et al., 2007) are known to be mediated by parasitic fungi. However, their effects on lichens have not been extensively studied, although several authors have addressed certain aspects of N-mediated changes in interactions that may influence lichens (see Nybakken et al., 2009; Asplund et al., 2010; Hauck, 2011).
We herein present the results from the first experimental study addressing the effect of atmospheric N deposition on epiphytic lichen diversity and community structure in a realistic way. The aim was to follow the responses of an unaffected epiphytic lichen community when realistically exposed to an N-deposition gradient. We did that by performing a whole-tree fertilization experiment in a boreal Norway spruce-dominated forest during four consecutive years. Specifically, we wanted to test whether the abundance of foliose, crustose, and pendulous lichens was influenced by increased N and at which loads this occurs. We also wanted to investigate which mechanisms that drive these changes. We have previously found physiological differences between two lichens: Platismatia glauca and A. sarmentosa (Johansson et al., 2010). We hypothesized that different lichen species have different N optima and that growth rates of many species would be increased by low additions of N. However, the highest N load applied (equivalent to 50 kg N ha−1 y−1) is far higher than optimal for any species present in this nutrient-poor boreal forest; hence, this treatment should lead to reductions in the abundance of all species and (hence) the total abundance of lichens. We also hypothesized that the anticipated increase in abundance of fast-growing species induced by low N treatments would increase the competition for light and space; thus, these treatments would reduce the abundance of slow-growing species, although the N levels would be below their physiological N optima, as commonly observed in herbaceous communities.
Material and methods
Field site
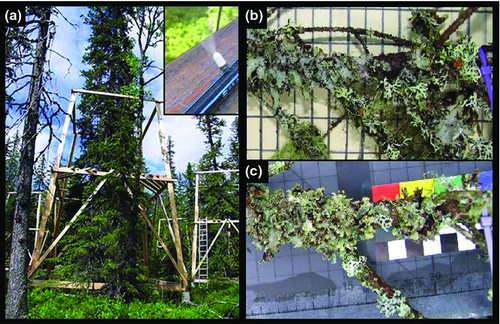
The study was performed at a site in a relatively open old-growth spruce (Picea abies) forest stand in Kulbäcksliden (64°12′N, 19°33′E), Vindeln Experimental Forests, managed by The Unit for Field-based Forest Research, Swedish University of Agricultural Sciences. An experiment was established in 2004–2005 at this site, involving the artificial irrigation and N fertilization of 15 trees in 2006–2009, as described in more detail in Johansson et al. (2010). Wooden towers (6.5 m high and 4 × 4 m2) made of untreated wood, each with two platforms 4 m above the ground to facilitate native lichen inventories, were built around each tree and connected to an automated irrigation-fertilization system. The 15 trees were divided into three groups of five, based on lichen abundance (species and biomass), and then, five N-concentration treatments (described below) were randomly assigned to the trees in each group (Fig. 1).
Irrigation-fertilization
Nitrogen was added in the form of NH4NO3 at five concentrations: 0.04, 0.41, 0.81, 1.63, and 3.2 mm N, equivalent to deposition of 0.6, 6, 12.5, 25, and 50 kg N ha−1 yr−1. Hence, these treatments are hereafter designated as 0.6, 6, 12.5 25,and 50 N, respectively. The lowest concentration was the same as that in local rainwater (Forsum et al., 2006). The fertilizer (17–18 L) was administered daily as a diffuse spray at 06:00 (GSM + 1) in three 2-min pulses with 10 min intervals from 7 June to 27 September in 2006, 15 June to 21 September in 2007, 19 June to 1 October in 2008, and 16 June to 1 October in 2009. The growing season in this part of Sweden starts at the end of May or early June and continues until late September or early October. Freezing temperatures can occur in most other months, and temperatures are usually subzero from December to March (Appendix 1). Thus, our 4 month treatment periods each year coincided with the forest vegetation's active growth periods. For practical reasons, spraying could not start until the first week of June, when road conditions allowed the transport of heavy water loads (see Johansson et al., 2010 for more details).
Lichen inventories
The selected trees harbored the following 16 species of epiphytic macrolichens: A. sarmentosa (Ach.) Ach, Bryoria capillaris (Ach.) Brodo & Hawksw, Bryoria fremontii (Tuck.) Brodo & Hawksw., Bryoria fuscescens (Gyeln.) Brodo & Hawksw., Bryoria simplicor (Vain. Brodo & Hawksw), Tuckermanopsis chlorophylla (Willd.) Hale in Egan, Hypogymnia physodes (L.) Nyl., Hypogymnia tubulosa (Schaer.) Hav., Mycoblastus sanginarius (L.) Norman, Parmelia. sulcata Taylor, Parmeliopsis ambigua (Wulfen) Nyl., Parmeliopsis hyperopta (Ach.) Arnold, P. glauca (L.) Culb & Culb, Usnea filipendula Stirt., Usnea subfloridana Stirt., and Vulpicida pinastri (Scop.) Mattsson & Lai. Two branches were selected (one dead with no needles and one alive, with needles up to 3–4 years old) from two contrasting aspects at each of two heights, ~2 and 4 m from the ground (to cover within-tree variation in treatment responses), giving a total of eight branches per tree. A 40 cm long section of the main axis of each selected branch was marked with colored plastic strips. Then, lichens on the marked length of each branch were documented annually, at the end of each treatment period (August–September), from 2005 (before the treatments started) until 2009, by taking photographs from above using a Canon Powershot Pro1 digital camera. A ‘scale grid’ was included in each photo to enable scale calibration before analyzing the images (Fig. 1). All branches and associated lichens were sprayed with water before the photos were taken if the weather was dry, to minimize differences in lichen size and appearance due to differences in humidity between years.
Image analysis
The images were analyzed using ArcGIS 9.2 ESRI (Environmental Systems Resource Institute, Redlands, CA, USA), with the scale set using the coordinates on the scale grid in each photo. To estimate the abundance of each species, a 0.5 × 0.5 cm2 grid was superimposed on top of each picture, then each lichen thallus larger than ~2 mm under each grid interception point within a 10 cm wide strip along the marked 40 cm section of each selected branch was recorded and manually identified. Crustose species were treated as a single group when recording their abundance, and specimens of Bryoria, Hypogymnia, Parmeliopsis, and Usnea were only identified to the genus level (as it was not possible to separate different species from the pictures). The abundance data were converted to cm2 coverage m−1 by multiplying the number of hits per branch intercept by 0.25 cm2 per hit and 200 intercepts per meter. Abundance was calculated to cm2 m−1 by multiplying number of hits per branch intercept with 0.25 cm2 per hit and by 200 intercepts per meter. Species richness was recorded as the number of species observed per branch.
Statistical analysis
The relationship between changes in lichen species composition and N-deposition treatments was tested by canonical correspondence analysis (CCA) followed by a permutation test using the Vegan package (Oksanen et al., 2012). Differences in abundance at start between the treatments were analyzed using anova. Effects of time, height, and branch vitality (dead or alive) were analyzed separately for each species using a hierarchical repeated measure anova, where height, branch vitality, and treatment were nested within trees. The effects of treatment and time on abundance and species richness were then tested using pooled data from all branches on the same treatment unit (tree), with a repeated measure anova. All statistical analyses were performed using the R statistical package (R Development Core Team, 2011).
Results
A total of 10 macrolichen taxa were abundant on the studied spruces. The four most frequent taxa were P. glauca, Hypogymnia spp., A. sarmentosa, and Bryoria spp., which accounted for 48%, 27%, 11%, and 5% of total lichen abundance, respectively, at the start of the experiment in 2005, whereas all other taxa accounted for less than 5%. Some species were so rare that they were not detected on all trees. Before the experiment started, there were no significant differences in the abundance of lichen of any species between trees assigned to different treatments (Table 1).
| 0.6 kg N | 6 kg N | 12.5 kg N | 25 kg N | 50 kg N | |
|---|---|---|---|---|---|
| Alectoria sarmentosa | 9.86 ± 1.57 | 16.45 ± 6.32 | 27.56 ± 7.99 | 8.04 ± 2.24 | 21.85 ± 8.03 |
| Bryoria sp. | 5.42 ± 1.13 | 6.89 ± 3.43 | 9.44 ± 3.07 | 7.71 ± 3.91 | 9.05 ± 4.08 |
| Usnea sp. | 0.91 ± 0.09 | 0 ± 0 | 2.18 ± 1.72 | 1.91 ± 1.04 | 6.27 ± 3.87 |
| Parmeliopsis sp. | 3.49 ± 1.47 | 1.93 ± 0.77 | 3.04 ± 1.72 | 1.49 ± 0.76 | 1.52 ± 0.80 |
| Parmelia sulcata | 1.31 ± 0.75 | 0.71 ± 0.52 | 1.21 ± 0.56 | 3.25 ± 1.44 | 3.57 ± 1.48 |
| Crustose lichens | 0.24 ± 0.16 | 3.72 ± 2.26 | 1.00 ± 0.58 | 0.87 ± 0.48 | 6.06 ± 5.71 |
| Mycoblastus sp. | 0.84 ± 0.84 | 2.88 ± 1.98 | 2.85 ± 1.53 | 2.19 ± 1.05 | 2.55 ± 1.01 |
| Vulpicida pinastri | 0.14 ± 0.08 | 0.36 ± 0.36 | 0 ± 0 | 0.32 ± 0.25 | 0.02 ± 0.02 |
| Tuckermanopsis chlorophylla | 1.31 ± 0.46 | 0.87 ± 0.78 | 1.82 ± 0.72 | 1.68 ± 1.00 | 0.91 ± 0.38 |
| Hypogymnia sp. | 53.92 ± 4.43 | 48.77 ± 8.90 | 33.84 ± 4.20 | 50.26 ± 11.78 | 22.70 ± 2.26 |
| Platismatia glauca | 90.02 ± 45.01 | 58.32 ± 20.00 | 68.04 ± 20.22 | 86.56 ± 35.00 | 61.41 ± 11.18 |
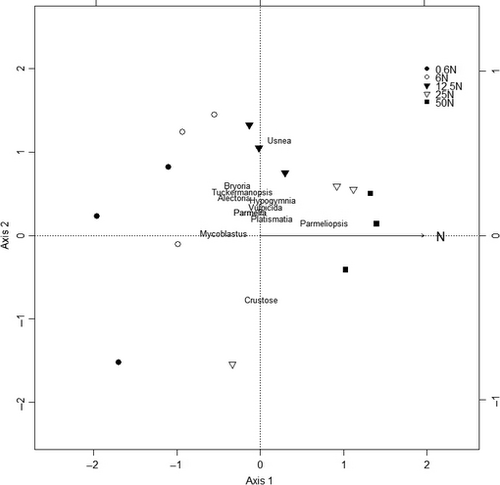
Using CCA, we found that the lichen community composition responded to fertilization even at the lowest level (6 kg N ha−1 year−1). The two-first axes explained 75.2% of the variance (59% and 17%, respectively) in the relationship between species and N-deposition treatment; hence; they are the only axes displayed here (Fig. 2). The permutation test showed that the simulated N deposition had a significant effect on the lichen community structure (F 1,13 = 4.5; P = 0.005). Under the high N treatments (50 and 25N), the lichen community changed toward an increased abundance of Parmeliopsis sp., whereas Alectoria sarmentosa, Bryoria sp., Mycoblastus sp., and T. chlorophylla decreased.
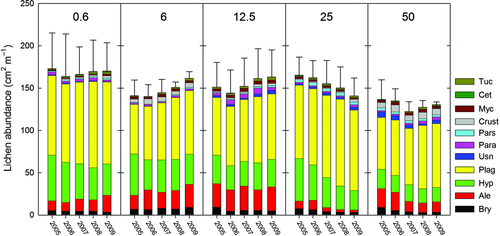
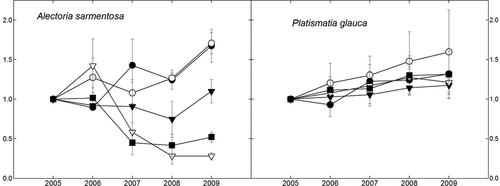
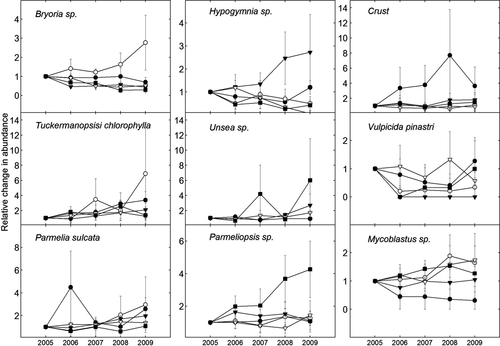
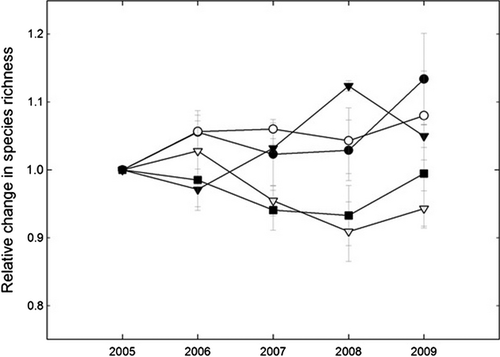
The 6 and 12.5N treatments resulted in increases in total lichen abundance over time, whereas the 25 and 50N treatments resulted in reductions (Fig. 3). The simulated N deposition also caused significant changes in abundance of A. sarmentosa, Bryoria spp., and H. physodes. The abundance of A. sarmentosa significantly increased over time under the 0.6 and 6N treatments, remained more or less stable under the 12.5N treatment and decreased substantially under the 25 and 50N treatments, as shown by the Treatment (T) × Year (Y) data presented in Table 2, and Figs. 4 and 5. This species decreased mainly between 2006 and 2007, when its frequency decreased by 42% under the 50N treatment and 56% under the 25N treatment (Fig. 4). Bryoria spp. showed a positive response to the 6N treatment, but a negative response to higher loads (Y, T × Y; Table 2, Fig. 5). The abundance of Hypogymnia spp. increased most strongly under the 12.5N treatment, (Y, T × Y; Table 2, Fig. 5), whereas the abundance of P. glauca increased over time, but was not significantly affected by the treatments (Y, Table 2, Fig. 4). T. chlorophylla also increased over time (Y, Table 2, Fig. 5). No significant effect of either time or treatment on any of the other six taxa was detected (Table 2). Species richness significantly increased over time under the 0.6, 6, and 12.5N treatments (T × Y, P < 0.05), but declined or did not change significantly under the 25 and 50N treatments (Fig. 6). The only significant interaction effect of branch vitality (dead/living) and treatment was that Hypogymnia spp. positively responded to high N on living branches, but negatively responded on dead branches (T × Y × B, P = 0.004). Both Mycoblastus sp. and P. glauca were more abundant on dead branches (F, P = 0.023; P < 0.001). There were no significant differences between the two branch heights for any of the taxa.
| Treatment | Year | T × Y | ||||
|---|---|---|---|---|---|---|
| F 4,10 | P | F 4,40 | P | F 16,40 | P | |
| Total lichen cover | 0.29 | 0.878 | 0.09 | 0.768 | 4.70 | 0.002 |
| Alectoria sarmentosa | 1.53 | 0.266 | 1.16 | 0.340 | 1.96 | 0.042 |
| Bryoria sp. | 0.25 | 0.981 | 11.66 | 0.007 | 3.20 | 0.050 |
| Usnea sp. | 1.44 | 0.291 | 0.42 | 0.792 | 0.86 | 0.615 |
| Parmeliopsis sp. | 0.60 | 0.671 | 1.42 | 0.245 | 1.22 | 0.294 |
| Parmelia sulcata | 1.60 | 0.232 | 0.53 | 0.714 | 0.70 | 0.778 |
| Crustose lichens | 0.74 | 0.584 | 2.11 | 0.096 | 0.49 | 0.936 |
| Mycoblastus sp. | 0.62 | 0.660 | 0.74 | 0.572 | 0.54 | 0.905 |
| Vulpicida pinastri | 0.62 | 0.656 | 0.74 | 0.116 | 0.96 | 0.514 |
| Tuckermanopsis chlorophylla | 0.19 | 0.937 | 4.42 | 0.005 | 0.64 | 0.831 |
| Hypogymnia sp. | 2.59 | 0.101 | 16.54 | <0.001 | 2.64 | 0.006 |
| Platismatia glauca | 0.32 | 0.858 | 4.45 | 0.004 | 0.19 | 0.999 |
- Statistical significant differences are marked with a bold font.
Discussion
Our results show that 4 years of simulated N deposition caused significant changes in the epiphytic lichen community in the naturally N-poor boreal forest at the study site. Under the low N treatments, the ongoing succession of the lichen communities resulted in increased lichen abundance and diversity within trees, accompanied by greater differentiation in community composition between trees. The significant changes in lichen community composition recorded even at 6 kg N ha−1 yr−1 after only 4 years indicate that this moderate treatment is above the critical load of N deposition for boreal epiphytic lichen communities. This has not been experimentally demonstrated previously, but it strongly supports previously determined critical loads (Bobbink et al., 2010; Geiser et al., 2010; Gilliam et al., 2011; Pardo et al., 2011) and confirms that lichen communities are among the most sensitive communities to N deposition. As we hypothesized, responses to the treatments differed among species, reflecting differences in their N optima, and many of the responses we recorded are consistent with previous observations in forest fertilization studies and descriptive studies of communities along nitrogen deposition gradients (Söchting, 1995; Van Dobben & Ter Braak, 1998; Van Herk, 1999; Wolseley et al., 2006; Davies et al., 2007; Jovan, 2008; McCune & Geiser, 2009; Rogers et al., 2009; Bobbink et al., 2010; Gilliam et al., 2011). Notably, the observed reductions in abundance of A. sarmentosa under the two highest N loads are consistent with findings by several authors (Hesselman, 1937; Jovan, 2008; McCune & Geiser, 2009; Geiser et al., 2010). Moreover, increased N deposition could have contributed to the apparent extinction of A. sarmentosa in north-western Central Europe (Hauck, 2011). Nitrogen deposition of 25 kg N ha−1 y−1 is clearly too high for A. sarmentosa. Furthermore, although its abundance remained stable under the 12.5N treatment, our results indicate that 12.5 kg N ha−1 yr−1 may still be above the critical load for this species, since it no longer increased successionally with time, as it did on some of the trees subjected to the 0.6 and 6 kg N ha−1 yr−1 treatments. It should also be noted that cumulative nitrogen inputs at rates that had positive or neutral effects in this 4 year study could have negative longer term effects.
The abundance of Bryoria spp. increased rapidly under the 6N treatment, but did not change or decreased slightly under both lower and higher treatments. The apparent optimum dose for Bryoria spp. at around 6 kg N ha−1 is consistent with previous findings for the genus generally (McCune & Geiser, 2009; Geiser et al., 2010), but differences among species within the genus have been reported. According to McCune & Geiser (2009), B. fremontii and B. fuscescens are oligotrophs (peak detection frequency along N-deposition gradients at 1.9 or 2.3 kg N ha−1 y−1), whereas B. capillaris is classified as a mesotroph (peak detection frequency at 2.7 kg N ha−1 y−1). All these species were present on our study trees, but were treated collectively. In contrast to the observed responses of the above-mentioned taxa, no significant treatment effect on P. glauca was detected, which is interesting as it is regarded as an N-sensitive species by some authors (Van Herk, 1999; Fenn et al., 2008). However, it is considered a more N-tolerant species (mesotroph with a broad N requirement, and peak detection frequency at 3.1 kg N ha−1 y−1) by McCune & Geiser (2009). Our results support the conclusion that P. glauca is one of the most N-tolerant species in the naturally N-poor forests in the study region. Both H. physodes and H. tubulosa are known to have broad N tolerance, although H. physodes is considered slightly more N tolerant than H. tubulosa (McCune & Geiser, 2009). Moreover, Dahlman et al. (2003) found that both of these Hypogymnia species and P. glauca survived intensive fertilization (75–100 kg N ha−1 y−1 for 16 years), when phosphorus (P) and other nutrients were added. Accordingly, both of these species showed positive responses to the relatively high load of 12.5 kg ha−1 in this study. No significant treatment effects on the other, less common species or taxa (T. chlorophylla, Mycoblastus sp., P. sulcata, Parmeliopsis sp., Usnea spp., and V. pinastri) were observed, but this may have been due to the rather low statistical power to detect such effects, linked to the small number of observations, rather than to a lack of responses to the nutrient addition.
When the results presented here is combined with already published values on N concentrations from the same experiment (Fig. 4, Johansson et al., 2010), they reveal that the decline of A. sarmentosa coincides with thallus N-concentration values above 6 mg N g−1 DW (Fig. 4, Johansson et al., 2010), i.e., A. sarmentosa declined between 2006 and 2007 in the two highest N-deposition treatments where the lichen thalli had N concentration of 7 mg N g−1 DW in 2006, whereas no decrease could be detected in treatments with thalli concentrations below 6 mg N g−1 DW. This is consistent with the N-concentration threshold value of 6.5 mg N g−1 DW for A. sarmentosa, according to the ‘Clean site thresholds’ developed by the USDA Forest Service National Lichens and Air Quality Database and Clearinghouse (Geiser pers. comm, http://gis.nacse.org/lichenair/).
The mechanism behind the decrease of A. sarmentosa remains unknown, but the results reported here give some indication about the major processes involved. As A. sarmentosa declined immediately after N concentrations in their thalli had become too high, the observed decline is not caused by decreased light conditions, more rapid tree growth, or competition with other lichens. Hesselman (1937) suggested A. sarmentosa decreased due to faster bark turnover, but that cannot explain the decrease in A. sarmentosa in our study, as the negative effect also was found on dead branches without bark. A direct toxic effect of the N is not plausible either, as earlier studies show that A. sarmentosa can maintain a positive growth at far higher N concentration than the one recorded here (Johansson et al., 2011). We thus suggest that the two most reasonable explanations for the observed decline of A. sarmentosa are a reduced stability of the lichen thalli or an increased susceptibility to diseases.
Increases in thallus N concentrations are likely to reduce the stability of the lichen by increasing the photobiont:mycobiont ratio (Johansson et al., 2011), as the mycobiont is responsible for the structure and stability of the thallus. Increased infections of parasitic fungi could also have contributed to the rapid decline of A. sarmentosa, since at least one species of a parasitic fungus has increased under the high N treatments at our study site (Ström, 2011). This parasite destroys the cortex of the host and exposes the medulla. Moreover, the lichens might have become more susceptible to parasites, as the chemical defense of lichens can also be altered by N fertilization (Nybakken et al., 2009). Together with the increased photobiont:mycobiont ratio, this could potentially make A. sarmentosa more fragile, and hence more susceptible to fragmentation (which is negatively correlated with biomass of the species; Esseen, 1985) during extreme weather events like heavy storms.
In contrast to A. sarmentosa, high thallus N concentrations do not appear to be deleterious to P. glauca, according to previous findings; Dahlman et al. (2003) detected concentrations up to 20 mg N g−1 DW in P. glauca that survived 15 years of heavy fertilization and Johansson et al. (2011) detected negative effects only at the highest thallus N concentrations (16.6 and 26.9 mg N g−1 DW). These results show that P. glauca can tolerate N concentrations far higher than the ‘clean site threshold values’ reported for the species (5.9 mg g−1, Geiser pers. comm, http://gis.nacse.org/lichenair/) and indicate that the reported decline of the species in polluted sites could be caused by other factors than N.
Species richness and diversity at small spatial scales usually decline when plant communities are fertilized (Rajaniemi, 2002; Gilliam, 2006; Chalcraft et al., 2008). The decrease in lichen species richness at high deposition levels, probably resulting from loss of N-efficient species, is a direct parallel to phenomena observed in herbaceous communities (Gilliam, 2006). However, the total lichen abundance increased at fairly low levels of N application, but we did not record an increased dominance of N-requiring species. Thus, the drop in diversity in these epiphytic lichen communities was probably not due to increased competition resulting from increases in their density, as is often the case in herbaceous plant communities (Rajaniemi, 2002). The reduced species richness observed in this study is more likely due to N-sensitive species disappearing due to direct physiological stress and a lack of colonization by new species as there are few N-tolerant lichens in this naturally N-poor boreal forest. It is interesting to compare these results with the positive responses of epiphytic lichen abundance and species richness to P fertilization recorded in Hawaiian rain forests (Benner & Vitousek, 2007). Although nutrient enrichment had opposing effects on lichen biomass in the Hawaiian ecosystem and our study site, possibly due to differences in elemental limitations between the systems (Benner & Vitousek, 2007) and contrasting responses of the algal and fungal symbionts to the two different elements applied (Johansson et al., 2011), lichen biomass and richness were positively correlated in both studies. This further supports the hypothesis that changes in epiphytic lichen richness following nutrient enrichment are not driven by competitive interactions.
Although the increased lichen abundance under the 6 and 12.5N treatments did not reduce the species richness, it could still have negative effects on the weakest competitors in the system. V. pinastri could potentially be such a species as it declined most severely under these treatments and performed better under both higher and lower N loads. Thus, we cannot exclude the possibility that competitive interactions could be important over longer time scales, especially if the total lichen abundance continued to increase under the intermediate N treatments.
Not only the total level but also the form in which nitrogen is added to the system can be important (Sheppard et al., 2011). In this study, nitrogen was added via wet deposition of NH4NO3, as most atmospherically deposited N is in this form. However, inferences from other studies suggest that the community changes would probably have been even stronger if the N had been added as dry deposition of ammonia (Geiser & Neitlich, 2007; Cape et al., 2009) or especially gaseous NO3 (Sheppard et al., 2011).
Critical loads based on field evidence are particularly valuable, and critical loads of lichens, which are typically the lowest reported in a given ecosystem, are especially useful as they pinpoint threshold deposition effect levels for the whole ecosystem (Pardo et al., 2011). However, these are often difficult to estimate from descriptive studies of communities along deposition gradients, as these gradients are often confounded by other pollutants (Pardo et al., 2011). As differences in N optima among the epiphytic lichens recorded in this long-term field experiment largely coincide with the results from descriptive studies along pollution gradients, we conclude that N per se is indeed an important pollutant for many lichen species, and that the critical load of wet deposition of NH4NO3 is below 6 kg N ha−1 y−1. However, the responses of a few species (e.g. P. glauca) differed dramatically from their reported responses along pollution gradients, indicating that other pollutants than N, or other N inputs than wet deposition of NH4NO3, may be important. Moreover, the response of some lichens to the N treatments changed over time. For example, under the two highest N treatments the abundance of A. sarmentosa increased during the first year, but declined rapidly thereafter. This is consistent with previous findings that not only deposition rates but also cumulative load loads might be important (De Schrijver et al., 2011), and long-term experiments are essential to reveal such nonlinear responses of species to environmental manipulations.
Acknowledgements
This study was funded by grants awarded to K Palmqvist from the Kempe Foundation Sweden and to O Johansson from the Björkman Foundation. We thank the staff and researchers associated with The Unit for Field-based Forest Research, The Swedish University of Agricultural Sciences (Vindeln, Sweden) including Professor Tomas Lundmark for ideas, technical, and economic support; Tomas Hörnlund, Gunnar Karlsson, and Jon Sandqvist for help with the construction of the towers; and Jan Parsby, for help with setting up the automatic irrigation system. Thanks are also due to Professors Torgny Näsholm and Annika Nordin (Umeå Plant Science Center, Department of Forest Genetics and Plant Physiology, Swedish University of Agricultural Sciences, Umeå, Sweden), Professor Lars Ericson (EMG) for good advice and ideas, and Professor Sune Linder for inspiration. Field assistance was provided by the following staff and PhD students from EMG: Ann Sehlstedt, Anna Cabrajic, Johan Asplund, Jonas Höglund, Olle Palmqvist, and Linus Jansson. We also thank Ruaridh Hägglund and Colleen Grenz in particular for help with analyzing the photos. This project was part of a joint research program funded by FORMAS between the Swedish University of Agricultural Sciences and Umeå University on “Sustainable Management of Carbon and Nitrogen in Future Forests”.


