Pattern of differentiation in the annual killifish genus Austrolebias (Cyprinodontiformes: Rivulidae) from a biosphere reserve site in South America: a multidisciplinary approach
Abstract
The annual killifish genus Austrolebias includes approximately 38 species distributed throughout the Paraná-Plata basin and Patos-Merín system. Within the Austrolebias adloffi species complex, the Uruguayan populations of Austrolebias charrua were considered as an intergradation between A. adloffi and Austrolebias viarius populations. Austrolebias charrua presents an intermediate phenotype between both taxa and high levels of morphological and chromatic variability. In the present study, we incorporate different methodological approaches (molecular, morphology, and gamete ultrastructure) to elucidate the pattern of differentiation among the parapatric taxa (A. charrua, Austrolebias reicherti, A. viarius) distributed in a Biosphere Reserve Site. Analyses of cytochrome b sequences show high values of DNA polymorphism, in particular for A. charrua. This is in accordance with both morphological and gametic variation. Using a statistical parsimony network based on these sequences and analysis of morphological data, past fragmentation and range expansion involving perhaps secondary contact between A. charrua and A. reicherti could be proposed. Coloration pattern and morphometric analyses showed an unexpected higher similarity between the most distantly-related taxa, A. viarius and A. charrua. This could be the result of retention of ancestral polymorphisms, especially in A. charrua populations from ponds of higher elevation, or to directional selection acting in similar ecological environments. Because these annual killifish species are considered endangered, our work reinforces the high priority need to include them in a conservation programme. © 2009 The Linnean Society of London, Biological Journal of the Linnean Society, 2009, 98, 620–635.
INTRODUCTION
The annual killifish genus Austrolebias includes approximately 38 species distributed in the Parana-Plata basin and the Patos-Merin coastal lagoon system (Costa, 2006). Although many taxonomic changes were recently made in the genus (Costa, 1998, 2002, 2006), the Austrolebias adloffi species complex remains as a well-supported clade (Costa, 2006; García, 2006). Species of this complex are distributed along Los Patos-Merín system lowlands, which include ‘Bañados del Este’, an area from eastern Uruguay (Fig. 1) that has been declared a Biosphere Reserve Site and a Ramsar Site (Probides, 1999). This is a vast area of Atlantic coastal wetlands of low relief and liable to seasonal flooding. It includes lagoons and several rivers originated during the Quaternary marine transgressions (Iriondo, 2004).
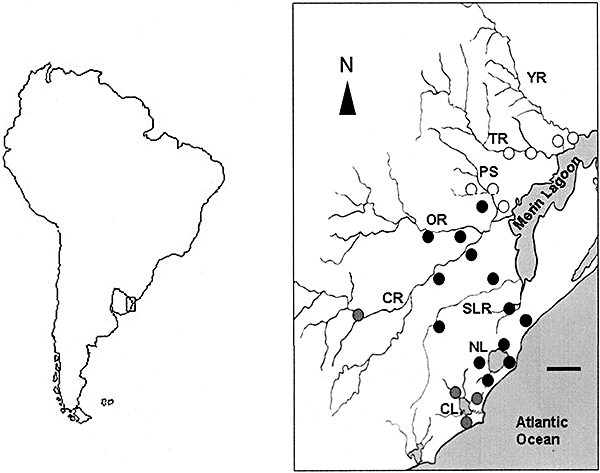
Distribution map of Austrolebias charrua (black circles), Austrolebias reicherti (white circles), and Austrolebias viarius (grey circles). Water bodies are indicated by capital letters: YR, Yaguarón river; TR, Tacuarí river; PS, Parao stream; OR, Olimar river; CR, Cebollatí river; SLR, San Luis river; NL, Negra lagoon; CL, Castillos lagoon. Scale bar = 20 km.
Currently, the A. adloffi species complex comprises: A. adloffi Ahl 1922; Austrolebias charrua Costa & Cheffe 2001; Austrolebias minuano Costa & Cheffe 2001; Austrolebias nigrofasciatus Costa & Cheffe 2001; Austrolebias reicherti Loureiro & García 2004 (Loureiro & García, 2008); Austrolebias arachan Loureiro, Azpelicueta & García 2004; and Austrolebias natchtigalli Costa & Cheffe 2006.
The Uruguayan populations of A. charrua were named previously as A. sp., A. adloffi-2 or A. cf. adloffi (García, Wlasiuk & Lessa, 2000; García, Alvarez-Valín & Gómez, 2002; García, Claramunt & Lalanne, 2004). This species was considered as an intergradation between the A. adloffi and Austrolebias viariusVaz-Ferreira, Sierra & Scaglia (1964) populations because it presents an intermediate phenotype, high levels of variation in colour patterns and morphological variability (Vaz-Ferreira & Melgarejo, 1984). Austrolebias charrua is parapatrically distributed in its western and southern limit with A. viarius, a species closely related to the A. adloffi species complex (Costa, 2006; García, 2006), with some populations separated only by a distance of 70 m between ponds. It is also parapatrically distributed in its northern limit with A. reicherti, which is distributed from the Parao stream basin to the southern Río Yaguarón basin (Fig. 1).
Based on molecular nuclear markers, García et al. (2004) proposed that populations of the A. adloffi complex from Uruguay (including A. charrua and A. reicherti) would represent an ancient homoploid hybrid ancestry between A. viarius and A. adloffi followed by its divergence during the Quaternary environmental changes. More recently, a phylogeographic approach based on mitochondrial cytochrome b (cyt b) haplotypes analysis and chromosome data have supported a different hypothesis (García, 2006). This suggested a multiple simultaneous speciation process and possible reticulation events in the A. adloffi complex, followed by divergence.
A recurrent theme in the speciation literature is how to discriminate between primary differentiation (associated with isolation by distance) versus secondary contact as a result of hybridization and introgression of previously fragmented lineages (Endler, 1977). Hybridization and its attendant complications represent a major stumbling block for many species concepts, both in theory and in practice (Hull, 1997).
In the present study, we incorporate different methodological approaches (molecular, morphology, and gamete ultrastructure) to elucidate the pattern of differentiation among these parapatric taxa (A. charrua, A. reicherti, and A. viarius) distributed in the Bañados del Este Biosphere Reserve, emphasizing the importance of conservation strategies in this fish group.
MATERIAL AND METHODS
Specimens examined
A total of 258 adult specimens of Austrolebias viarius, A. charrua, and A. reicherti from 29 localities were collected during the rainy season (May to August, 2001–06) in annual ponds from Rocha, Treinta y Tres, and Cerro Largo Departments, Uruguay (Fig. 1). Fishes were sacrificed with an overdose of 2-Phenoxyethanol and fixed in 10% formalin or alcohol 95%. For microanatomy analyses fishes were kept in the laboratory in 30 l aquaria, filled with continuously aerated and dechlorinated tap water (pH 7–7.5), and exposed to natural light. Water was partially changed every 5 days. Water temperature was (19 ± 1) C. Fishes were fed once a day with live Tubifex sp. Spawning occurred daily from fish pairs isolated in aquaria that had containers with peat moss on the bottom. Eggs were collected with a pipette from the peat moss and they were subsequently cleaned by rolling them with a soft paintbrush on filter paper moistened with aquarium water.
Molecular population analysis
Sampling and DNA extraction
A total of 83 individuals used in the phylogeographic study (see Appendix: technique SA) were collected from 25 natural ponds covering the geographic range of A. viarius, A. reicherti, and A. charrua in Uruguay and A. natchtigalli from R. Grande do Sul, Brazil (Fig. 1). Tissues and voucher specimens were deposited in the Sección Genética Evolutiva and in the fish Collection of Facultad de Ciencias, Universidad de la República, Montevideo, Uruguay.
Genomic DNA was isolated from liver tissue of freshly sacrificed animals (fixed in ethanol 95%) using extraction with sodium chloride protein precipitation, followed by ethanol precipitation, as modified from Medrano, Aasen & Sharrow (1990).
Mitochondrial cyt B sequences
A 815-bp fragment of cyt b was amplified using primers CB3-H and Gludg-L (Palumbi et al., 1991) using the polymerase chain reaction (PCR) cycle profile: 94 °C for 1 min, 45 °C for 1 min, and 72 °C for 1 min for 30 cycles). PCR products were cleaned with CONCERT Kit rapid PCR purification System (Life Technology), and amplified segments were sequenced in both strand directions using the same amplification primers with a Perkin-Elmer ABI Prism 377 automated sequencer. Sequence alignments were performed using CLUSTAL X (Thompson et al., 1997).
Statistical analysis of mitochondrial cyt B sequences
Nucleotide composition and substitution patterns were calculated using the software MEGA (Kumar et al., 2001) and DNASP4 (Rozas et al., 2003). The corrected estimates of pairwise sequence divergence were obtained using the two-parameter algorithm (K2P) of Kimura (1980) implemented in MEGA. Within a population, DNA polymorphism was measured calculating the proportion of segregating sites (S), the haplotype diversity (Nei, 1987: 179), and the nucleotide diversity p (Nei, 1987: 257) using ARLEQUIN (Schneider, Roessli & Excoffier, 2000) and DNASP4 (Rozas et al., 2003) software. Tajima's D (Tajima, 1989) was performed to test the significant excess of low-frecuency haplotypes aiming to evaluate the hypothesis of population expansion using ARLEQUIN software (Schneider et al., 2000).
Analysis of molecular variance and nested clade analysis
To examine the genetic structuring among taxa included in the A. adloffi species complex and A. viarius, the variance components among hierarchical partitions in the data set were assessed by analysis of molecular variance (amova; Excoffier, Smouse & Quattro, 1992). The Euclidean metric of Excoffier et al. (1992) was used to construct the matrix of pairwise distances. Because of the high phylogenetic relationship among A. adloffi species complex, each taxon was assigned to different groups and subregions. The genetic variation was partitioned into three components: among groups, among populations within groups, and among individuals, disregarding either their original populations or their groups.
Population subdivision and the level of genetic isolation among parapatric populations of these taxa were measured assuming an infinite sites model (Kimura & Crow, 1964). Pairwise estimates of ΦST were calculated using ARLEQUIN (Schneider et al., 2000) to generate indirect pairwise estimates of gene flow: Nfm½[(1/FST) − 1] (Wright, 1951).
A nested clade phylogeographic analysis (NCA; Templeton, Routman & Phillips, 1995) was implemented to assess the historical and contemporary components of mitochondrial DNA variability among A. adloffi complex taxa. The parsimony network was reconstructed using an algorithm described by Templeton, Crandall & Sing (1992). This cladogram included the haplotypes belonging to the parapatric and sister taxa A. charrua, A. reicherti, and A. nachtigalli and was reconstructed using the software TCS, version 1.06 (Clement, Posada & Crandall, 2000). The final nested clade topology was obtained manually sensuCrandall & Templeton (1993, 1996). To test the null hypothesis that the haplotypes or clades nested within a high level nesting clade show no geographical associations given their overall frequencies, we used the software GEODIS, version 2.0 (Posada, Crandall & Templeton, 2000). This analysis produced statistics related to the data distances: internal clade distance (Dc), between clades (Dn) and between interior and tip clades (I–T). We performed 1000 permutations, which is the number recommended for a 5% level of statistical significance. Results obtained from GEODIS were then interpreted using the revised inference key of Templeton (2004) to elucidate the alternative historical scenarios of taxa differentiation.
Molecular clock for cyt B sequences
A substitution rate of 2% per million years based on K2P divergence rates (only considering Tv = transversions) was assumed, as proposed for the genus Cynolebias (García et al., 2000, 2002) and tested in other cyprinodontiforms (Mateos, Sanjur & Vrijenhoek, 2002). Although this molecular calibration is very approximate and is subject to considerable uncertainty, it was consistent with the complex Quaternary geological history of the southern Atlantic coastal wetlands (Sprechman, 1978; Montaña & Bossi, 1995).
Morphology
Meristics and pigmentation
Meristic variables analysed (N = 258; Appendix, technique MA) and their correspondent abbreviations were: dorsal fin rays (D), anal fin rays (A), caudal fin rays (C), pectoral fin rays (PC), pelvic fin rays (PV), lateral series of scales (LS), scales around the caudal peduncle (PS), predorsal series of scales (PRS), supraorbital scales (SS), and number of neuromasts in the supraorbital series (SN). Because vertical dark bands in males are characteristic of these fishes and their thickness is highly variable, the ratio between band thickness and band interspace was also calculated (for comparative purposes A. adloffi was included in this analysis).
Geometrical morphology
Shape variation was analysed through a geometric morphometry using the thin plate spline (Bookstein, 1991; Monteiro & dos Reis, 2000), methodological details sensuD'Anatro & Loureiro (2005). A discriminant function analysis was performed over the partial warp matrix and the uniform component scores generated by the software tpsRegr, version 1.24 (Rohlf, 2003) to examine the extent to which landmarks reveal phenetic clusters of individuals of different shape. Canonical axes were demonstrated in shape space by multivariate regression of partial warps, as well as uniform component scores on canonical scores of the two roots obtained with tpsRegr.
Because of a pronounced sexual dimorphism, data of males and females were analysed separately. Statistical differences between groups centroids was tested using multivariate analysis of variance (P = 0.05).
Gamete ultrastructural analysis
Scanning electron microscopy (SEM) studies of ripe oocytes obtained from females of the three species (see Appendix: technique GU) were processed sensuArezo, Pereiro & Berois (2005). Oocyte surfaces were examined and photographed with a JEOL JSM 5900 LV scanning electron microscope.
From the SEM photographs, the thickness of 1800 filament bases (600 per species) belonging to eggs and females from at least three ponds per species was measured with the software IMAGEJ, version 1.38x (http://rsb.info.nih.gov/ij/). Given that the measures from the filaments of each egg did not fit a normal distribution, the medians were compared using the Kruskal–Wallis test among the intraspecific eggs. Measurements of all the eggs of each species were grouped as a single distribution. Normality was tested and the Kruskal–Wallis test applied again. A Mann–Whitney-Wilcoxon nonparametric test was performed among the species. P < 0.05 was considered statistically significant for all tests.
For transmission electron microscopy (TEM) analyses, three adult males of each of the three species were previously anesthetized with 2-phenoxyethanol 3 : 1000 and then killed by decapitation. Fragments of fresh testes tissue were fixed overnight at 4 °C in a 4% solution of paraformaldehyde and 2.5% glutaraldehyde in buffer phosphate 0.1 m (pH 7.4) and post-fixed in a 1% solution of osmium tetroxide in phosphate buffer, for 1 h at room temperature. The samples were processed by the standard procedure for TEM.
Observations were made with a JEOL JEM 1010 transmission electron microscope operating at 80 kV. Images were captured with a Hamamatsu C-4742-95 digital camera.
RESULTS
Mitochondrial cyt B variation among A. adloffi species complex and A. viarius
The present study included 83 mitochondrial cyt b sequences belonging to three taxa from the A. adloffi species complex and A. viarius. The GenBank accession numbers are provided in the Appendix.
Table 1 shows variable and phylogenetically informative sites among the 815 bp cyt b sequenced, as well as the number of haplotypes found in each taxon in samples of at least two individuals. High values of haplotype diversity have been found in the range 0.76–0.80 within the A. adloffi species complex and A. viarius (Table 1). Except for the most common haplotypes (haps1 and 2 in A. charrua; haps 1 and 3 in A reicherti and hap 3 in A. viarius), the remaining haplotypes showed a frequency of 1/N, representing rare alleles restricted to one collecting site and explaining the high observed haplotype diversity. The proportion of segregating sites (S) ranged from 0.029 in A. reicherti to 0.044 in A. charrua. The nucleotide diversity (p) ranged from 1.3% in A. reicherti to 2.0% in A. charrua. The average of the corrected K2P sequence divergence (Table 1) ranged from 2.0% (SE = 0.008) in A. viarius to 3.4% in A. charrua showing the highest value (SE = 0.009).
| Variables sites | Phylogenetically informative sites sites sites | S | Number of Haplotype diversity | Haplotype diversity | π | Kimura 2-P distance (Tv + Ts) | D | |
|---|---|---|---|---|---|---|---|---|
| Austrolebias viarius | 110 | 32 | 0.039 | 8 | 0.800 | 0.016 | 0.020 | −1.4477 |
| (0.092) | (0.006) | (0.008) | P > 0.10 (NS) | |||||
| Austrolebias reicherti | 104 | 24 | 0.029 | 12 | 0.900 | 0.013 | 0.032 | −2.0717 |
| (0.059) | (0.003) | (0.011) | P < 0.05* | |||||
| Austrolebias charrua | 125 | 36 | 0.044 | 11 | 0.761 | 0.020 | 0.034 | −2.2036 |
| (0.082) | (0.004) | (0.009) | P < 0.05* |
- S, proportion of segregating sites; Haplotype (gene) diversity (Nei 1987), π = nucleotide diversity (Nei, 1987). The mean (SD) of the corrected Kimura 2-P (1980) distances is shown. D, neutrality test (Tajima, 1989).
- * Statistical significance (P < 0.05).
The pairwise K2P sequence divergence among the taxa of the A. adloffi species complex and A. viarius showed the greatest divergence between A. viarius and A. reicherti (21.5%, SE = 0.023), whereas the most genetic similarity was found between A. charrua and A. natchigalli at 5.7% (SE = 0.008).
NCA, AMOVA, and population demographic parameters
Gene genealogy reconstruction resulted in a cladogram (Fig. 2) that could be connected with 95% confidence level using the statistical parsimony approach implemented in TCS (Templeton, Boerwinkle & Sing, 1987). Among 27 clades obtained for step-clades from 1–3, no significant distances were found (Dc, Dn or I–T) excepting for two one-step clades (clades 1-11 and 1-12) and three two-step clades (2-1, 2-2 and 2-3) (Table 2). These two-step clades group ten haplotypes from A. charrua (2-1 clade), whereas all haplotypes from A. reicherti were associated with the 2-2 and 2-3 clades. Most of the species have one or more central haplotypes conforming star-like topologies. Within A. charrua (2-1 clade), the central and ancestral haplotype 11 from pond number 66 (Fig. 2), which was restricted to upland ponds, connected through five missing haplotypes to the more frequent haplotype 1, which shows an extensive geographic distribution throughout the Atlantic coastal wetlands. Also, only five mutations separated haplotype 11 from its sister taxon, A. natchigalli. Remarkably, the haplotype 11 of A. charrua connected with haplotype 6 of A. reicherti through nine missing haplotypes. Based on present NCA, the most geographically distant haplotype 12 of A. reicherti shows the highest outgroup probability (Fig. 2). Haplotype 5 and 10, which represent the central haplotypes at clades 2-2 and 2-3, respectively, were separated through three missing haplotypes. Except haplotype 1, which was distributed in four ponds from the southern and northern Tacuarí River, the remaining haplotypes inhabit different and single ponds.
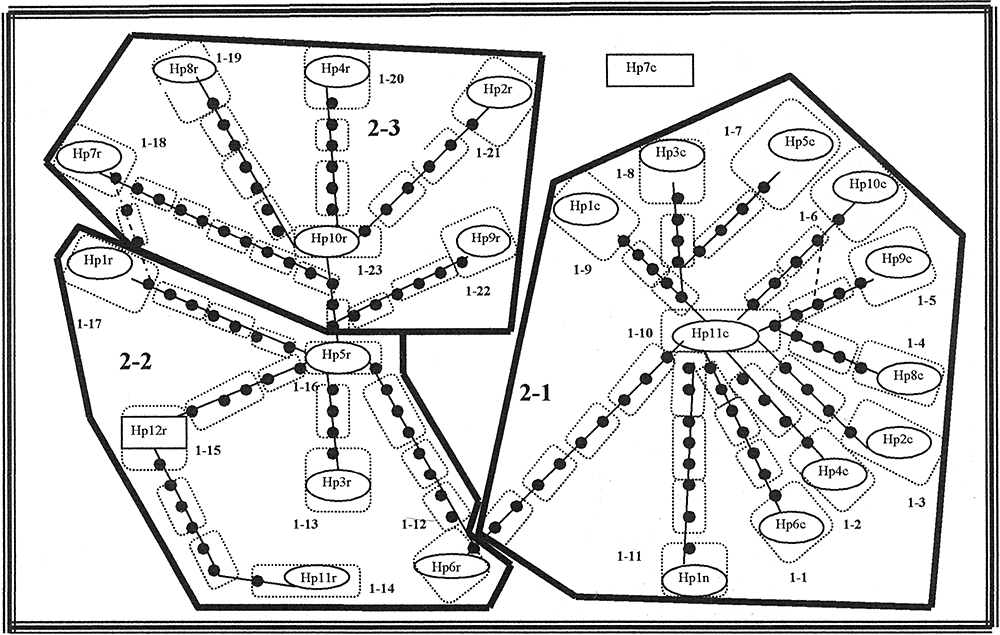
Maximum parsimony network and the corresponding nested design for cytochrome b haplotypes for the sister taxa of the Austrolebias adloffi species complex: Austrolebias charrua (step-clade 2-1), Austrolebias reicherti (step-clades 2-2 and 2-3), and Austrolebias nachtigalli (step-clade 1-11). The cladogram was estimated under the 95% statistical limits of parsimony using the algorithm described in Templeton et al. (1992). Oval includes haplotypes number (0-step clades). Solid circles represent hypothetical haplotypes. Thin-lined polygons enclose one-step clades; thick-lined polygons enclose two-step clades and the thick line includes the total cladogram. Specimens and the respective haplotype are listed in the Appendix.
| Clade | Inference chain | Inferred pattern |
|---|---|---|
| Clade 1-11 | 1-19- No | Allopatric fragmentation |
| Clade 1-12 | 1-2-3-5-6-13-14-No | Long distance colonization and/or past fragmentation (not necessarily mutually exclusive). |
| Clade 2-1 | 1-19-20-2-12-13-21-Yes | Long distance colonization |
| Coupled with subsequent fragmentation or past fragmentation followed by range expansion. | ||
| Clade 2-2 | 1-2-3-5-15-21-Yes | Past fragmentation followed range expansion involving secondary contact. |
| Clade 2-3 | 1-2-3-5-15-No | Past fragmentation followed range expansion |
The analyses of molecular variance of all taxa indicates that most of the genetic variation among the cyt b haplotypes was distributed among groups (84.73%), suggesting a high level of population structure among these taxa. Low levels of variation were found within population (15.20%).
Table 1 shows a significant excess of low-frequency haplotypes in A. charrua (D = −2.2036, P < 0.05) and A. reicherti (D = −2.0717, P < 0.05).
The indirect estimate of gene flow from mitochondrial haplotypes reveals the existence of no genetic exchange among A. charrua, A. reicherti, and A. viarius. Remarkably, within each taxon, we estimated a highly variable level of gene flow. Some populations of A. charrua (ponds 6 and 8–9) and of A. viarius (ponds 10–16 and Pirarajá-Retamosa) remain partially isolated from the rest. The indirect estimate of gene flow suggests genetic exchange between haplotypes of A. nachtigalli and A. charrua in pond 32 at the Southern Merin Lagoon.
Molecular clock estimate
We suggest that lineage differentiation among the studied taxa occurred in a ‘wave’ of cladogenesis events. The most recent events are estimated to have occurred 450 000 years ago and 1.0 Mya (mid and late Pleistocene) and resulted in the split of A. nachtigalli and A. reicherti from A. charrua populations. A second and basal event, as old as 3 Mya (early Pleistocene), represents the divergence between A. viarius and the A. adloffi species complex. These time computations are tentative and cannot be indirectly verified because of the lack of a fossil record for Rivulidae.
Morphology
Meristics and pigmentation
The canonical analysis of meristic data showed a high overlap between species in both sexes (Fig. 3); however, the overlap was greater in females where the variability of A. charrua includes that of the other two species. Concerning the coloration design analysed (ratio band/interband space), variability was greatest in A. viarius males, followed by A. charrua. In A. reicherti, as well as in A. adloffi (used for comparative purposes), variability of this character was similar and extremely low (Fig. 4)
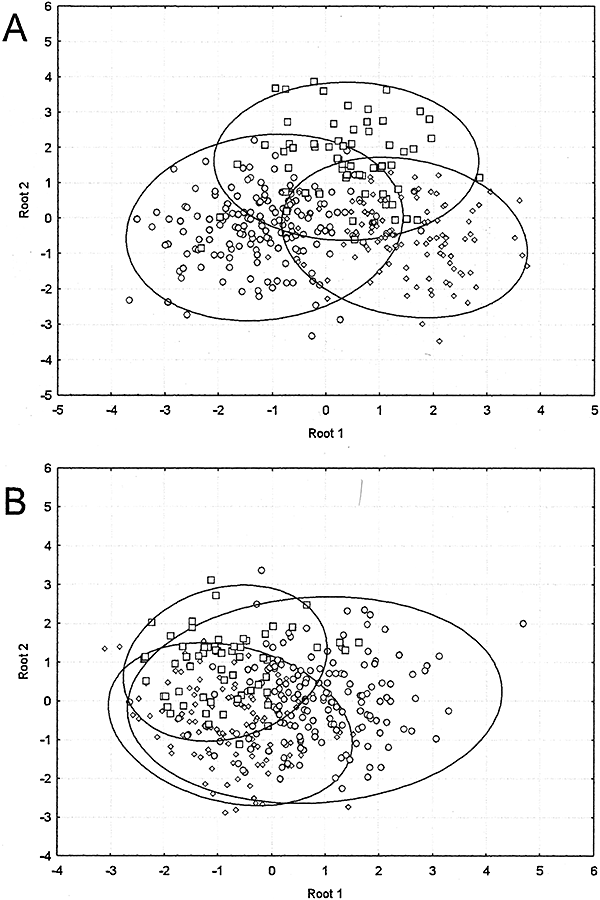
Discriminant analysis of meristic characters of the species analysed. A, Males. B, Females. Circles, Austrolebias charrua; diamonds, Austrolebias viarius; squares, Austrolebias reicherti.
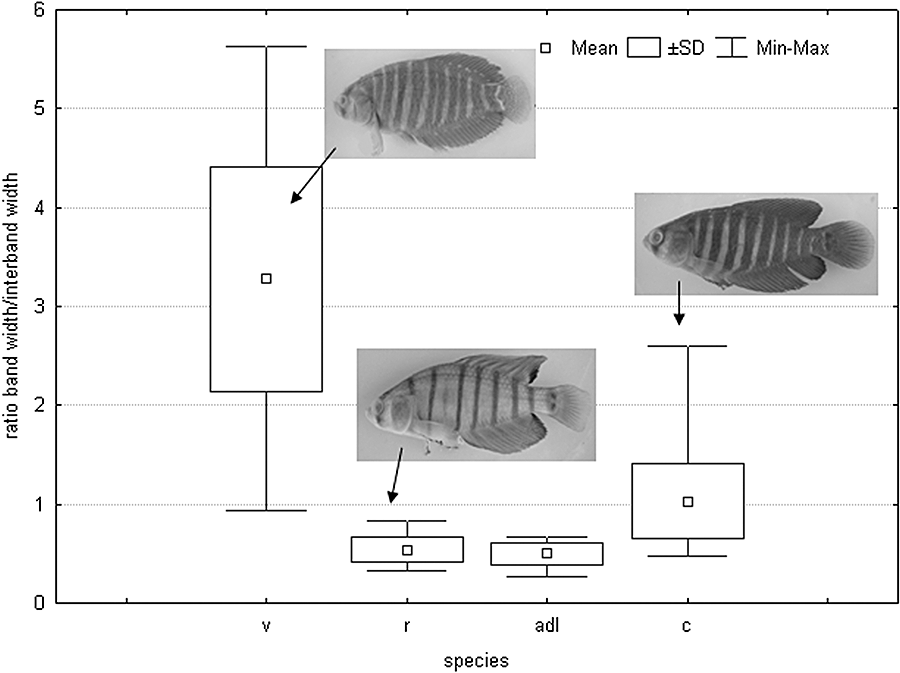
Box plot of band thickness and inter band space ratio. v, Austrolebias viarius; r, Austrolebias reicherti; adl, Austrolebias adloffi; c, Austrolebias charrua.
Morphometric analysis
Analysis of males showed partial discrimination among species (8% of total individuals misclassified), although group centroids were significantly different (F = 6.33; P = 0.00). Squared Mahalanobis distances between group centroids are shown in Table 3. Root 1 discriminated between A. reicherti and the other two species, with shape changes associated with an elongation of the head and an anterior position of dorsal fin (Fig. 5). Root 2 discriminated between A. charrua and the other species, with shape changes associated with a decrease in head size and an elongation of the base of the anal fin (Fig. 5). Females showed more discrimination in shape than males (6% of total individuals misclassified), as well as significant differences among groups' centroids.
| Austrolebias viarius | Austrolebias charrua | Austrolebias reicherti | |
|---|---|---|---|
| Austrolebias viarius | – | 17.8 | 12.30 |
| Austrolebias charrua | 7.9 | – | 9.12 |
| Austrolebias reicherti | 12.8 | 9.9 | – |
- Females over diagonal; males below diagonal.
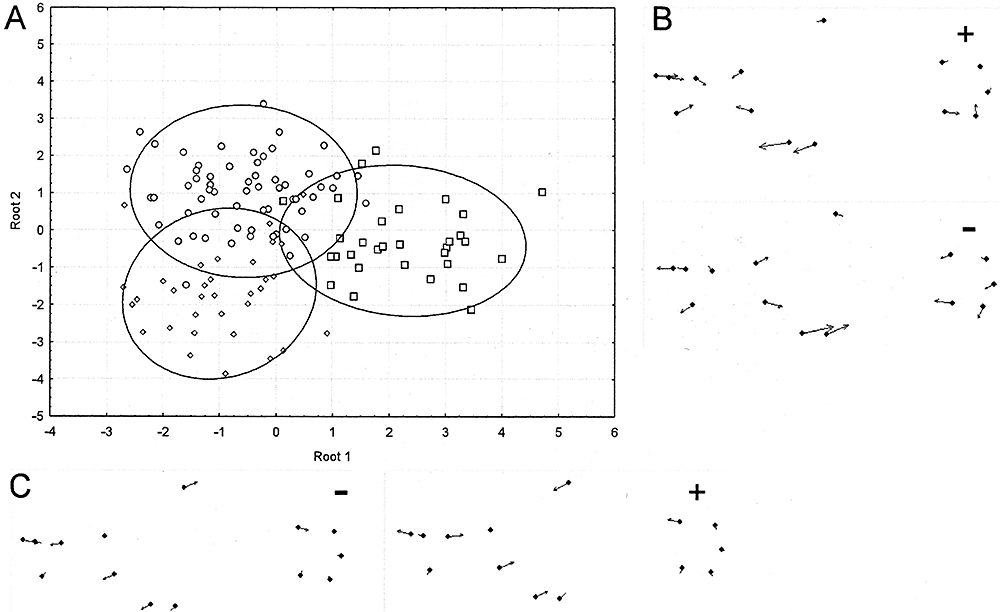
A, discriminant analysis of male morphometry of the species analysed. B, shape changes associated with Root 2. C, shape changes associated with Root 1. Circles, Austrolebias charrua; diamonds, Austrolebias viarius; squares, Austrolebias reicherti. +, positive values; −, negative values. The magnitude of arrows is magnified three times.
(F = 9.01, P = 0.00). Squared Mahalanobis distances between group centroids are shown in Table 3. Austrolebias viarius was located in the negative values of Root 1, associated with a head size increase and a posterior displacement of pelvic and anal fins; A. charrua was located in the positive values (with opposite shape changes), whereas A. reicherti presented an intermediate shape (Fig. 6). Furthermore, Root 2 discriminated A. reicherti from the other two species; shape changes were associated with a decrease in body depth (Fig. 6).
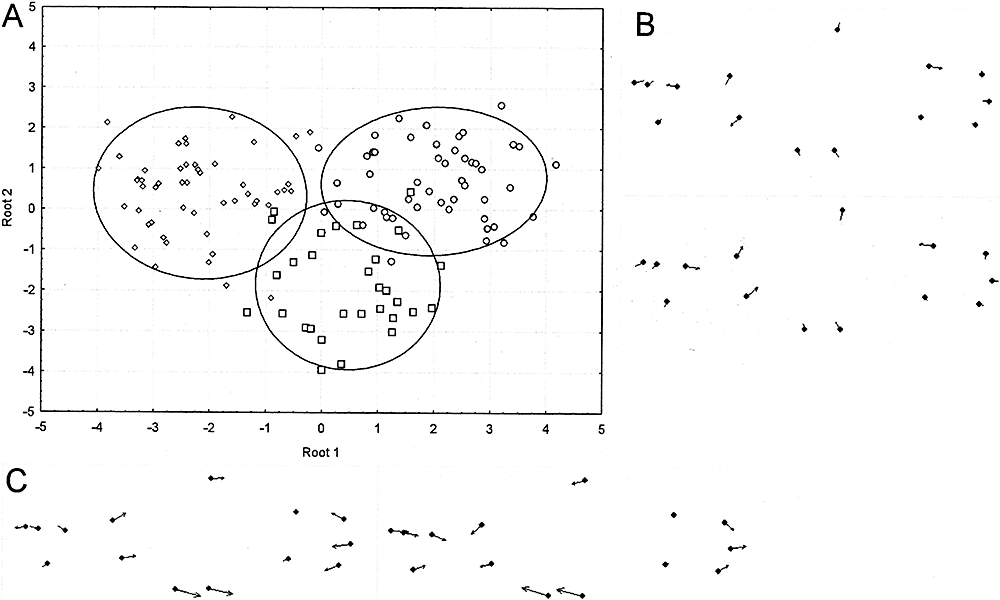
A, discriminant analysis of female morphometry of the species analysed. B, shape changes associated with Root 2. C, shape changes associated with Root 1. Circles, Austrolebias charrua; diamonds, Austrolebias viarius; squares, Austrolebias reicherti. +, positive values; −, negative values. The magnitude of arrows is magnified three times.
Gamete ultrastructure
Vitelline envelope surface
SEM analyses of eggs' envelopes of the three species show a rough outer surface ornamented by dense hair-like projections of different thickness. The filaments of all species have an overall cone-shaped morphology (Fig. 7A).
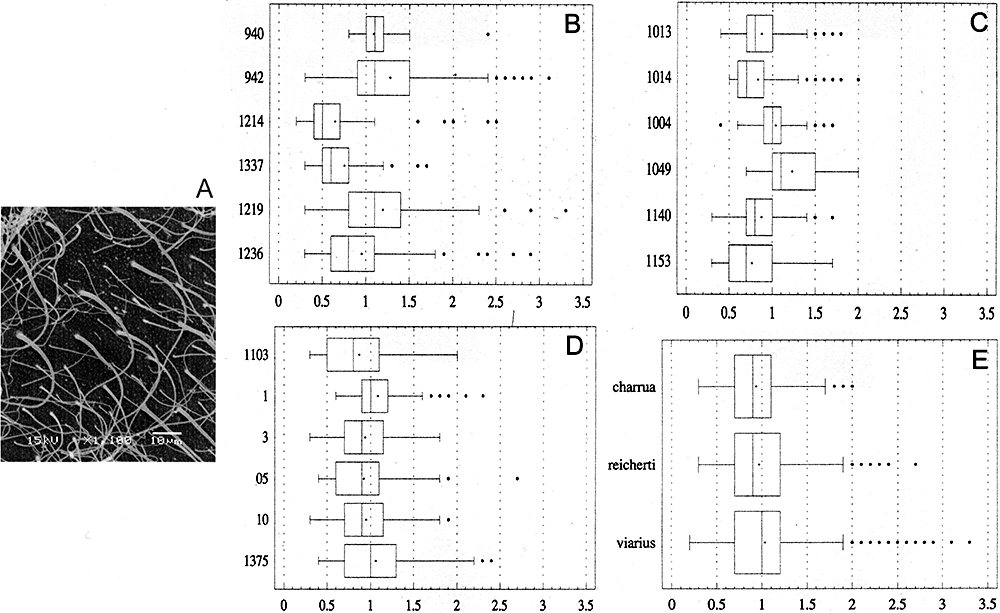
Ultrastructural analyses of the surface of the oocyte. A, scanning electron microscopy of the vitelline envelope of Austrolebias reicherti showing the hair-like filaments. The image was selected as representative for the three species. B, C, D, box-and whisker diagram of the distribution of the data for Austrolebias viarius, Austrolebias charrua, and A. reicherti, respectively. E, box-and whisker diagram showing the distribution of the data for the three species taking every one as a whole. The y-axis shows the individuals or species and the x-axis represents the measures (in µm). A cross indicates the mean, the middle line of the boxes indicates the median, the right of box indicates the 75th quartile and the left of box indicates the 25th quartile. Dots represent outliers.
The quantitative data resulting from measurements of the filament bases are summarized in box-and-whisker plots (Fig. 7B, C, D, E). Individuals of the same species showed statistically significant difference among the medians (A. charrua: W = 145.966, P = 0; A. reicherti: W = 29.9626, P < 0.01; and A. viarius: W = 167.617, P = 0). The test comparing the species produced the same results (W = 12.4893, P < 0.01). When the Mann–Whitney Wilcoxon test was applied, a statistically significant difference appeared between A. viarius/A. reicherti (W = 192 197.00, P = 0.0414) and A. viarius/A. charrua (W = 201 314.00, P < 0.01). Nevertheless, there is no statistically significant difference between the medians of A. reicherti and A. charrua (W = 188 173.00, P = 0.1714).
Sperm flagellum
The three species exhibit sperms with a long flagellum with wing-like lateral periaxonemal fins, which show differences among species. In A. reicherti (Fig. 8A) and A. viarius (Fig. 8B), most spermatozoa have two lateral fins. Nevertheless, in A. reicherti, it is possible to occasionally find some gametes with three lateral extensions. In A. charrua, the number of these projections is especially variable, demonstrating from two to four fins in the same specimen (Fig. 8C).
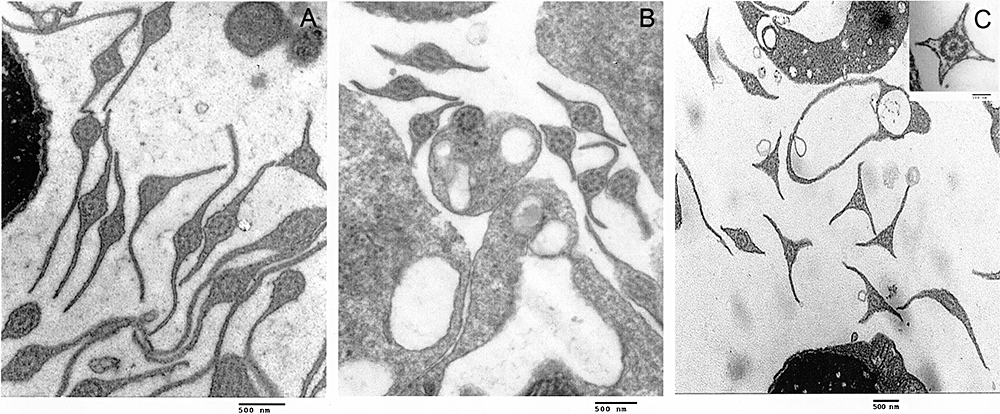
Transmission electron micrographies of transversal sections of sperm flagellum of three Austrolebias species: Austrolebias reicherti (A), Austrolebias viarius (B), and Austrolebias charrua (C). The flagellum has the 9 + 2 axonemal doublet configuration. Note that the presence of two lateral membrane projections is the most common character in (A) and (B), whereas, in (C), the flagellum show two up to four (insert) lateral fins. Scale bar in (A, B, C) = 0.5 µm; insert = 0.1 µm.
DISCUSSION
Phylogeographic pattern and historical demographic scenarios in the A. adloffi species complex
The cyt b analyses supports the high levels of DNA polymorphism, in particular in A. charrua (Table 1), previously reported for Austrolebias (García, 2006). The levels of polymorphism are similar to those published for species of Cyprinodon from Mexico based on mitochondrial D-loop sequences (Strecker, 2006).
Nested clade phylogeographic analysis yielded a cladogram, with a 95% degree of confidence, in which ten A. charrua haplotypes (including that of A. nachtigalli) and all of A. reicherti haplotypes remain connected (Fig. 2). Nevertheless, the results of the amova strongly support the genetic distinctiveness among these taxa, supporting the validity of their taxonomic status of the recently described species.
The NCA shows two major distinct lineages corresponding to A. charrua (clade 2-1), including the A. nachtigalli haplotype and A. reicherti. The later taxon further splits into two main lineages: clades 2-2 and 2-3. These step-clade of level 2 remain connected through haplotypes 11 of A. charrua and six of A. reicherti, which inhabit the pond 55 in a border area between the distribution of both taxa (1, 2).
The results of the present study agree with previous phylogenetic analyses in which A. viarius represents the sister taxon to the A. adloffi species complex (Costa, 2006; García, 2006), whereas A. charrua, A. nachtigalli, and A. reicherti appear as sister taxa within such species complex (García et al., 2004; García, 2006).
In accordance with the biological key of Posada, Crandall & Templeton (2006), for the majority of clades, we cannot reject the null hypothesis. However, based on the statistical significant values found in any step-clades (Fig. 2; Table 2), allopatric fragmentation, long-distance colonization, and/or past fragmentation could be inferred from the present data set. Subsequently, we incorporated Templeton's supplementary test for secondary contact, which confirmed such hypothesis. SensuTempleton (2001), when secondary contact occurs between previously fragmented populations, haplotypes or clades with very divergent geographical centres can be placed at the same locality or in the neighbouring locality, as could be observed in the present study in relation to clade 2-1 (A. charrua) and clade 2-2 (A. reicherti) and their peculiar connections through the haplotype 6 from A. reicherti. The location of contact between the major lineages (clade 2-1 versus clades 2-2, 2-3) is consistent with two waves of population expansion diverging over the Northern and the Southern Tacuari river, respectively, and subsequently meeting at the Southern one (Fig. 1). A potential demographic expansion scenario is also supported by the star-like topologies around A. charrua clades 1-10 and A. reicherti clades 1-16 and 1-23 (Fig. 2) and in the significantly negative Tajima's D-values found in both taxa (Table 1). Because statistics D cannot discriminate between the patterns of haplotype diversity generated under this model and those generated under selection against slightly deleterious mutations in the cyt b gene, both hypotheses are nonmutually exclusive with the present data. Therefore past allopatric fragmentation and range expansion involving perhaps secondary contacts could be the most plausible explanation. This hypothesis is congruent with previous molecular population analyses of the A. adloffi species complex (García et al., 2004; García, 2006). Moreover, the current hydrological pattern of flooding in the area could support this scenario. When the Cebollatí river outflows, the excess water flows southward where the remaining localities of A. charrua occur, favouring a population dispersion from northern and higher localities to southern and lowland localities. In this context, it has to be considered that lowland localities were colonized more recently because they were the most affected by recent marine transgressions reported in the region (Sprechman, 1978; García-Rodriguez & Witkowaki, 2003).
The indirect estimate of gene flow based on present data set reveals the current lack of genetic exchange among A. charrua, A. reicherti, and A. viarius; therefore, in most cases, the former taxa could represent incipient species formed at a distance. Nevertheless, the wide range of gene flow values within each taxon could indicate that this factor is not homogeneous among ponds. Individuals from pond 66, located in the higher lands of the Merin Lagoon basin, showed a Nm values between 0.5 and 1 (or higher than) in relation to the remaining ponds of the same taxon and to those of A. reicherti and A. nachtigalli. This might suggest that current gene flow is a weak genetically cohesive factor but probably sufficient to retain genetic relationships among populations of these taxa. Jiggins & Mallet (2000) reported that parapatric populations surveyed by them showed secondary contact between previously allopatric taxa, with all degrees of gene flow depending on the amount of reproductive isolation that had evolved in allopatry. Therefore, based on corrected pairwise genetic distances, NCA (Fig. 2), and the indirect estimates of gene flow, A. nachtigalli remains integrated genetically within A. charrua populations and no reproductive isolation from this taxon was detected.
However, we cannot rule out that the intermediate haplotype 6 from A reicherti located between the range of expansion from both major clades including A. charrua and A. reicherti haplotypes (2-1 versus 2-2 and 2-3 clades) could reflect an incomplete lineage sorting after the occurrence of past fragmentation and cladogenetic events during the Pleistocene.
Evolutionary scenarios for taxa differentiation versus morphological features
The present morphological analyses yielded different possible scenarios for taxa differentiation. Meristic variation observed in females favours a secondary contact event because A. charrua variation includes and surpasses the other two species considered. However, the variation in colour patterns in males considered in the present study does not support this view. Although A. reicherti and other related species of the A. adloffi complex present a pattern of thin dark lateral bands on body, A. charrua presents variation of this character similar to the parapatric and more ancient A. viarius. An alternative hypothesis about the retention of ancestral characters in A. charrua cannot be excluded. Morphometric results in males show the same pattern (i.e. males of A. charrua are more similar to A. viarius than to A. reicherti).
Furthermore, another possible scenario yielding similarities between A. charrua and A. viarius males could be the shared ecological context. Both species are sympatric and even syntopic in some ponds with other three annual fish species that are considered to be the top predators of temporary ponds. Because males are more exposed to predation as a result of their active courtship behaviour (see below), similarity in body shape and coloration patterns could be a response to predator selective pressures.
Finally, sexual dimorphism in annual fishes involves colour patterns (i.e. males with conspicuous pigmentation in body and fins), morphology (i.e. males with longer unpaired fins), and courtship behaviour (Vaz-Ferreira et al., 1964; Belote & Costa, 2004; García, Loureiro & Tassino, 2008). This also appears to be reflected in differences in morphological discrimination between males and females. At the level of meristic and coloration characters, females are more homogeneous across species (present study) and within species (D'Anatro & Loureiro, 2005) than males. All this evidence points to sexual selection, especially female choice, as representing a strong force in annual fishes evolution. However, when body shape is considered, females are more differentiated than males, as expressed by the lower percentage of misclassification and greater Mahalanobis distances among group centroids. A more conservative body shape in males points to other sexual selection mechanism, such as male competition for mates. This behaviour has already been observed in other species of the genus (Vaz-Ferreira et al., 1964) as well as in A. reicherti (B. Tassino, pers. comm.).
Gametic isolation is likely to be important in preventing current gene flow in many species. Such isolation probably evolves rapidly, at least in animals, because gametic barriers may be a by-product of sexual selection (Coyne & Orr, 2004).
Studies on sperm and oocyte envelope ultrastructural features have been proposed as useful characters to be considered for identification of different teleost species (Jamieson, 1991; Li, Wu & Yang, 2000; Esmaeili & Johal, 2005; Gwo et al., 2006). According to the present study, data from gamete ultrastructure might also prove useful for inferring phylogenetic relationships and possible mechanisms of pre-zygotic isolation among parapatric taxa.
SEM analyses of egg envelope in A. viarius (Arezo et al., 2005), A. charrua (Arezo et al., 2007), and A. reicherti (present study) revealed a rough outer surface (sticky in vivo) that was ornamented by prominent filaments. The overall morphology was similar in the three species not showing a species-specific pattern. However, quantitative data from filament base thickness indicate statistical significant differences when A. viarius was compared with A. reicherti and A. charrua, respectively. Nevertheless, there were no statistical significant differences between A. charrua and A. reicherti, suggesting that these two species are more closely related. These results are concordant with the high phylogenetic relationships emerging from the NCA discussed above.
The species of Austrolebias studied possess a typical uniflagellate anacrosomal aquasperm. The presence of periaxonemal lateral membrane projection is a frequent trait in the sperm of many species of fishes and a general condition for Atherinomorpha (Jamieson, 1991). It was suggested that the occurrence of this character most likely contributes to increase the efficiency of flagellar movement (Thiaw et al., 1986). Although A. viarius and A. reicherti agree with the general pattern of two flagellar projections, A. charrua presents a high level of polymorphism, demonstrating from two up to four wings even in the same individual. Similar results were previously reported for seven genera and 15 species of teleostean fishes of the family Cyprinodontidae, which shows a wide diversity of structure of the spermatic flagellum (Thiaw et al., 1986). Sperm with two and sometimes three lateral fins in the same specimen were also detected in A. reicherti but at a lower frequency than in A. charrua. This pattern of lateral fins shared by both taxa suggests their close relationship. These findings imply that the morphology of the sperm tail may be an additional character to suggest a phylogenetic relationship among Austrolebias species.
Gamete isolating mechanisms should be common among closely-related taxa, especially geographical isolated populations of a single species. This type of isolation may entail more than one type of evolutionary change (Coyne & Orr, 2004). Conversely, morphological gamete similarities detected in the present study between A. reicherti and A. charrua (A. adloffi complex) support the idea that these highly-related taxa have emerged from more recent cladogenetic events.
Conclusions
The results from the combined analyses developed in the present study suggest the existence of chronological events in the differentiation of the studied parapatric taxa.
First, past allopatric fragmentation and range expansion possibly involving secondary contact could be a plausible hypothesis of differentiation among the A. adloffi species complex. Events of explosive speciation involving A. charrua and A. reicherti likely occurred during the Late Pleistocene (1.25 Mya to 450 000 years ago) in agreement with a molecular clock estimate based on cyt b sequences and in accordance with the geological scenarios in this region. Gametic morphology similarities support their more recent separation. Two waves of population expansion of A. reicherti, diverging over the Northern and the Southern Tacuari river and meeting A. charrua secondarily in the lower Cebollatí River basin, are proposed in the present study. This area could represent a parapatry/sympatry intergradation zone reflecting a current localized introgression.
Alternatively, the observed phylogeographic pattern could be explained through an incomplete lineage sorting after explosive cladogenetic events during the Pleistocene. Therefore, these species within the A. adloffi complex show evidence of hybridization, lineage sorting, or both.
Additionally, the lowlands where these species are distributed are subject to strong impacts. The demand for land for agricultural activities such as rice crops leads to wetland draining, with the potential of completely drying out the temporary ponds that comprise their habitat. The present study reinforces the inclusion of the relictual group of A. charrua populations from the highland ponds, which preserve ancestral polymorphisms, in a priority conservation program.
ACKNOWLEDGEMENTS
We thank W.J.E.M. Costa for kindly providing specimens of A. nachtigalli from RS Brazil (1997); Clemente Olivera for field collection support, Nicolás Papa for the maintenance of fishes in laboratory conditions and Rafael O. de Sá for invaluable language and content revision. The manuscript benefited from the criticisms of reviewers. We are grateful to grants for molecular research to G. García furnished by Killi Data Organization Museum National d' Histoire Naturelle, France (2006–07) and to PEDECIBA for financial support to Marcelo Loureiro. The authors are also grateful to the Japanese government for donating equipment.
Appendix
| Species | Locality | Latitide/longitude | GenBank accession number | ZVC-P | Analysis |
|---|---|---|---|---|---|
| Austrolebias charrua | Dept. Rocha (Uruguay) | ||||
| Road 19 km 6.5–7 (ch33) | 33°41′19″S/53°31′36″W | AY724390, AY724391, AY724379-AY724380 | 900 | S, M | |
| Road 9 km 272 (ch6) | 34°12′54″S/53°46′18″W | AY724377 | 4178 | S, M | |
| Road 13 and Road 16 (ch8) | 34°03′34″S/53°51′17″W | AY724390-AY724409 | 4135 | S, M | |
| Road 14 km 489.5 (ch28) | 33°54′09″S/53°40′38″W | AY724400 | 3886 | M | |
| Road 9 km 302 | 34°01′39″S/53°35′35″W | 3954 | S, M | ||
| Road 9 km 336.5 (ch32) | 33°45′19″S/53°26′09″W | AY724399, AY724378-AY724410, AY724404 | 3952 | S, M, G | |
| Road 19 km close to San Luis stream (ch35) | 33°36′03″S/53°43′29″W | 3943 | M, G | ||
| Road 15 km 151.5 (ch37) | 33°35′04″S/54°04′10″W | AY724381, AY724406, AY724405 | 3953 | S, M | |
| Road 16 km 34.5 (ch38) | 33°59′48″S/53°49′03″W | 3948 | M, G | ||
| Road 15 km 173 (ch44) | 33°28′13″S/53°52″11″W | 4137 | S, M | ||
| Road 9 km 272 (ch50) | 34°12′18′S/53°46′28″W | 4134 | S, M | ||
| Dept. Treinta y Tres (Uruguay) | |||||
| Road 91, close to Corrales del Parao stream (ch54) | 33°00′06″S/53°52′22″W | AY724390, AY724390-AY724389 | 4175 | S, M | |
| Road 8, close to treinta y tres city (ch66) | 33°13′32″S/54°23′45″W | S | |||
| Road 91 10 km to the North of Charqueada town (ch53) | 33°09′04″S/53°52′27″W | 4171 | S, M | ||
| Austrolebias viarius | Dept. Rocha (Uruguay) | ||||
| Road 10 km 250 (ch1) | 34°28′35″S/53°59′50″W | AY724408 | 3967 | S, M | |
| Road 10 km 253.5 (ch3) | 34°27′09″/53°56′37″W | 3965 | M, G | ||
| Road 16 km 2.5 (ch11) | 34°16′18′S/53°47′58″W | AY724383, AY724384, AY724408, AY724382 | 3969 | S, M | |
| Road 10 km 266.5 (ch4) | 34°22′09′S/53°50′32″W | AY724387, AY724386 | 4173 | S, M | |
| Road 9 km 228.5 (ch17) | 34°24′10′S/54°07′26″W | 3970 | M, G | ||
| Road 9 km 272 (ch23) | 34°12′55′S/53°43′16″W | AY724385 | 3975 | S, M | |
| Road 9 km 272 (ch49) | 34°12′44″/53°46′31″W | 4181 | M, G | ||
| Road 10 and Road 16 (ch5) | 34°16′24′S/53°47′51″W | AF245456 | 4209 | S, M | |
| Dept. Lavalleja (Uruguay) | |||||
| Road 8 close to Pirarajá stream | 33°42′31′S/54°42′47″W | S | |||
| Austrolebias reicherti | Dept. Treinta y Tres (Uruguay) | ||||
| Road 18 km 369.5 (ch42) | 32°46′51′S/53°38′40″W | AY724392, AY724401, AY724402, AY724403 | 4177 | S, M, G | |
| Road 18 close to Vergara town (ch43) | 32°55′21′S/53°54′49″W | AY724398, AY724396 | 3933 | S, M, G | |
| Road 91, 39 km North of Charqueada town (ch55) | 33°01′34′S/53°52′46″W | AY724397, AY724395, AY724393, AY724394 | 4176 | S, M | |
| Road 18 km 369.5 (ch56) | 32°46′51′S/53°38′40″W | 3934 | M, G | ||
| Dept. Cerro Largo (Uruguay) | |||||
| Road to Lago Merín town (ch58) | 32°42′04′S/53°18′32″W | 4182 | M | ||
| Road 26 5 km from Rio Branco city (ch59) | 32°34′34′S/53°26′20″W | 4337 | M | ||
| Austrolebias nachtigalli | Rio Grande do Sul, Brazil | ||||
| Road BR 116 km 15 | AY724407 | S |
- S, sequence analyses; M, morphological analyses; G, gamete ultraestructural analyses.


