Abstracts
UPDATE ON COAGULATION MIXING STUDIES
Dot Adcock
Laboratory Corporation of America
An unexpected PT and/or APTT prolongation is often evaluated using an invitro “mixing” test with normal plasma. Failure to correct (“non-correction”) prolongation upon mixing is attributed to an inhibitor, whereas “correction” points to factor deficiency(ies). There is, however, lack of standardization around what defines “correction” versus “non-correction” of a mixing test. For this reason, an international, multi-site study evaluating mixing tests using multiple PT and APTT reagents for the purpose of defining an optimal method for determining “correction” or “non-correction” using well-characterized plasma samples was performed. Mixing study results were evaluated using 11 different calculation methods. Misprediction, representing the failure of a mixing study interpretation method to correctly identify a factor deficiency versus inhibitor was used to assess the results. Study results revealed that percent correction and the Rosner Index are more suitable than other calculation methods for interpreting APTT and PT mixing test results for nearly all reagents evaluated. In general, other calculation methods that performed well in the identification of factor deficiency tended to have high misprediction rates for inhibitors and vice versa. No single method of mixing test result calculation was consistently successful in accurately distinguishing factor deficiency(ies) from inhibitor. Between reagent and site variability was also identified.
ANALYSIS OF AN OCCURRENCE MANAGEMENT SYSTEM IN A PRIVATE TERTIARY HOSPITAL LABORATORY IN LAGOS NIGERIA–EFFORTS TOWARDS CONTINUAL LABORATORY IMPROVEMENT
Ademola S Adewoyin1,3, Abdul-Wahab O Ettu2,3, Vincent C Odogwu3
1College of Medicine University of Lagos Lagos, Nigeria, 2General Hospital Odan-Lagos, Nigeria, 3Evercare Hospital Lekki Lekki- Lagos, Nigeria
Introduction: Authors reckon that clinically significant errors occur in laboratory practice. If not mitigated, laboratory errors can lead to missed/delayed diagnosis, improper monitoring of patients and poor clinical outcomes. There is a continual need to report and manage all forms of error in order to reduce them to nil or negligible levels through effective root cause analysis, corrective/preventive actions and process improvement strategies. The objective of the study is to evaluate the occurrence management system in a private tertiary hospital in Lagos Nigeria. In particular, types of incidences, individuals affected, laboratory phases/elements affected, root causes and incidence closure were described. Methods: Index study was conducted at a 165-bed private tertiary care hospital in Lagos, Nigeria. The hospital laboratory units include phlebotomy rooms, blood donor clinic, haematology, clinical chemistry, microbiology, histopathology, PCR laboratory and blood bank. Electronic reports of laboratory incidents submitted over a period of 18 months between April 2021 and September 2022 were retrieved from the logs, collated and analyzed. Data collected included types of incidences, location of incidence, individual affected, incidence summary, laboratory phase/element involved, reporting personnel, root causes, incidence closure and reasons for non-closure, if any. Descriptive data are presented as frequencies and proportions. Results: Of the 81 reported occurrences, there are 72 (88.9%) actual errors (adverse events, no harm events, and sentinel events), others were near misses (12.3%). Ten (12.3%) occurred outside the laboratory. In terms of potentials for harm, patients (77.8%) and staff (8.6%) were largely affected. Most errors involved the extra-analytic phases (43.2% pre-analytic and 19.8% post-analytic). Others errors were 13.6% intra-analytic, 11.1% safety events and 6.2% related to external examination (test referrals). Eight different categories of laboratory staff were involved in reporting incidences, with most reports generated by medical laboratory scientists (40.7%), phlebotomist (34.6%) and pathologists (7.4%). Root cause analysis revealed employee performance issue (64.2%) and lack of effective communication (11.1%) as the most important. Reported incidences were fully closed out (90.1%) of the time with implementation of CAPA. Overall, 97.5% of the reported errors are considered preventable. Conclusion: Perhaps, there is no such thing as an error-proof clinical laboratory. All clinical laboratories should ensure functional occurrence management system to capture, report, correct and prevent laboratory errors. Effective error management processes coupled with continual training for all laboratory users, automation of processes and continual vigilance will prevent large number of laboratory errors and promote better outcomes for the laboratory.
FREQUENCY AND TREND OF CLOTTING FACTOR DEFICIENCY IN AN ACADEMIC MEDICAL CENTER
Saeed Ahmed
The Aga Khan University, Hospital Karachi, Pakistan
Introduction: Inheritedcoagulation bleeding disorders are characterized by the absence or reduced levels of clotting factors, and the manifestations vary according to the type and magnitude of the deficient factor. Clotting factor deficiencies may lead to serious hemorrhagic manifestations and even death, if not diagnosed timely and treated appropriately. Objective: To determine the frequency of different clotting factor deficiency in an academic medical center. Methods: This cross-sectional study was conducted at the section of Haematology & Transfusion Medicine, the Aga University hospital from June to September 2022. A total of 200 clotting factor assays were performed and included in the study. Blood samples were collected in sodium citrate tube and clotting factors were performed on automated coagulation analyzer through clotting method. A quality control check was performed before analysis of blood samples. Results: Out of 200 clotting factor assays performed, 98 were found to be normal and 102 were found to be clotting factor deficient. Seventy-one (69.6%) were male and thirty-one (30.4%) were female. The mean age was 28 years (5 days–74 years). Eighty-seven (85%) patients were younger than 18 years of age. In males, the most common clotting factor deficiency was factor VIII in 32 (45%), followed by deficiency of factor X in 12 (17%), factor VII and factor IX in 7 (10%) each, factor V in 5 (7%), factor I in 3 (4%), combined deficiency of factor V &VIII in 2 (3%) and factor XI, factor XII and factor XIII in 1 each (1%). Vitamin K dependent clotting factor deficiency was found in 1 (1%). In females, factor VIII deficiency secondary to von Willebrand disease was found in 9 (29%), followed by factor V and X deficiency in 6 (19%) each, factor VII in 4 (13%), factor XIII deficiency and combined deficiency of factor V & VIII in 2 (6%) each, factor I and factor XII deficiency in 1 (3%) each. Conclusion: Factor VIII deficiency was found to be the most common clotting factor deficiency in both males and females. In females factor VIII deficiency was secondary to von Willebrand disease.
Key words:Clotting factors, bleeding, vitamin K.
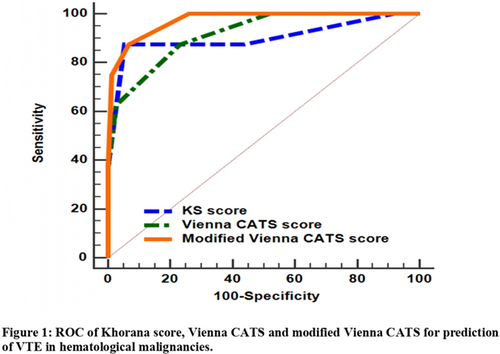
EVALUATION OF THREE RISK PREDICTION MODELS FOR VENOUS THROMBOEMBOLISM IN PATIENTS WITH HEMATOLOGICAL CANCERS
Hanaa Ali EL-Sayed 1, Maha Othman1,2,3, Hanan Azzam1, Hayam Rashad Ghoneim1, Mohamed Awad Ebrahim4, Mohammed Ahmed Mohammed Abdallah EL-Agdar1, Yousra Tera1,2, Doaa H Sakr 4, Tarek El-sayed Selim1
1Clinical Pathology Department, Faculty of Medicine, Mansoura University Mansoura, Egypt, 2Department of Biomedical and Molecular Sciences, School of Medicine, Queen's University Kingston, ON, Canada, 3School of Baccalaureate Nursing, St Lawrence College, Kingston, ON, Canada, 4Oncology Department, Faculty of Medicine, Mansoura University Mansoura, Egypt
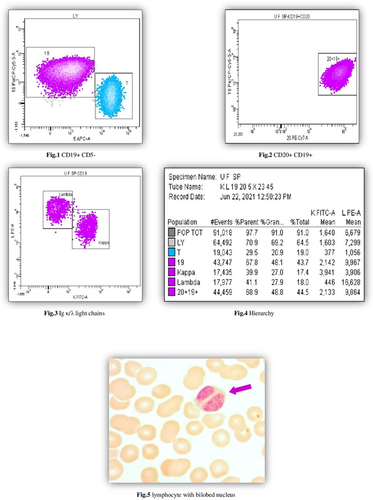
COMPARISON BETWEEN CONVENTIONAL CYTOMORPHOLOGY AND MULTICOLOR FLOW CYTOMETRY IN DETECTION OF LEUKEMIA IN CEREBROSPINAL FLUID
Mohammed Almohammadi1,2,3, Eman Khan1,2, Amal Ezzat Abd El-Lateef4
1King Abdullah International Medical Research Center Jeddah, Saudi Arabia, 2Department of Pathology and Laboratory Medicine, King Abdulaziz Medical City, Ministry of National Guard Health Affairs Jeddah, Saudi Arabia, 3King Saud Bin Abdulaziz University for Health Sciences Jeddah, Saudi Arabia, 4Department of Laboratory Medicine, Faculty of Applied Medical Sciences Jeddah, Saudi Arabia
EVALUATION OF A NOVEL LUPUS ANTICOAGULANT ASSAY DESIGNED TO REDUCE FALSE POSITIVE RESULTS DUE TO ANTICOAGULATION: A RETROSPECTIVE STUDY AT A SINGLE HEALTH SYSTEM
Jessica D Anderson, Tamara Sabih, Yuying Xing, Lili Zhao, Marc D Smith
Corewell Health William Beaumont University Hospital Royal Oak, MI, USA
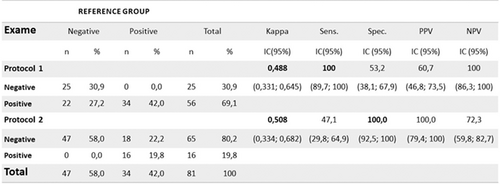
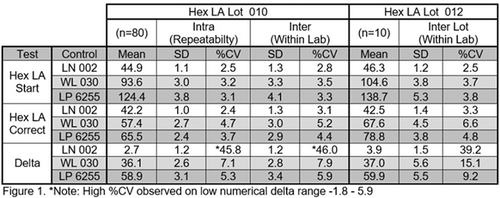
Introduction: Lupus anticoagulants (LA) are antibodies directed against phospholipids/phospholipid-protein complexes involved in coagulation and are associated with thrombotic events and recurrent fetal loss. There is no gold standard test for LA, therefore at least two LA-specific tests are recommended before excluding LA. Potential testing methods involve dilute Russell viper venom time (dRVVT) and hexagonal phase phospholipid assays (HPPA); however, many of these tests are susceptible to interference with anticoagulant therapy which can lead to false positive results. In this study, we compared the performance of our current HPPA, StaClot LA (SCLA), with a novel assay reported to have relatively minimal interference by anticoagulation therapy, CRYOcheck Hex LA (CCLA). Methods: We performed a retrospective study using 47 samples submitted for lupus anticoagulant testing in 3.2% sodium citrate vacutainer tubes. Samples were spun for 15 min at 3400 rpm to obtain platelet poor plasma. Samples positive by SCLA were selected for further testing and chart review for diagnosis of LA. These samples were frozen and retested by CCLA. We calculated the positive predictive value of both tests, assessed agreement between test methods using kappa statistics, and estimated the extent to which positive results were affected by anticoagulant therapy using Fisher's exact test. Statistical analysis was performed on R (version 4.2.1). Statistical significance was defined as p < 0.05. Results: Of the 47 samples, 34 were from women and 13 were from men, with an average age of 56 years. Using ISTH criteria, the presence or absence of LA was able to be determined in 42 out of the 47 samples. A 15 samples were positive for LA, and 27 samples were negative. Of the 15 positive samples, all were detected by both SCLA and CCLA. Of the 27 negative samples, all were positive by SCLA, and one was positive by CCLA. Thus, the positive predictive value for SCLA was 35.7% and 93.8% for CCLA. Since positive and negative results were obtained with CCLA, we were able to assess overall agreement between CCLA and true LA patients and CCLA and dRVVT, both of which were good (kappa = 0.78, p < 0.0001 for true LA; kappa = 0.73, p < 0.0001 for dRVVT). Additionally, 21 patients were taking anticoagulants at the time their sample was drawn. The rate of anticoagulation therapy was significantly higher in SCLA samples with false positive results (61.5% in false positive vs. 14.3% in true positive; p = 0.007). Conclusions: Diagnosis of LA can be challenging, particularly when the patient is being treated with anticoagulation. In our study, hexagonal phase phospholipid assays (SCLA and CCLA) showed high sensitivity (100%); however, SCLA showed a significant false positive rate, largely due to patients on anticoagulation therapy. CCLA on the other hand, shows promising resistance to anticoagulant therapy, and therefore, should be a strong consideration for labs offering LA testing in patient populations that are frequently anticoagulated.
ANALYSIS OF IMMATURE PLATELET FRACTION (IPF) AND THROMBOPOIETIN LEVELS DURING TREATMENT BASED ON CLINICAL SEVERITY OF SEPSIS
M Arif1, F Oei1, I J Patellongi2, R Halim3
1Department of Clinical Pathology, Faculty of Medicine Hasanuddin University Makassar, Indonesia, 2Department of Physiology, Faculty of Medicine Hasanuddin University Makassar, Indonesia, 3Department of Internal Medicine, Faculty of Medicine Hasanuddin University Makassar, Indonesia
Sepsis is a life-threatening organ dysfunction caused by a disorganized host response to infection. Sequential Organ Failure Assessment (SOFA) is simple system, which can be used to identify organ dysfunction due to sepsis. Sepsis cause consumptive thrombocytopenia thereby stimulates thrombopoietin, which is a regulator of megakaryopoiesis dan thrombopoiesis to produce platelets. Immature Platelet Fraction (IPF) is one of the parameters to help diagnose sepsis in estimate platelets production dan differentiate thrombocytopenia caused by bone marrow failure due to toxic agents or systemic infection. This study was a prospective cohort study with the purpose of determining the levels of IPF and TPO at day 1, 3 and 5 with clinical severity of sepsis based on SOFA score. IPF levels were measured by flowcytometry method (Sysmex, Kobe, Japan) and TPO levels by ELISA method (Ray BioTech, Australia). There were 11 samples in this study and data were analysed statistically by repeated ANOVA test and Pearson correlation. The results showed that there was a significant positive correlation between increased levels of IPF and SOFA score with decreased platelet count (day-3, r = 0.753, p = 0.008) and no correlation between TPO levels and SOFA score in sepsis patients (day-1 p = 0.474, hari-3 p = 0.128, hari-5 p = 0.657). It was concluded that the higher IPF levels, the more severe clinical degree of sepsis.
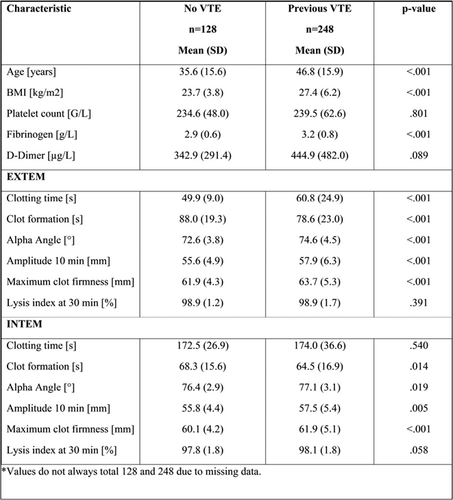
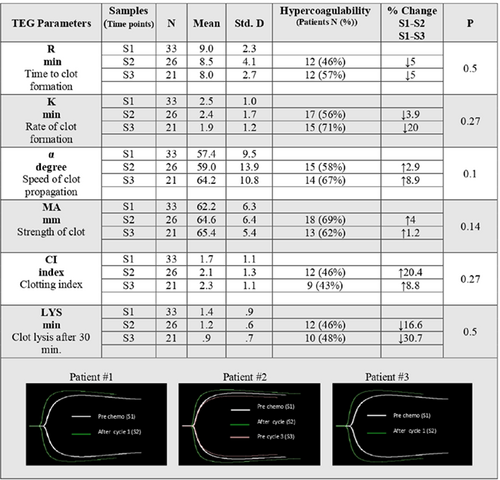
ASSESSMENT OF HYPERCOAGULABILITY USING THROMBOELASTOMETRY (ROTEM) IN PATIENTS REFERRED FOR THROMBOPHILIA SCREENING
Mazen Assar1,2, Henning Nilius3, Natalie Kearn1, Wilma M Hopman4, Michael Nagler3, Maha Othman1,2,5
1Department of Biomedical and Molecular Sciences, School of Medicine, Queen's University Kingston, ON, Canada, 2School of Baccalaureate Nursing, St Lawrence College Kingston, ON, Canada, 3Department of Clinical Chemistry, Inselspital, Bern University Hospital, and University of Bern, Bern, Switzerland, 4Kingston Health Science Cancer Research Institute, Queen's University Kingston, ON, Canada, 5Clinical Pathology Department, Faculty of Medicine, Mansoura University, Mansoura, Egypt
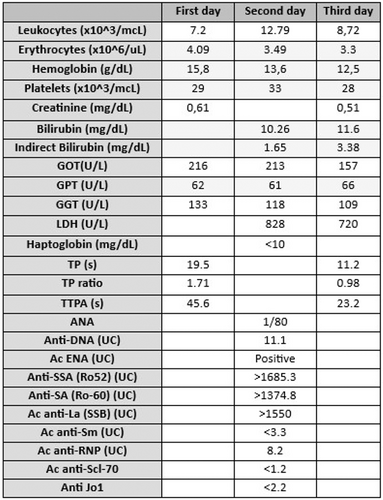
NEONATAL LUPUS: A CASE REPORT IN THE LABORATORY
Natali Augusto Octavio1, Bello Rego Marta3, Anna Marull Arnall1,2, Leire Saiz Sierra1, Francesc Xavier Queralt Moles1,2, Maite Serrando Querol1,2
1Laboratori Clinic Territorial ICS-IAS Girona, Spain, 2Group Neoma, Facultat de Medicina Girona, Spain, 3Hospital Meixoeiro, Vigo, Spain
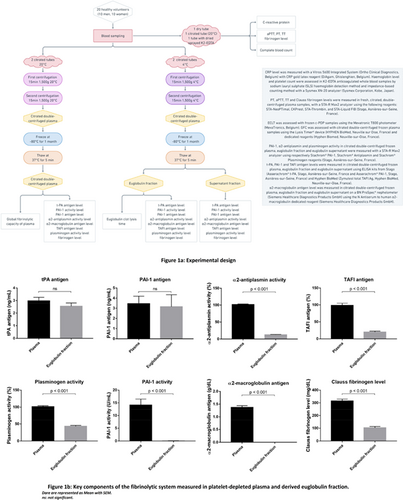
INDIVIDUAL DETERMINATION OF THE COMPONENTS OF THE FIBRINOLYTIC SYSTEM IN PLATELET-DEPLETED PLASMA AND DERIVED EUGLOBULIN FRACTION
Marion Bareille1, Thomas Lecompte2,3,4, François Mullier1,5
1Université catholique de Louvain, CHU UCL Namur, Haematology Laboratory Yvoir, Belgium, 2Université de Lorraine Nancy, France, 3Université de Namur, Department of Pharmacy, Namur Thrombosis and Hemostasis Center (NTHC), Namur Research Institute for Life Sciences (NARILIS) Namur, Belgium, 4Laboratoire mixte, CHU Dijon Bourgogne Dijon, France, 5Namur Thrombosis and Hemostasis Center (NTHC), Namur Research Institute for Life Sciences (NARILIS), Namur, Belgium
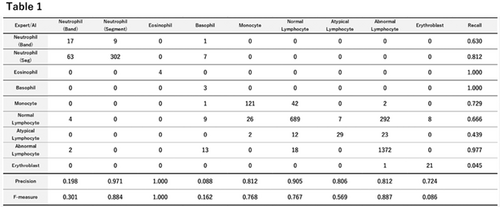
VISION TRANSFORMER FOR AUTOMATIC IMAGE RECOGNITION OF PERIPHERAL BLOOD CELLS
Kevin I Barrera2, Anna Merino1, Edwin S Alférez2, Ãngel Molina1, José Rodellar2
1CORE Laboratory. Biochemistry and Molecular Genetics Department, Biomedical Diagnostic Center Barcelona, Spain, 2Department of Mathematics. Technical University of Catalonia Barcelona, Spain
VALIDATION OF THE SYSMEX® XN-10 AUTOMATED HEMATOLOGY COUNTER FOR CELL COUNTING IN BONE MARROW SAMPLES
Rodrigo Bastos, Rosana Penteado, Andrea Villarinho, Cristina Ito, Camila Monteiro, Flavia Sousa, Liliana Suganuma, Afonso Cardoso, João Guerra
Albert Einstein Hospital São Paulo, Brazil
THE VALUE OF PERFORMING NEXT GENERATION SEQUENCING IN HEMATOLOGIC TUMORS
Mira Basuino, Richard D Hammer
University of Missouri, Department of Pathology and Anatomical Sciences Columbia, MO, USA
IS MASS CYTOMETRY READY FOR CLINICAL APPLICATIONS IN HEMATOLOGY
Gregory Behbehani
Ohio State
Mass cytometry enables quantification of up to 50 parameters per single cell through the use of time-of-flight mass spectrometry and heavy-metal tagged antibodies. This high number of parameters facilitates analysis of highly complex cell populations and allows for easy characterization of intracellular functional markers. There are, however, several unique challenges specific to mass cytometry that would require careful attention in any clinical assay. Fortunately, recent advances in mass cytometry methods have greatly improved the ease of generating highly accurate and reproducible data. Mass cytometry could be extremely useful for the diagnosis of malignant hematologic disorders, monitoring of minimal residual disease, and selection of treatment modalities. The capability of mass cytometry to easily measure cell cycle state and intracellular signaling would also make it ideal for performing functional immune monitoring, particularly for the assessment of organ or stem cell transplant and for the monitoring cellular or immunotherapy response. As with any high-parameter single-cell method, new data analysis approaches are required to take full advantage of richness of the data generated by mass cytometry assays. While challenges remain, mass cytometry could be an excellent tool for the functional assessment of clinical samples in high-consequence clinical decision-making assays.
A COMPARISON OF ATELLICA HEMA 580 AND BECKMAN COULTER DXH 800 HEMATOLOGY ANALYZERS
Marta Bello-Rego 1, Jose M Lite-Ãlvarez 1, Paloma Vicario Sanchez2, Graham J Gibbs3, Frederick J Stelling4
1Hospital of Meixoeiro Vigo, Spain, 2Siemens Healthcare S.L.U. Madrid, Spain, 3Siemens Healthcare Laboratory Diagnostics Surrey, United Kingdom, 4Siemens Healthcare Diagnostics Inc. Tarrytown, NY, USA
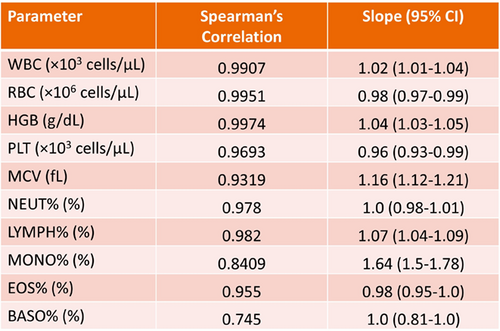
Introduction: The Atellica® HEMA 570 and Atellica HEMA 580 Analyzers (Siemens Healthcare Diagnostics Inc.) are newly launched quantitative, multiparameter, automated hematology analyzers for in-vitro diagnostic use in clinical laboratories. The classification and enumeration of blood cells is produced by impedance, double-hydrodynamic focusing, and flow cytometry-based white light absorbance and fluorescence detection technologies. The purpose of this study was to evaluate key hematology parameter recoveries between the Atellica HEMA 580 and Beckman Coulter DxH 800 automated hematology analyzers. Methods: Peripheral blood in K2 EDTA from 175 samples with normal and various pathological results was analyzed on the Atellica HEMA 580 and Beckman Coulter DxH 800 systems within 4 hours of collection. The correlation of 14 complete blood count (CBC) and white blood cell differential (DIFF) parameters was evaluated by nonparametric (Passing-Bablok) regression. Results: Correlation coefficients ≥0.90 were obtained for white blood cells (WBC), red blood cells (RBC), hemoglobin (HGB), hematocrit (HCT), mean cell volume (MCV), mean cell hemoglobin (MCH), platelets (PLT), neutrophils (NEUT), lymphocytes (LYMPH), monocytes (MONO), and eosinophils (EOS). A correlation coefficient ≥0.80 was obtained for mean corpuscular hemoglobin concentration (MCHC) and ≥0.70 for red cell distribution width (RDW) and basophils (BASO). The slope for most of these parameters was very close to 1.0, indicating no statistical difference from concordance or identity. Conclusions: This preliminary study indicates close correlations of CBC and white blood cell differential parameters between the Atellica HEMA 580 and Beckman Coulter DxH 800 hematology analyzers. Atellica and all associated marks are trademarks of Siemens Healthcare Diagnostics Inc., or its affiliates. All other trademarks and brands are the property of their respective owners.
A 10 COLOR TUBE DETECT T CELL CLONALITY BY FLOW CYTOMETRY
Laiz Bento, Flavia Sousa, Elizabeth Souto, Andressa Vaz, Bruna Nogueira, Daniela Schimidell, Marilia Passaro, Andrea Villarinho, Priscila Miyamoto, Nydia Bacal
Hospital Israelita Albert Einstein São Paulo, Brazil
Introduction::Flow Cytometry (FC) is important for diagnosis and monitoring of chronic T- cell neoplasms (T-CLN). T cell neoplasms is challenging due to features with reactive T-cells and limitations of T-cell clonality tests. We validate, by FC, a 10 colors tube that includes TRBC-1 and compare with IOTest Beta Mark TCR Vβ Repertoire Kit (Kit). Methods: Fresh six peripheral blood and two bone marrow were received in EDTA with diagnostic hypothesis of T-CLN. These samples were stained with a 10 colors tube: Gamma/DeltaFITC/TRBC1(JOVI-1)PE/CD8ECD/CD3PC5.5/CD56PC7/CD2APC/CD7A700/ CD4A750/CD5PB/CD45KO. All samples were also stained with IOTest Beta Mark TCR Vβ Repertoire Kitwith CD3PC5.5/CD8ECD/CD4A750. Samples were acquired in Navios Flow Cytometer and analysed in Kaluza software (Beckman Coulter). Results: It was possible to detect clonality of T lymphocytes in seven samples and in four samples TRBC-1 was positive and in three samples TRBC-1 was negative. The Kit showed four samples with a single TCR-Vβ family and three samples with no expression of any TCR-Vβ family, suggesting clonality. In one sample T lymphocytes were considered polyclonal in both panels. In addition, two cases were positive for detection of clonal T cell receptor beta chain gene rearrangement by PCR. In the other cases, it was not possible to carry out the molecular study. Of the cases that presented clonality, three were T Cell Large Granular Lymphocyte Leukemia, two Sezary Syndrome, 1 Peripheral T Lymphoma NOS and 1 T Prolymphocytic Leukemia. Discussion: Detection of T clonality is not limited to molecular techniques and research laboratories that demand longer release times. The use of Kit presents good results and allows the classification of the TCRVβ family. However, it has a high cost, machine-specific adjustments, and analysis expertise. The JOVI-1 clone of the TRBC-1 antibody showed high specificity for the CRβ-chain constant region 1 (TRBC1) domain, providing a simplified immunophenotypic assessment of T cell clonality. Our 10-color tube enabled the detection of lymphocyte clonality T through the analysis of TRBC-1, by FC, proved to be a fast technique, easy to perform and with a short release period. Conclusion: The T clonality tube using the TRBC1 antigen constitutes a simple, inexpensive, and robust way to detect clonality of T lymphocytes by flow cytometry.
o
PLATELET COUNTS ON CELLAVISION DM1200 IN THROMBOCYTOPENIA CASES WITH PLATELET INTERFERENCE FLAG
Gautam Gopal Bhagwat1, Pankti M Patel2
1Ruxmaniben Deepchand Gardi Medical College Ujjain, India, 2Suraksha Diagnostic Center Kolkata, India
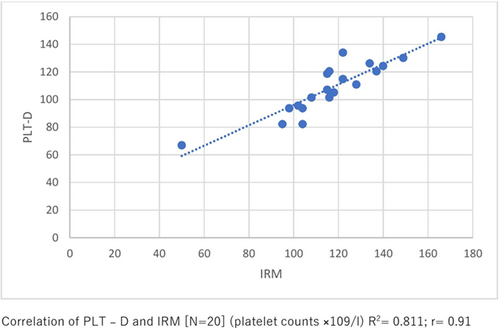
Introduction: Platelet counts generated by impedance methods (PLT-I) in cases of thrombocytopenia with interference flags can be unreliable. Alternative manual methods are used in such cases which has an inter–personal bias and requires expertise. Digital imaging of stained peripheral smears and then estimating counts on its basis minimizes these pitfalls of manual counting. We share our experience of evaluating utility of platelet count estimates in CellaVision DM1200 in cases of thrombocytopenia with platelet interference flag. Methods: Platelet count was done in nine fields (on CellaVision DM1200) with agreement of two observers on a digitized well stained smear of thirty peripheral blood samples having platelet count between 150 and 400(×109/L). Conversion factor was calculated for each sample by dividing the count from the cell counter by the average PLTs/HPF value from CellaVison DM–1200. Derived conversion factor was 15.3. Further, consecutive 150 samples with platelet counts <120 × 109/L were selected and were analysed in parallel using digitized smear technique (PLT-D) along with optical technique (PLT-O) in Horiba Yumizen H2500. Of these, 20 samples were also analysed using the international reference method (IRM). Statistical analysis using Pearson's correlation, student t-test, Bland-Altmann plot analysis and multivariate regression analysis was performed. Results: In the 150 cases evaluated, the mean platelet count (MPC) with PLT-I was 74.6 × 10⁹/L which was significantly lower than the MPC with PLT–D (114.2 × 10⁹/L). These counts correlated nicely with the MPC on PLT–O (108.9 × 10⁹/L). Pearson's correlation between PLT-O and PLT-D showed a good correlation (r = 0.809) and a significant correlation with IRM (r > 0.9). In Bland-Altmann analysis, PLT-D had lesser bias (8.225) and narrower limit of agreement (LOA) at 95% (−12.403 and 28.853) in comparison to PLT-I (Bias = 4.37; LOA = 2.902 to 84.498). According to CLIA proficiency testing criteria for acceptable analytical performance (±25% of target value), the platelet counts with PLT–D were compared with IRM and all the values were within 25%. The mean %difference between PLT-D versus IRM was 5.72%. Conclusion: Platelet count estimates using Digital platform (CellaVision DM1200) is rapid, simple, has better accuracy and minimizes inter-personal variation for reporting counts in cases of thrombocytopenia with platelet interference flags. This method is recommended as an alternative technique of manual platelet count on microscope.
COMPARISON OF HEMATOLOGICAL PARAMETERS BETWEEN SURVIVORS AND NON-SURVIVORS COVID-19 PATIENTS IN JEDDAH, SAUDI ARABIA
Naif K Binsaleh1, Reem Eltayeb1, Subuhi Sherwani2, Ali A Almishaal3, Emad A Hindi4, Husam Qanash1,5, Abdulrahman Bazaid1, Abdulmajeed Owayed Alharbi6, Mohammed B Bazaid7, Shayaa Alsaadi Altamimi8
1Department of Medical Laboratory Science, College of Applied Medical Sciences Hail, Saudi Arabia, 2Department of Biology, College of Sciences, University of Hail Hail, Saudi Arabia, 3Department of Speech-Language Pathology and Audiology, College of Applied Medical Sciences, University of Hail Hail, Saudi Arabia, 4Department of Anatomy, Faculty of Medicine, King Abdulaziz University Jeddah, Saudi Arabia, 5Molecular Diagnostics and Personalized Therapeutics, University of Hail Hail, Saudi Arabia, 6Laboratory Department, King Fahad General Hospital, Jeddah Jeddah, Saudi Arabia, 7Pediatric Department, East Jeddah Hospital Jeddah, Saudi Arabia, 8Quality Department, King Khalid Hospital, Hail Hail, Saudi Arabia
YOUNG INVESTIGATOR: A RETROSPECTIVE ASSESSMENT OF A LABORATORY STRATEGY TO IDENTIFY COAGULOPATHIES DUE TO VITAMIN K DEFICIENCY BY COMPARING FACTOR II LEVELS MEASURED BY PROTHROMBIN TIME VERSUS ECHIS VENOM REAGENTS
Alex Bourguignon1, James Douketis2, Catherine PM Hayward1
1Department of Pathology and Molecular Medicine, McMaster University Hamilton, ON, Canada, 2Department of Medicine, St. Joseph's Healthcare Hamilton, ON, Canada
UTILITY OF AN IMMUNOHISTOCHEMICAL PANEL IN DIAGNOSING SMALL B-CELL LYMPHOPROLIFERATIVE DISORDERS IN BONE MARROW BIOPSIES
Kelly Bowers, Jessica Robertson-Patera, Ziad Peerwani, Megan O Nakashima
Cleveland Clinic Cleveland, OH, USA
AUGMENTED WHITE BLOOD CELL CAPTURE IMPROVES MORPHOLOGIC DETECTION OF BLASTS BY CELLAVISION
Tessa Boyer1,2, Kimberly Ingalls2, Richard Xiang1,2, Robert Liwski1,2, David Conrad1,2
1Department of Pathology, Nova Scotia Health Authority (Central Zone) Halifax, NS, Canada, 2Department of Pathology, Dalhousie University Halifax, NS, Canada
Introduction: Morphologic assessment is the gold standard for the detection and quantification of blasts in peripheral blood, bone marrow, and body fluids. CellaVision is an automated digital microscopy platform routinely used for peripheral blood and body fluid morphology assessments, typically based on a 100-cell differential. Retrospective audits in our institution have identified blasts in blood films by manual microscopy after no blasts were detected using CellaVision. In these cases, the blasts were typically found outside of the morphology zone where CellaVision assessments usually occur. We hypothesized that increasing the number of white cells assessed, and therefore the size of the assessment area of the slide, would improve blast detection by CellaVision. Methods: Peripheral blood samples from healthy volunteers were inoculated with buffy coats from three acute leukemia patients. Blood films were made from serial dilutions of these manufactured specimens, and CellaVision differentials were determined from 100-, 200-, 300-, 400-, and 500-white blood cell captures. In addition, blood films found to have no blasts by 100-cell differential from 12 patients with a recent history of circulating blasts were subjected to repeat CellaVision assessments augmented by increased white blood cell capture. Results: The detection limit of blasts in the manufactured specimens was 0.26% with a 100-cell capture; this improved to 0.033% blasts when 500 white cells were assessed. Moreover, with a 300-white cell capture, blasts were detected in 10 of the 12 patient slides. The percent blasts detected in these patient specimens ranged from 0.3% to 3.8%; no blasts were detected in the remaining two patient slides, even when 500 white cells were interrogated. Conclusions: The ability to detect peripheral blood blasts using CellaVision depends on the number of white cells captured, which dictates the assessment area of the slide. This finding may reflect an unequal distribution of blasts throughout the blood film, whereby blasts are excluded from the usual assessment area of the slide when they are too sparse. Hospital laboratory services using automated digital platforms, such as CellaVision, to assess peripheral blood morphology should therefore consider increasing the minimum white blood cell capture to expand the blood film assessment area of peripheral blood films when screening for blasts.
SPECTRAL FLOW CYTOMETRY
Jonathan Brestoff
Washington University
Spectral flow cytometry is a recently developed technology that allows for high-dimensional multiplexing of over 35 fluorophores in a single-tube assay. In this technology, fluorophores are excited by a series of lasers, and the emitted light is detected using several dozen sensors. Each fluorophore has a specific “light fingerprint” that can be unmixed, allowing simultaneous use of spectrally similar fluorophores, such as APC and AF647, that cannot be used at the same time with conventional flow cytometers. Functionally, this expands the menu of available fluorophores for panel design and makes it possible to use advanced machine learning analytic approaches to identify a wide variety of cell types and subsets. In this presentation, I will describe spectral flow cytometry technology, our experience using a 4-laser spectral flow cytometer with a 31-color panel in a research setting, and potential applications of this technology in the clinical flow cytometry laboratory.
CUSTOM AUTOMATIC SEGMENTATION OF NORMAL AND MALIGNANT LYMPHOID CELL IMAGES FOR MORPHOLOGIC FEATURE ANALYSIS
Miguel Angel Calafat1, Santiago Alférez2, Angel Molina3, Kevin Barrera2, Anna Merino3, José Rodellar1
1Universitat Oberta de Catalunya Barcelona, Spain, 2Department of Mathematics. Technical University of Catalonia Barcelona, Spain, 3CORE Laboratory, Biochemistry and Molecular Genetics Department, Biomedical Diagnostic Center, Hospital Clinic Barcelona, Spain
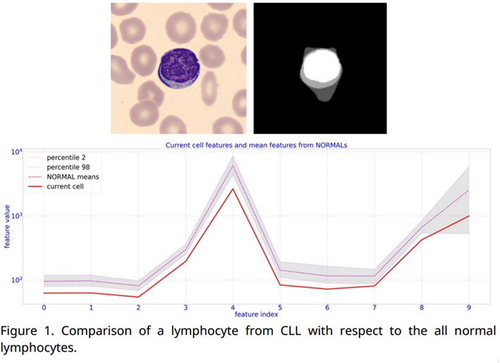
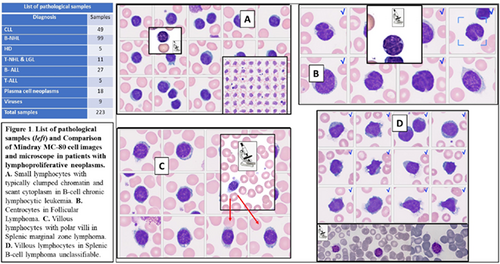
Introduction: In recent years, the rise of artificial intelligence and its entry into the world of medical imaging has led to great advances. However, a common criticism of deep neural networks is that their way of storing knowledge is not easily exportable to forms more friendly to human understanding. For this reason, this work addresses the challenge of transforming knowledge of a semantic segmentation neural network into a set of numerical features easily understandable by humans, applied to normal and malignant blood cells. Methods A segmentation pipeline is developed using a total of 6000 digital cell images from peripheral blood (PB), acquired by the CellaVision DM96 and stained with May Grünwald-Giemsa. These images correspond to lymphocytes of healthy patients (N), reactive lymphocytes (RL), and abnormal lymphocytes corresponding to patients with follicular lymphoma (FL), chronic lymphocytic leukemia (CLL) and splenic marginal zone lymphoma (SMZL). The pipeline contains a training step of a deep neural network specialized in semantic segmentation called U-Net++ that has successfully separated the nucleus, the cytoplasm and an external zone around the cell. This model was training using the above data set and their corresponding ground truth masks generated by an automatic procedure described in [1]. A large sample of numerical features have been extracted from the entire dataset. As an example, both shape features (area, elongation, eccentricity…) and first-order statistical features of the pixel values (mean, standard deviation, kurtosis, among others) have been extracted. An app has been developed that, in a friendly manner, compares the current cell feature values (from a user's image) with the values of the database. Results: The semantic segmentation model has obtained a Dice coefficient (common metric to compare surface prediction efficiency) around 96% in just five iterations. Besides, an easy-to-use graphical interface has been built, which makes it possible to compare the features of the cell types at first glance. Fig. 1 shows a comparison of features between the current cell an abnormal LLC lymphocyte and normal lymphocytes population. Conclusions This work has developed a tool that allows the extraction of numerous features from the images so that the pathologist themselves can find relationships and patterns with morphological parameters, and thus understand more clearly aspects of the information with which they work.
References
MALARIA LABORATORY REPORT: THE ITALIAN STATE OF ART
Anna Maria Cenci, Barbara Casolari, Valentino Miconi, Bruno Biasioli, Maria Golato, Marco Moretti, Sofia Chiatamone Ranieri, Fabrizio Papa
Italian Society of Pathology and Laboratory Medicine–Hematology Working Group (SIPMeL-GdSE) Castelfranco Veneto, Italy
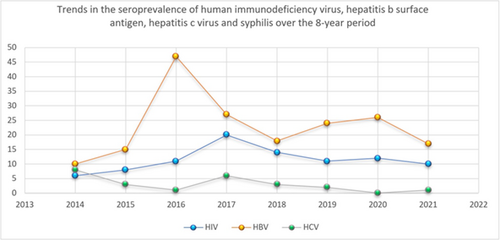
Background: The significant increase in Malaria disease (228 million cases according to 2018-WHO report), mostly due to globalization and migration from highly endemic countries (Africa, India), led to an increased incidence of these parasites observations, both in routine and emergency laboratory. Material and Methods: In October 2022 a survey on Malaria reporting was submitted to a selected and significant laboratories group by SIPMeL Hematology Group. 26 laboratories replied to the online survey, realized by SurveyMonkey® software, 20 days open, consisting of 38 single or multiple choice specific questions. The involved laboratories, distributed all over the country, were different for blood counts/year (range 1000 to 10 milions/year), automation and structure organization. Results: Main Survey items results are the following: parasites observed frequence: <1 case/month (87%); more cases found in 13%; diagnosis from a smear: 35% thin or thick smear; 31% both smears; 35% found in traditional blood smear; identification often suggested by instrumental data and flags, also generic ones; dedicated diagnostic guidelines (85%): 77% from the literature; 23% from local proposals; in 65% reporting rules shared among the team and 58% with the clinicians; in 21% specialist support need is required. outpatient specific requests: 69% for diagnostic suspicions; in 88% the case is handled as an energency; reporting traits: 54% morphology description, 31% semi-quantitative data; in 58% Parasites Count/GR ratio is provided; immunochromatographic rapid tests (88.5%): 50–100 parasites/μL blood sensitivity (72%;) falciparum specificity (47.6%); in 58.3 other plasmodia are distinguished (P. vivax: 15%; P. ovale: 12%; P. malariae: 12%); parasite DNA-PCR: 30.8% indoor performed; when not performed (69.2%) the reasons are cost (29.2%), low incidence (70.8%), specialized personnel need (20.8%); laboratory value definition in diagnosis: poor (12%); relevant (28%); essential (60%); Survey results agree with the laboratory test number, organization and equipment. Conclusions. Automation role is confirmed and considered as a fundamental contribution in screening and diagnostic investigation with abnormal data and flags for parasites presence/interference. Due to the magnitudo of the Malaria diffusion worldwide, the SIPMeL survey gives a good overview of the topic to dealt with, as a first step reaching widespread and common behaviors and as a base feature for improvement proposals and congruent intervention.
MARKERS OF COAGULOPATHYIN MULTIPLE MYELOMA
Katerina Chasakova1, LudÄ›k SlavÃk2, David Starostka1, Jana Úlehlová2, Tomáš PapajÃk2, Jiřà MinaÅ™Ãk2
1Department of Clinical Hematology, Hospital in HavÃÅ™ov HavÃÅ™ov, Czech Republic, 2Department of Hematooncology, University Hospital and Faculty of Medicine and Dentistry, Palacký University Olomouc Olomouc, Czech Republic
Introduction: Multiple myeloma (MM) is a plasma cell neoplasm characterized by clonal proliferation and accumulation of neoplastic cells and osteolytic skeletal involvement. Some of hemostasis disorders are attributed to M-Ig interactions with blood clotting factors (acquired von Willebrand's disease, acquired hemophilia A or deficits of other coagulation factors, circulating anticoagulant, hyperviscosity, amyloidosis and lupus anticoagulant) or with platelets (acquired thrombocytopathy), and also M-Ig-independent effects (thrombocytopenia, other thrombocytopathies, DIC, immobility and hypercalcaemia). The aim of our work is to detect abnormalities of coagulation in patients in with newly diagnosed MM suitable for intensit chemotherapy–depending on the aktivity of the disease, which predispose patients to thrombotic and bleeding complication, respectively, in MM. TGT is a global coagulation assai that measures the global capacity of blood plasma to form thrombin. Several clinical studies have shown that increased TG in platelet poor plasma (PPP) predicts an increased risk of (recurrent) VTE. Method We included 53 patients with newly diagnosed multiple myeloma in this study. Patients with MM were examined by coagulation tests for detecting both bleeding and thrombotic tendency with following coagulation tests: PT, APTT, TT, fibrinogen, antithrombin, D-dimers, levels of coagulation factors (II, V, VII, X, VIII, IX, XI and XII), vWF, lupus anticoagulant, protein C, protein S, resistance to activated protein C and trombin generation assai modified with activated protein C. We also monitored plasma cell counts and serum M-Ig levels in these patients. Results: All markers were evaluated (average value, standard deviation) to the dinase aktivity defined by the paraprotein level and a number of plasma cells (cytology analysis), respectively. A significant correlation was found between D-dimers and M-Ig quantity (p = 0.0031), D-dimers and plasma cells number (p = 0.0006), between vWF versus M-Ig quantity (p = 0.0053). No correlation was found between vWF and plasma cells number (p = 0.42), which is interesting. Correlations of vWF versus M-Ig quantity can predict bleeding conditions, however our ambition is to detect markers of thrombotic risk as well. For this purpose, we examined the modified TGT, which identified thrombotic pathology in eight cases (15%), while genetically determined thrombophilias were detected in only 3% of patients. Conclusion: In newly diagnosed patients with MM, were commend increased attention to the level of D-dimers and vWF, especially in patients with higher dinase aktivity according to M-Ig quantity in order to estimate possible bleeding or thrombotic complications and modified TGT for thrombotic complication, for which long term observation is needed.
NGS FOR PLATELET DISORDER DIAGNOSIS
Dong Chen
Mayo Clinic
Inherited platelet disorders (IPDs) are a heterogeneous group of disorders characterized by normal or reduced platelet counts, bleeding diatheses of varying severities and presence (syndromic) or absence (non-syndromic) of involvement of other organs. Unfortunately, due to the lack of highly specific platelet functional tests, the identification of the underlying cause of IPDs remains clinically challenging and is often based on a clinical presentation and variable results of hematology and platelet laboratory testing results. Therefore, genetic testing has a potentially important role in the investigation of patients with IPDs. With the advent of next-generation sequencing (NGS) technologies, the rapid analysis of genes that have been previously implicated in IPDs is now possible. The potential limitations of NGS arise with the interpretation of the genetic information to definitively identify function-disrupting disease-causing variants. Thus, the interpretations of gene variants remain challenging, which will most likely be improved by thorough phenotype and genotype correlation studies and collaboration of the IPD clinical and research communities.
EARLY DETECTION OF EBV-RELATED PTLD USING FLOW CYTOMETRY SORTING AND LYMPHOCYTIC SUBSETS IMMUNOPHENOTYPING
Man Chen, Hui Wang
Hebei Yanda Lu Daopei Hospital Langfang, China
GENOMIC ALTERATIONS IN CHRONIC MYELOID LEUKAEMIA PATIENTS WHO FAILED SECOND GENERATION TYROSINE KINASE INHIBITOR
Siew Lian Chong1, Asral Wirda Ahmad Asnawi1,2, Tien Gen Wong1, Veena Selvaratnam1, Pek Kuen Liew1, Sharifah Shahnaz Syed Abd Kadir1, Tee Chuan Ong1, Jerome Tan1, Subramanian Yegappan1, Sen Mui Tan1
1Hospital Ampang Ampang, Malaysia, 2Faculty of Medicine and Health Sciences, Universiti Sains Islam Malaysia Bandar Baru Nilai, Malaysia
The practise of prescribing Chronic Myeloid Leukaemia (CML) patients with indefinite tyrosine kinase inhibitors (TKIs) has gone uncontested, and the capacity of TKIs to eliminate the CML clone is also still unknown. Although the vast majority of CML patients do respond to TKIs, nonetheless, resistance may develop either de novo or during treatment. TKI resistance pathways are commonly classified as BCR-ABL1-dependent or BCR-ABL1-independent. The molecular evolution causal for this subset of individuals to lose molecular remission is still unknown. In this study, our goal was to explore the molecular mechanisms involved in resistance to TKI in patients who failed second-generation TKIs in order to identify potential genetic signatures and pathways that lead to TKI resistance. A preliminary of total 34 samples (two responder and 32 non-responder) were subjected to whole-transcriptomic analysis. mRNA gene expression, gene fusion and single nucleotide variation (SNV) were determined using Illumina DRAGEN Bio-IT Platform pipeline. Preliminary results for a total of 386 differentially regulated genes (DEGs) were identified, with 148 genes up-regulated and 238 genes down-regulated in the patients who failed second-generation TKIs (non-responder). The DEGs were enriched in histone acetylation/deacetlylation (HDACs/HATs), DNA methylation, and RNA polymerase regulation pathway. Further analyses demonstrated that CCCDC32-CBX3 fusion is significantly associated with non-responder. Techniques with enhanced sensitivity such as next-generation sequencing and the use of artificial intelligence techniques coupled with the development of mathematical modelling and computational prediction methods could reveal the underlying mechanism of drug resistance and facilitate the design of more effective treatment strategies for improving drug efficacy in CML patients. This preliminary analysis found that patients who failed second-generation TKIs express a potentially unique genetic signature. Analysis using larger sample size is necessary to validate these findings.
A STUDY OF END TYROSINE KINASE INHIBITOR IN CML (ENTIC) IN MALAYSIA
SiewLian Chong1, Asral Wirda Ahmad Asnawi1,2, Tien Gen Wong1, Veena Selvaratnam1, Pek Kuen Liew1, Sharifah Shahnaz Syed Abd Kadir1, Tee Chuan Ong1, Jerome Tan1, Ngee Siang Lau1, Sen Mui Tan1, Ai Sim Goh3, Soo Min Lim4, Ahlam Naila Kori5, See Guan Toh6, Si Yuan Ng7, Jenq Tzong Tan8
1Hospital Ampang Ampang, Malaysia, 2Faculty of Medicine and Health Sciences, Universiti Sains Islam Malaysia Bandar Baru Nilai, Malaysia, 3Hospital Pulau Pinang Penang, Malaysia, 4Hospital Sultanah Aminah Johor Bahru, Malaysia, 5Hospital Tengku Ampuan Afzan Kuantan, Malaysia, 6Hospital Tuanku Jaafar Seremban, Malaysia, 7Hospital Melaka Melaka, Malaysia, 8Hospital Taiping Perak, Malaysia
The practice of indefinite tyrosine kinase inhibitor (TKI) provision for Chronic Myeloid Leukaemia (CML) has remained unchallenged. Furthermore, the ability of TKIs to eradicate the CML clone is still largely unknown. A multicentred observational study involving major hospitals in Malaysia to observe the clinical practise to End TKI In CML (EnTIC) was performed. The goal of this study is to determine the molecular response to TKI cessation in CML patients by close monitoring of BCR-ABL1.Adult CML in chronic phase patients who received first line TKI (Imatinib, Nilotinib or Dasatinib) for at least four years and achieved sustained MR4 (IS: 0.01%) for at least 2 years were recruited. A total 88 patients with equal gender distribution (44 male and 44 female) with a median age of 41 years old (range, 31.5–53.5 years old) were included in the study. These patients were observed with a median follow up of 14 months (range, 1–18 months). First-line TKIs were administered to all patients throughout the course of treatment, with median of 9 years (range: 7–13 years) and a median of 4 years for sustained deep molecular response (DMR) (range 3–6 years). After stopping TKI, 57 patients (or 64.8%) remain in treatment-free remission (TFR). Thirty-one patients failed TFR, with a median time of 2 months (range 1–5 months). Patients who remained in TFR at 166 days (5.5 months) and beyond were likely to achieve long term TFR in the following months. We observed the likelihood of loss of MMR during TFR trial is most often within the first 6 months of stopping TKI. However, a longer duration of follow-up and analyses of TFR data in EnTIC and other TFR studies will be needed to further evaluate the patients, and clinically significant characteristics before stopping treatment.
HOT TOPICS IN NEONATAL HEMATOLOGY
Robert Christensen
University of Utah and Intermountain Healthcare
It is important for clinicians who render neonatal care to precisely and reproducibly diagnose anemia. Confusion about the definition of neonatal anemia can arise because the diagnostic criteria are highly dependent on gestational and postnatal age. As an example, for a newborn infant delivered at 24 weeks gestation, a blood hemoglobin concentration defining anemia is much lower than a hemoglobin defining anemia at birth for a term neonate. Moreover, a hemoglobin concentration defining anemia at birth is higher than one defining anemia in that same infant 60 days after birth.
Diagnosing anemia can become evidence-based by using reference intervals derived from very large neonatal databases, comparing a patient's hemoglobin value with the appropriate gestational and postnatal age norms. To do this, we advocate defining anemia as a hemoglobin level that plots below the fifth percentile lower reference interval, defining moderately severe anemia as a hemoglobin value between the first and fifth percentile, and defining severe anemia as a hemoglobin plotting below the first percentile.
The information provided in this review can easily be adopted by clinical laboratories and by individual neonatal care units, thereby fostering application of these definitions for all infants who have a hemoglobin level drawn. Additional normative values included in this review that describe various other erythrocyte metrics can likewise be easily adopted. Doing this will enable a rigorous evidence-based diagnosis of neonatal anemia, and will also facilitate identifying the cause of the anemia, thus pointing the way to proper additional diagnostic testing and treatment.
CHASING GHOSTS: AUTOMATING THE KLEIHAUER-BETKE TEST USING ARTIFICIAL INTELLIGENCE
Marlene Correia
Royal Devon University Healthcare NHS Foundation Trust, Exeter, UK
EVALUATION OF A PROTOTYPE SOFTWARE FOR AUTOMATED FETOMATERNAL HEMORRHAGE ESTIMATION
Marlene Correia1, Jennifer Davies1, Cajsa Olofsson2, Mats Erikson2, Hans-Inge Bengtsson2, Veronika Jenei2
1Royal Devon University Healthcare NHS Foundation Trust Exeter, United Kingdom, 2Global Marketing, CellaVision Lund, Sweden
Introduction – The Kleihauer–Betke (KB) method is commonly employed in transfusion laboratories for the estimation of fetomaternal hemorrhage (FMH) during pregnancy/post-delivery. It is a labor-intensive manual technique subject to high interobserver variability. While flow cytometry is considered the gold standard, it is often only available in specialist laboratories and often used only for confirmation of KB estimations. No automated device is currently available to analyze KB smears. The aim of this study was to develop a software for automated analysis of KB smears and evaluate its performance. Methods – A prototype software was developed on the CellaVision® DC-1 digital morphology analyzer. It analyzes tens of thousands of red blood cells (RBCs) and estimates FMH using artificial intelligence on smears prepared by the KB method. The software was developed and evaluated on smears using spiked blood samples with known concentrations of fetal RBCs. The precision was tested by comparing FMH estimates from the software before and after user review to flow cytometry on samples with 0.2, 0.5 and 1.6% of fetal RBCs. The effect of the analyzed number of RBCs on precision was tested using 10 slides from each concentrations analyzing 10 000, 25 000, 75 000 and 100 000 RBCs. A comparison study was performed on 30 samples, containing 0%–6% of fetal RBCs, and FMH estimates from the prototype software before and after user review were compared to that of flow cytometry. Results – The automated method using the prototype software is associated with acceptable within-run precision. The within-run precision of the method is augmented by increasing the analyzed number of RBCs, reaching an optimum at 50 000 cells. The automated FMH estimation using the prototype software produced a mean bias of 4.38 when comparing results before user review to flow cytometry. User review of the results on the prototype software significantly reduced the mean bias to 0.88 from 4.38. Conclusions – Our results show good correlation between the prototype software and flow cytometry, demonstrating the feasibility of using artificial intelligence for the estimation of FMH. Such an application could represent a viable and promising alternative to replace manual microscopy in clinical laboratories.
CAN FLOW CYTOMETRY WORK ALONE?
Paola D'Altoè, Gerardo Del Giudice
Laboratorio Analisi–S. Martino Hospital Belluno, Italy
GREEN CRYSTALS OF DEATH: NOT ALWAYS A LETHAL PHENOMENON
Paola D'Altoè, Gerardo Del Giudice
Laboratorio Analisi–S. Martino Hospital Belluno, Italy
NOVEL CBC PARAMETERS
Giuseppe d'Onofrio
Catholic University of Sacred Hearth, Rome, Italy
The date of birth of modern hematology laboratories can be traced back to 1953, when Wallace H. Coulter patented the first system capable of counting red and white blood cells automatically, also calculating Wintrobe's three erythrocyte indices. The Coulter principle (or effect) was based on the poor ability of blood cells immersed in a flow of saline solution to conduct an electric current through an orifice (impedance), thus blocking its passage for a time-dependent on their volume. In the 1960s and 1970s, instruments based on optical detection principles were introduced, such as all light scattering and absorbance, which also perfected platelet counting. Even more recently, dyes, often fluorescent, capable of distinguishing and counting reticulocytes, were used. The automatic differential count of leukocytes obtained thanks to heterogeneous methods such as automated cytochemistry, measurement of scattering at different angles, and fluorescence now has excellent reproducibility and accuracy for the five classes of normal circulating leukocytes, sensitivity and specificity appropriate for the screening of pathological samples to be reviewed under a microscope and, in the latest generation equipment, also the ability to count, with variable accuracy, some populations of pathological cells, such as immature granulocytes (promyelocytes, myelocytes, metamyelocytes), blast cells and erythroblasts circulating, thanks to the specific conformation of the nuclei and cytoplasm of these elements. New erythrocyte indices have been developed for the differential diagnosis of anemias, such as the percentage of hypochromic, hyperchromic, microcytic and macrocytic red blood cells, the mean hemoglobin content of red blood cells (CHCM) and reticulocytes (CHr, Ret-HB and similar). Different subpopulations of cells with different nucleic acid content (immature fraction of reticulocytes or IRF, cross-linked platelets) are usually inversely proportional to the life span and rate of production of those cells. Each instrument now provides numerous additional parameters that numerically translate the position of cells on the cytogram space and measure their size, granularity, and other physical or chemical properties. Numerous researchers are working on trying to apply such population data to particular cell types or hematological diseases. An interesting result was obtained using the constant neutrophil/lymphocyte ratio in patients with COVID-19, as this ratio clearly highlights the more severe cases, simultaneously characterized by lymphopenia and neutrophilia. Hematology analyzers can currently be used to count cells in nonblood body fluids and even, with some limitations, in bone marrow fluid. We are also recently seeing a revival of methods based on digital morphological analysis of peripheral blood cells and automated microscopy. The artificial intelligence programs used for this purpose are still relatively rigid and, in any case, linked to human intervention. Telemicroscopy, morphological education and the second level of routine microscopy greatly benefit from this morphology recovery with digital techniques.
Reference. Automated hematology analyzers: State of the art. Brugnara C and Kratz A, Eds, Clin Lab Med 2015;35(1):1-224.
CLINICAL PERFORMANCE EVALUATION OF THE SAA MODULE OF MINDRAY BC-7500CS AUTOMATED HEMATOLOGY ANALYZER
Jincheng Dai, Xiaoyu Zhang, Jing Zhou, Wei Pan, Fei Yu
Department of Clinical Laboratory, Children’s Hospital of Nanjing Medical University, Nanjing, China
Background: Serum amyloid A (SAA) is a class of lipid-binding protein in plasma with great value in indicating possible infectious diseases, cardiovascular diseases, and prognosis of tumor patients. The hook effect impairs laboratory detection of high values of SAA. Mindray has launched the new BC-7500CS automated hematology analyzer with an integrated SAA autodilution (SAA-D) function to reduce the hook effect. This study aimed to verify the performance of the SAA module, especially in the high SAA samples. Methods: Blood samples were randomly collected from outpatients and inpatients of the Children's Hospital of Nanjing Medical University (CH) and analyzed with the SAA module with the BC-7500CS automated hematology analyzer. Two hundred twelve blood samples with SAA concentrations higher than 100 mg/L were collected to verify the SAA-D function by comparing with the manual dilutions. The reportable range of the instrument was investigated by measuring the samples with different concentrations of SAA (up to 2000 mg/L). Interference studies were conducted with blood samples with added bilirubin (BIL), triglyceride (TG), vitamin C (VitC), rheumatoid factor (RF), human anti-mouse Antibody (HAMA), hemoglobin (HGB). The basic performance (e.g., background, repeatability, etc.) of the SAA mode was also validated. Results: The basic performance of the SAA modules of Mindray BC-7500 CS all met the manufacturer's claims. The maximum measurable SAA was 1932.38 mg/L, and the SAA module showed high anti-interference ability when BIL <100 mg/dL, TG <1408 mg/dL, VitC <150 mg/dL, RF <65 IU/mL, HAMA <1000 IU/mL, and HGB <203.1 g/L. In addition, the SAA-D showed a good correlation with the manual dilution for samples with high SAA concentrations (Y = −26.03 + 1.041X, n = 212, r = 0.993). Conclusions: The Mindray BC-7500CS showed good performance in measuring SAA concentrations, and the SAA-D function could accurately measure high SAA concentrations, enabling reliable SAA detection in the laboratory and clinical practice.
JAK/STAT SIGNALING AS A MEDIATOR OF RESPONSE TO COMBINATION OF FLT3 AND MEK INHIBITORS IN ACUTE MYELOID LEUKEMIA
Alisa Damnernsawad1, Pat Lerdwattanasombat2, Panssachon Kraikhun1, Phanuphat Phanochit1, Todsapol Techo3, Daniel Bottomly4, Tamilla Nechiporuk5, Shannon McWeeney4, Jeffrey Tyner5
1Department of Biology, Faculty of Science, Mahidol University Bangkok Thailand, 2Biomedical Science Program, Faculty of Science, Mahidol University Bangkok Thailand, 3Department of Biology, Faculty of Science, Khon Kaen University Khon Kaen Thailand, 4Division of Bioinformatics and Computational Biology, Knight Cancer Institute, Oregon Health and Science University Portland, OR, USA, 5Department of Cell, Developmental and Cancer Biology, Knight Cancer Institute, Oregon Health and Science University, Department of Cell, Developmental and Cancer Biology, Knight Cancer Institute, Oregon Health and Science University Portland, OR, USA
Introduction Acute myeloid leukemia (AML) is a fast-progressing hematopoietic malignancy and the most common leukemia in adults. Hyperactivating mutations of fms-like tyrosine kinase 3 (FLT3) are the most common genetic alterations found in AML and are related with poor prognosis. Development of FLT3 inhibitors (FLT3i) have improved treatment outcomes in AML patients. Unfortunately, the benefit is short-term due to acquired resistance. This urges the need to find novel treatment approaches. Recently, there have been several studies demonstrating that combining FLT3i with other small molecule inhibitors including MEK inhibitor (MEKi), enhanced anti-leukemic activity in AML cells. Nevertheless, whether different AML subgroups with distinct genetic backgrounds will response to this combination drugs and whether resistance can develop are not known. Methods To identify genes involved in response to combination of FLT3i and MEKi, genome-wide CRISPR knock out (KO) screen was performed on FLT3 mutation harboring MOLM13 AML cell line. Results CRISPR screen identified PTPN1, a negative regulator of JAK/STAT signaling pathway, as one of top hits that loss of function promoted AML cell survival in the present of the combination drugs. This suggested hyper-activation of JAK/STAT signaling as a potential indicator predicting resistance toward this combination strategy. PTPN1 KO cells were generated using single gRNAs to examine role of PTPN1 in response to FLT3i and MEKi. Drug sensitivity assay demonstrated that PTPN1 KO AML cells were resistant toward FLT3i, gilteritinib, and MEKi, trametinib. Although, ex vivo functional analysis of 163 AML patient samples did not showed correlation between RNA expression of PTPN1 and response to this combination drugs, higher expression of JAK2 but not JAK1 and JAK3 was correlated with resistance toward combination of FLT3i and MEKi. Conclusions Taken together, our results proposed that JAK/STAT signaling can act as a mediator of resistance toward combination of FLT3i and MEKi and that AML patients with hyper-activation of JAK/STAT signaling will not be benefit from this combination strategy.
ABERRANT T CELL ANTIGEN EXPRESSION IN A CASE OF MULTIPLE MYELOMA
Hansini Dassanayake, Sunethra Athauda
National Hospital Kandy Sri Lanka Kandy, Sri Lanka
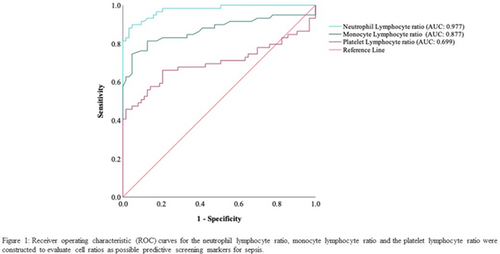
INVESTIGATING HAEMATOLOGY CELL RATIOS AS AN EARLY SCREENING TOOL FOR SEPSIS IN PATIENTS DIAGNOSED AT A SOUTH AFRICAN HOSPITAL
Glenda Mary Davison1,2, Jason van Rensburg1, Saarah Davids1, Carine Smuts1
1SAMRC/CPUT Cardiometabolic Health research unit, Cape Peninsula University of Technology Cape Town, South Africa, 2Division of Haematology, University of Cape Town, Cape Town, South Africa
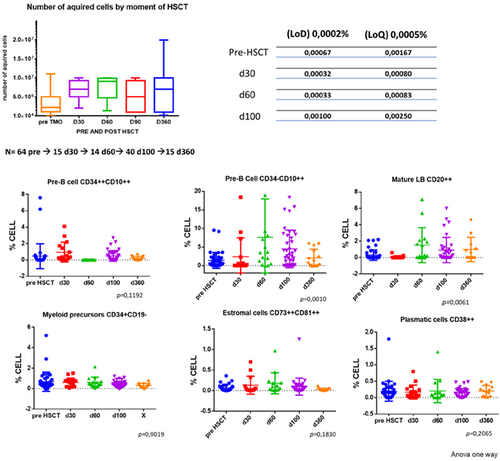
ANALYSIS OF B-CELL RECOVERY KINETIC AND BONE MARROW MICROENVIRONMENT USING A FLOW CYTOMETRY SINGLE TUBE TO DETECT MINIMAL RESIDUAL DISEASE (MRD) IN ACUTE LEUKEMIA: COMPARISON OF REGENERATING BONE MARROW BEFORE AND AFTER HEMATOPOIETIC STEM CELL TRANSPLANTATION
Ana Paula de Azambuja, Miriam P Beltrame, Carmem Bonfim, Yara C Schluga, Mariester Malvezzi, Ricardo Pasquini
Hospital de ClÃnicas da Universidade Federal do Paraná Curitiba, Brazil
CONVENTIONAL MORPHOLOGY STILL MATTERS: THE TALES TOLD BY VACUOLES FROM CU DEFICIENCY TO VEXAS (CASE STUDIES)
George Deeb
Emory University, USA
Conventional cytomorphologic assessment is still essential among growing numbers of technologically more sophisticated tools available to the practitioners of the discipline of hematopathology. It is recommended for visual numeration of blasts, when required, and widely accepted as a cost-effective approach to triage additional ancillary testing. Of interest, certain cytomorphologic features have been found to be associated with varied hematologic diseases and therefore alert to investigate such during the diagnostic work up of blood and bone marrow samples. Of these, the presence of vacuoles in certain hematopoietic cell types have been described in copper deficiency and the newly reported autoinflammatory disease with acquired somatic genetic mutation VEXAS (vacuoles, E1 enzyme, X-linked, autoinflammatory, somatic) syndrome, among others. The diagnostic implication, disease association, and differential diagnosis of the presence of vacuoles in certain hematologic diseases are being discussed and highlighted by illustrative clinical case studies.
DIAGNOSIS OF ACQUIRED THROMBOTIC THROMBOCYTOPENIC PURPURA
Katrien Devreese
Ghent University Hospital
Diagnosis of Acquired Thrombotic Thrombocytopenic Purpura
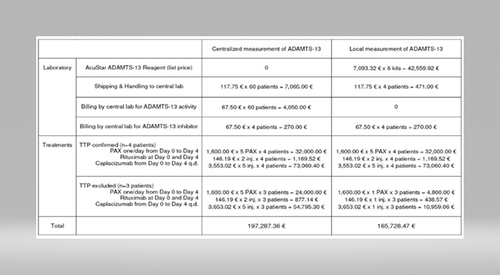
Thrombotic Thrombocytopenic Purpura (TTP) is a rare and life-threatening thrombotic microangiopathy characterized by microangiopathic hemolytic anemia, severe thrombocytopenia, and organ ischemia linked to disseminated microthrombi. TTP is specifically related to a severe deficiency in ADAMTS13, the von Willebrand factor-cleaving protease. ADAMTS13 deficiency is most frequently acquired via ADAMTS13 autoantibodies, but rarely, it is inherited via mutations of the ADAMTS13 gene. The idiopathic autoimmune form of the disease is the most common.
The first acute episode of TTP usually occurs during adulthood, but TTP begins in childhood in the inherited forms. Rapid recognition of TTP is crucial to initiate appropriate treatment. Diagnosis relies on the combination of the clinical symptoms, the disturbed laboratory parameters and the measurement of ADAMTS13. Prompt identification/exclusion of TTP can be facilitated by rapid ADAMTS13 testing. Diagnostic assays are available to identify ADAMTS 13 activity. The most commonly utilized enzyme-linked immunosorbent (ELISA) assay takes several hours to perform and so does not generally permit rapid testing. Nowadays, automated tests are available to measure ADAMTS13 activity. Also, acquired antibodies to the enzyme can be measured. Antibodies to ADAMTS 13 can be demonstrated in about 75% of cases of acquired TTP associated with ADAMTS 13 activity levels <10%. These antibodies reduce circulating functional enzyme levels. Most autoantibodies are inhibitory and therefore can be detected and titrated in vitro using classical mixing studies. The use of recombinant ADAMTS 13 in an ELISA allows the rapid identification of autoantibodies, primarily IgG.
A long-term follow-up of patients with TTP is crucial to identify the occurrence of other autoimmune diseases, to control relapses, and to evaluate clinical sequelae. Long-term follow-up of patients with TTP, includes medical consultation, standard laboratory tests, and ADAMTS13 activity monitoring.
WHOLE GENOME SEQUENCING FOR MYELOID CANCER DIAGNOSIS
Eric Duncavage
Washington University, USA
Genomic analysis is essential for risk stratification in patients with acute myeloid leukemia (AML) and myelodysplastic syndromes (MDS). Whole genome sequencing (WGS) has the potential to greatly simplify and improve conventional multi-modality diagnostic approaches involving cytogenetics, FISH, and panel-based sequencing by allowing for comprehensive genomic evaluation in a single rapid assay. While WGS has historically been too complex and too expensive for use in the clinical laboratory, recent advances in sequencing and data analysis coupled with rapidly decreasing sequencing prices have made WGS an attractive alternative to conventional testing. This presentation will focus on key technical innovations that have allowed the routine use of WGS in the clinical laboratory as well as data demonstrating the clinical utility of WGS compared to conventional testing.
MOLECULAR AML MRD
Eric Duncavage
Washington University
Measurable (or minimal) residual disease (MRD) has become an important biomarker in the management of acute myeloid leukemia (AML) and other myeloid malignancies. While AML MRD has been historically measured by flow cytometry, interpretation of data is complicated and is limited to cases with blast phenotypes that can be distinguished from normal. Early molecular MRD methods using PCR-based identification of recurrent translocation (i.e., PML::RARA) have shown a high sensitivity and high predictive value for identifying relapse, however, these methods are limited to the subset of AML patients with recurrent translocations. Newer sequencing-based MRD assays which target gene level mutations present in >90% of AML cases have had a major impact in the management of AML. Recent advances in error corrected sequencing and drops in sequencing costs have made sequencing-based MRD assays accessible to more laboratories. This talk will focus on methods for sequencing-based MRD, clinical interpretation of MRD data, and how MRD data is being used to guide treatment decisions.
BEREND HOUWEN MEMORIAL LECTURE
Charles Eby
Washington University, USA
ISLH is a unique organization, promoting education in laboratory hematology by collaborating with colleagues and societies throughout the world. This presentation will review the evolution of ISLH from its inception 35 years ago to the present, highlighting significant events and innovations that sustain ISLH's mission. Laboratory Stewardship is an ideal that is widely embraced while challenging to implement. The second part of this presentation will address some of the underlying principles and values of laboratory stewardship from the perspective of one academic medical center in the United States.
ERYTHROID ABNORMALITIES IN MYELOPROLIFERATIVE NEOPLASMS
Wendy Erber
Myeloproliferative neoplasms are clonal disorders with well-defined driver mutations (e.g., JAK2 V617F) leading to uncontrolled myeloproliferation in the marrow. The excess erythroid, granulocytic and / or megakaryocytic marrow activity has consequent blood count changes. This presentation will focus on the alterations in the erythroid lineage, and include blood count, blood film and marrow erythroid features and demonstrating the importance of these at diagnosis, assessing changes throughout the disease course and monitoring effects of therapy. The number and appearance of the red cells may be normal (essential thrombocythaemia) or abnormal (e.g., polycythaemia vera; myelofibrosis). In polycythaemia vera, where there is panmyelosis, the marrow erythroid hyperplasia results in erythrocytosis, high haemoglobin and haematocrit and crowding together of red cells on the blood film. In contrast, in myelofibrosis, there may be reduced erythroid activity and, together with splenomegaly, leads to mild-to-moderate anaemia with poikilocytosis, including dacrocytes. Other blood count changes include alterations in MCV (e.g., low with microcytic iron deficient red cells; high secondary to therapy) and MCH (hypochromasia). Increases in the RDW may be seen with disease progression, evolving iron deficiency, dyserythropoiesis or therapy and evident as dimorphism on the blood film. The red cell changes may be accompanied be informative blood count and film changes in the leucocytes and platelets, e.g. leucoerythroblastic blood film, thrombocytosis, blast cells as well as the number and morphology of nucleated red cells. The erythroid changes in the marrow, include abnormalities of number, size of erythroid islands, location and differentiation, will also be discussed.
MORPHOLOGY OF MYELOPROLIFERATIVE NEOPLASMS
Wendy Erber
The University of Western Australia
The myeloproliferative neoplasms (MPN) are a group of clonal stem cell disorders with similarities at the phenotypic and molecular level. Clinically, they are characterised by over-production of one or more mature myeloid elements and a variable tendency to develop acute myeloid leukaemia (AML). Polycythaemia vera (PV), essential thrombocythaemia (ET) and primary myelofibrosis (PMF) overlap clinically and share a tendency to undergo phenotypic shift, such that patients with ET may develop PV, and ET or PV may undergo myelofibrotic transformation. In this presentation the morphology of PV, ET and PMF will be described. The presentation will focus on the blood count and film appearances as well as bone marrow cellularity, pattern, megakaryocyte morphology and reticulin content.
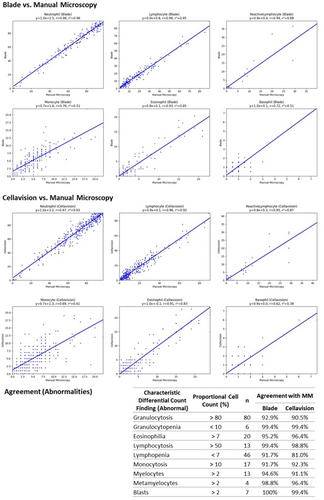
A REAL-WORLD EVALUATION OF A SEMI-SUPERVISED ARTIFICIAL-INTELLIGENCE MODEL (ASUS BLADE) WITH THE CELLAVISION DM9600
Bingwen Eugene Fan1,2, David Tao Yi Chen3, Yi Xiong Ong4, Kian Guan Eric Lim4, Wei Yong Kevin Wong4, Yi Pin Joshua Ong3, Shu-Yu Hsu5, Yuan Shan Neo3, Pik Wan Erica Chiang2, Siti Thuraiya Binte Abdul Latiff2, Shu Ping Lim4, Moh Sim Wong2, Hemalatha Shanmugam1, Stefan Winkler3, Ponnudurai Kuperan1,2
1Department of Haematology, Tan Tock Seng Hospital Singapore, Singapore, 2Department of Laboratory Medicine, Khoo Teck Puat Hospital Singapore, Singapore, 3ASUS Global Pte Ltd Singapore, Singapore, 4Department of Laboratory Medicine, Tan Tock Seng Hospital Singapore, Singapore, 5ASUSTeck Computer Inc. Taipei, Taiwan
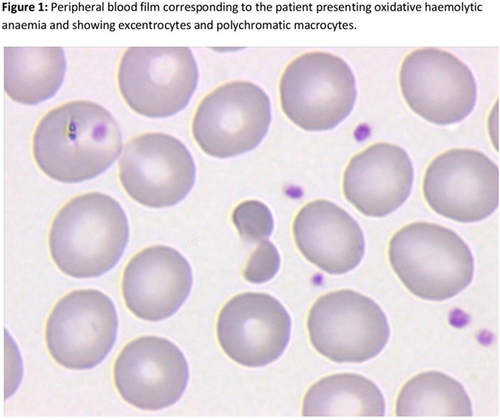
ACUTE HAEMOLYTIC EPISODE AND METHEMOGLOBINEMIA CAUSED BY EATING BROAD BEANS FOR THE FIRST TIME IN ADULTHOOD
Joana Faneca1, Adrián Tomé2, Jesðs Aibar2, Angel Molina1, José Luis Bedini1, Anna Merino1
1Biochemical and Molecular Genetics Department, CORE Laboratory, CDB, Hospital ClÃnic of Barcelona, Barcelona, Spain, 2Clinical Institute of Internal Medicine and Dermatology, ICMIiD, Hospital ClÃnic of Barcelona, Barcelona, Spain
IRON DEFICIENCY IN CHRONIC INFLAMMATORY CONDITIONS
Kleber Fertrin
University of Washington, USA
Iron deficiency remains the most prevalent cause of anemia worldwide but the overlap with concurrent inflammation may make its recognition challenging using traditional markers of iron status that are affected by low-grade inflammation present in common conditions, such as chronic kidney disease, cirrhosis, or heart failure. This session will present a pragmatic way of interpreting diagnostic lab tests based on available evidence of how iron deficiency manifests in conjunction with chronic inflammatory conditions, and aims to help recognize patterns associated with higher chance of response to oral or parenteral iron supplementation, and aid clinicians at making personalized decisions when patients do not fit usual guidelines.
SIDEROBLASTIC ANEMIAS
Mark Fleming
Boston Children's Hospital
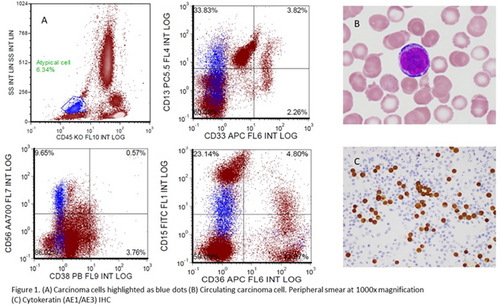
DETECTION OF CIRCULATING CARCINOMA CELLS BY PERIPHERAL BLOOD FLOW CYTOMETRY
Cody Forsyth, Nam Ku
UCLA, Department of Pathology and Laboratory Medicine Los Angeles, CA, USA
ISED ELITE: USING RHEOLOGY TO EXPEDITE ESR TESTING
Steve Giarrusso, Joseph Langella, Francesco Frappa, Megan McCutcheon
ALCOR Scientific, LLC Smithfield, RI, USA
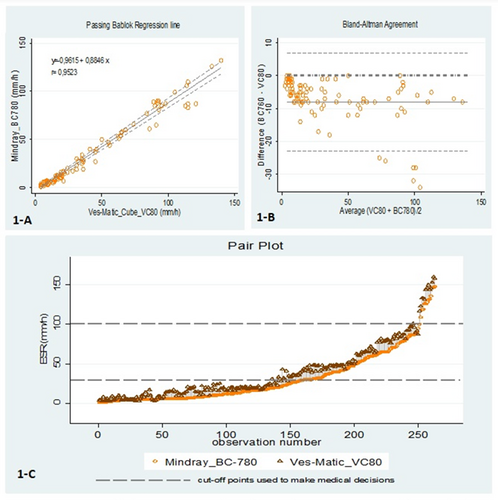
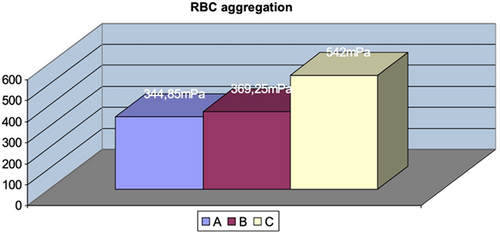
Introduction: Erythrocyte sedimentation rate (ESR) is a common laboratory test used to help determine if a patient has an inflammatory condition or help monitor patients with inflammatory conditions. 48 million ESR tests are performed in the US annually. Traditional ESR testing is done using a manual or semi-automated version of the Westergren method. The iSED ELITE is the latest platform in the iSED instrument family. Results are available within 20 s with minimal hands-on time, significantly reducing time to result and improving patient care. Method: The iSED technology is based on syllectometry and utilizes photometric rheology reading to quantify the rouleaux formation, which is the earliest phase of red blood cell (RBC) sedimentation. RBCs are injected into the analyzer's flow cell, and the shear stress causes them to disaggregate. Sensors capture the difference in light transmission over time as the RBCs begin to re-aggregate. The technical innovation of the iSED analyzers consists of “directly” measuring the aggregation of the RBCs, whereas traditional methods “indirectly” measure aggregation of the RBCs by recording the length at which the cells settle in a Westergren tube. The iSED ELITE technology is highly correlated to the Westergren method, but test results are available within 20 s without the drawbacks and inconvenience of traditional ESR testing. Results: Method Correlation (iSED ELITE vs. Westergren) was performed according to CLSI Procedure H02-5. The method correlation (n = 200), analyzed by Passing Bablok regression, result in a regression equation of y = 1.0 + 1.0×, 95% CI of the slope is 0.94–1.07, 95% CI of intercept is 0.43–2.3. CuSum test is greater than 0.05, showing no deviation from linearity. Paired T-Test shows equivalence. Precision studies (40 patients X 5 replicates), across the clinical range of interest, demonstrated average precision results of 6.1% for samples less than 20 mm/hr. and 3.9%, for samples 20–60 mm/hr. Traditional ESR testing is commonly affected by environmental variables as well as variables within the sample. The iSED ELITE sample is analyzed within seconds in a closed environment, limiting potential impact of environment factors, and sampling is done by the instrument, eliminating the potential for human error and improving operator safety. Conclusion: The direct ESR measurement possible with the photometric determination of ESR based on syllectometry is comparable with the Westergren methodology, and results are available in seconds versus minutes to one hour, significantly improving patient care and laboratory efficiency.
MOLECULAR FINDINGS IN LYMPHOID NEOPLASMS CLASSIFICATION
Sarah Gibson
Mayo Clinic, Phoenix, USA
In 2022, two separate classification systems for hematological malignancies were proposed: the fifth edition of the WHO Classification of Haematolymphoid Tumours (WHO-HAEM5) and the International Consensus Classification (ICC) of Mature Lymphoid Neoplasms, Myeloid Neoplasms and Acute Leukemias. Although both proposed classifications include an increased emphasis on genetic testing for the diagnosis and prognostication of lymphoid neoplasms, there are some distinctive differences. This session will review some of the key differences and similarities between the WHO-HAEM5 and ICC classifications and highlight what types of genetic testing are currently recommended for the classification of lymphoid neoplasms.
SELECTING APPROPRIATE AML PATIENTS FOR CD7-CAR-T THERAPY ACCORDING TO IMMUNOPHENOTYPE
Meiwei Gong, Hui Wang
Hebei Yanda Lu Daopei Hospital Langfang, China
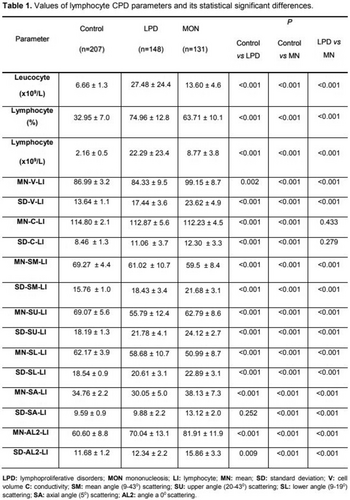
USEFULNESS OF LYMPHOCYTE CPD PARAMETERS IN BECKMAN COULTER DXH-900 HEMATOLOGY ANALYZER IN LYMPHOPROLIFERATIVE CHRONICAL DISORDERS AND VIRAL INFECTION DIAGNOSIS
Pablo González-Rodriguez1, Bea GarcÃa-GarcÃa2, Alicia MartÃnez-Iribarren1, Alba Leis-Sestayo1, Xavier Tejedor-Ganduxé1, Cristian Morales-Indiano1
1Laboratory Medicine Department, Hospital Universitari Germans Trias i Pujol Badalona, Spain, 2Laboratory Medicine Department, Hospital Universitari Son Espases Palma de Mallorca, Spain
ARTIFICIAL INTELLIGENCE (AI)-DRIVEN CLINICAL DECISION SUPPORT: POTENTIAL TO PREDICT THE RISK FOR COAGULATION DISORDERS
Raj Gopalan, Jennifer Sanderson
Siemens Healthineers Diagnostics Tarrytown, NY, USA
VISCOELASTOGRAPHY
Michelle Grant
Geisinger
Viscoelastic assays are global tests of hemostasis performed on whole blood. Although previously marketed as point of care devices, technological limitations such as manual pipetting and liquid quality control, limited their implementation. Recently cartilage-based testing emerged onto the market, making the technology more widely available. Unfortunately, most of the guidelines for viscoelastography are clinically based with an emphasis on interpretation and assessment of hemostasis in different disease states as well as the utilization of blood products based on the results. The objectives of the session will focus on providing guidance for successful implementation of viscoelastrography including selection criteria for devices, staff qualifications, training and competency, safety and waste disposal, information technology assessment and integration, and quality control/assurance requirements and framework.
PRACTICAL TIPS FOR SETTING REFERENCE RANGES FOR TRANSGENDER PEOPLE
Dina Greene
University of Washington
Transgender and non-binary people have a gender identity that differs from their sex assigned at birth. Standard of care for these individuals is to administer gender affirming hormones to promote development of secondary sex characteristics that align with gender identity. A masculine-identified person will take testosterone; a feminine-identified person will take estradiol with or without anti-androgens. Testosterone stimulates erythropoiesis, leading to different reference intervals for red cell indices between adult cisgender men and women. Estrogen treatment in cisgender women is associated with procoagulant profile. This session will highlight the current knowledge related to interpreting hematology and coagulation results in gender diverse people prescribed gender affirming hormones.
WALLACE H. COULTER DISTINGUISHED LECTURE
Andreas Greinacher
Institut fur Transfusionsmedizin, UniversitÃtsmedizin Greifswald, Germany
PLATELET FACTOR 4 TRIGGERS THROMBO-INFLAMMATION BY BRIDGING INNATE AND ADAPTIVE IMMUNITY
Andreas Greinacher
UniversitÃtsmedizin Greifswald Greifswald, Germany
Platelet factor 4 (PF4, synonym: CXCL4) is an evolutionary old chemokine with proposed roles in hemostasis and antimicrobial defense. In addition, PF4 has attracted considerable attention as a crucial mediator of one of the most prothrombotic adverse drug effects affecting blood cells, heparin-induced thrombocytopenia (HIT). Interest in PF4 substantially increased in 2021 when it was identified as the target antigen in the life-threatening adverse effect, vaccine-induced immune thrombotic thrombocytopenia (VITT). The lecture will address the concept that a major biological function of PF4—a strongly cationic chemokine—is to bind to negatively-charged prokaryotic microorganisms. This results in structural changes in PF4 that trigger a danger signal recognized by the adaptive immune system. Application of biophysical tools has provided substantial insights into the molecular mechanisms by which PF4 becomes immunogenic, providing insights into a new mechanism of autoimmunity. According to this new mechanism, binding of autoantibodies with high affinity induces conformational change(s) in endogenous proteins. When high avidity anti-PF4 autoantibodies bind to PF4, it is recognized as foreign antigen, which leads to the prothrombotic disorders, autoimmune HIT and VITT. Both present prototype examples of antibody mediated thrombo-inflammation and immune-thrombosis. Immune complexes containing PF4 and anti-PF4 IgG cluster and signal through FcRgIIA, which generates procoagulant platelets, activates monocytes, induces platelet/neutrophil aggregates, and stimulates Netosis by neutrophils. DNA released by Netosis amplifies immune injury and activates complement, which deposits on the endothelium. Endothelial cells become activated, expressing tissue factor and releasing von Willebrand factor. Von Willebrand factor binds PF4 and subsequently anti-PF4 antibodies, which in turn further activates neutrophils and further propagates thrombin generation. These self-enhancing amplification loops can be interrupted by inhibiting thrombin (generation) by non-heparin anticoagulants and further upstream by blocking FcRgIIA by high dose IVIG. Current assays for HIT and VITT show how structural aspects of anti-PF4 pathobiology relate to assay design and performance characteristics. Currently, functional (platelet activation) assays using washed platelets detect HIT antibodies when heparin is added, and VITT antibodies when PF4 is added. Solid-phase PF4-dependent immunoassays using microtiter plates are sensitive for both HIT and VITT antibodies. However, rapid immunoassays, in which the PF4/heparin antigen is coated on beads, are sensitive and specific for HIT, but not for VITT antibodies. Reports are evolving describing an association of PF4-dependent platelet activating antibodies in patients with (recurrent) venous and arterial thromboses. These reports might indicate that such anti-PF4-antibodies could be of clinical relevance beyond HIT and VITT.
COMPARISON BETWEEN MINDRAY BC-6200 AND MICROSCOPY FOR THE ANALYSIS OF NUCLEATED RED BLOOD CELL COUNT NRBC
Luciana Gualco1, Corallo M1, Declerk P1, Barca E1, Castelo F1, Mainetti G1
1Laboratorio de HemocitologÃa, Hospital Fernández Buenos Aires Argentina, 2Laboratorio de HemocitologÃa, Hospital Fernández Buenos Aires Argentina, 3Laboratorio de HemocitologÃa, Hospital Fernández Buenos Aires Argentina, 4Laboratorio de HemocitologÃa, Hospital Fernández Buenos Aires Argentina, 5Laboratorio de HemocitologÃa, Hospital Fernández Buenos Aires Argentina, 6Laboratorio de HemocitologÃa, Hospital Fernández Buenos Aires Argentina
Introduction: Circulating erythroblasts are precursors of red blood cells confined, in adults, to the bone marrow. In fetuses and neonates, these cells can be found in low concentrations in peripheral blood. The appearance of erythroblasts in peripheral blood is a marker of abnormal erythropoiesis and/or hypoxic stress. Several studies demonstrate that the evolution of the count of these cells could serve as an early indicator of mortality. Since erythroblasts are nucleated cells, they interfere with the measurement of white blood cells, which is why having an automated hematology analyzer that has a specific chamber for its detection and counting is extremely important. The objective of this study was to compare the NRBC count obtained by the Mindray BC-6200 hematology analyzer versus that obtained by optical microscopy. Methods In order to compare the two methods and thus determine whether the automated count could replace the manual count with sufficient precision, we used Spearman's correlation coefficient and the bias obtained by the Bland-Altman method. 145 samples from patients at Hospital Fernández (Buenos Aires, Argentina) were processed, the NRBC count was performed by two methods: automated in the BC-6200 hematology counter and manual by microscopy in peripheral blood smears. To evaluate the manual NRBC counts, all samples included in this study underwent microscopic review according to the morphological criteria defined by the International Council for Standardization in Hematology (ICSH) recommendations. For the statistical treatment of the data, the Graph Pad Prism program was used. Spearman's correlation coefficient and concordance by the Bland Altman method were analyzed. Results In this way, not only the linear association between the measurements is evaluated, but also the concordance between them. 145 samples from patients at Hospital Fernandez covering a measurement range from 0 to 800 NRBC/100 WBC (linearity reported by the manufacturer: 0–600 NRBC/100 WBC) were analyzed, obtaining a Spearman correlation coefficient of 0.9682 was obtained and bias obtained by the Bland-Altman method was −0.74. Conclusions The possibility of automating the NRBC count implies a benefit, especially in those leukopenia patients where it is difficult to perform the count by optical microscopy. With this results we can say that we could use the quantification of NRBC by the Mindray BC-6200 with excellent performance.
EVALUATION OF THE FRC% PARAMETERS OF MINDRAY BC-6200 HEMATOLOGY ANALYZER ON THE DETECTION PERFORMANCE OF POIKILOCYTOSIS
Luciana Gualco, Corallo M, Declerk P, Barca E, Castelo F, Mainetti G
Laboratorio de HemocitologÃa, Hospital Fernández Buenos Aires, Argentina
Introduction: More than 1% of morphologically identified schistocytes on the blood film are considered suspicious for thrombotic microangiopathy (TMA) [1]. Schistocytes should be identified by experienced morphologist. The fragment red cell count (FRC) generated by some automated hematological analyzers provides a valuable screening tool for the presence of schistocytes[1]. The Mindray BC-6200 hematology analyzer implements the adaptive multidimensional morphological boundary classification technology to detect FRC. which would be an extremely useful tool in the suspicion of morphological alterations of erythrocytes. The objective of this work was to analyze the behavior of FRC% and FRC# in samples with and without morphological alterations of the erythrocytes. Methods We processed 294 samples in BC-6200 hematology analyzer from patients at Hospital Fernández, including 77 samples without morphology abnormalities. 120 with poikilocytosis but without schistocytes /spherocytes and 97 with schistocytes and spherocytes; the morphology of erythrocytes was reviewed by optical microscopy in peripheral blood smears. For the statistical treatment of the data, the Graph Pad Prism program was used. The results were expressed as median and maximum and minimum. To assess the significance of the differences between the groups, the Kruskal-Wallis test was used with Dunn's post-test of multiple comparisons when the differences were significant. Results The values obtained were: Without morphological abnormalities Poikilocytosis Schistocytes + Spherocytes FRC % 0.2 (0.10–0.82) 0.66 (0.20–2.37) 1.20 (0.24–18.20) FRC # 0.0088 (0.0045–0.0376) 0.02605 (0.0072–0.0817) 0.0387 (0.0078–0.2940) Significant differences (p < 0.05) were observed in the FRC% and FRC# parameters among the three groups analyzed. Conclusions We observed an increase in FRC% and FRC# in samples that present poikilocytosis, and even more in those with schistocytes and spherocytes, this is due to the reduction of non-specific binding of proteins on the cell membrane to fluorescent dyes, so the fluorescent signal of RBC fragments is smaller than that of intact erythrocytes (due to the size and the content of hemoglobin). It is proposed that these parameters should be taken into account when analyzing blood samples and could be used as smear review criteria.
Reference
[1] Zini G, 2021 update of the 2012 ICSH Recommendations for identification, diagnostic value, and quantitation of schistocytes: Impact and revisions. Int J Lab Hematol. 2021;43(6):1264-1271.
EXTENDED CBC CHANNELS AND MACHINE LEARNING: WE COULD MANY DIAGNOSTIC TALES UNFOLD, TRUST ME!
Rana Zeeshan Haider1,2, Najeed Ahmed3
1National Institute of Blood Disease Karachi, Pakistan, 2The Sahara University Narowal, Pakistan, 3NED University of Information and Technology Karachi, Pakistan
HBA2
Cornelis Leonard Harteveld
Leiden University Medical Center, The Netherlands
Standardization of hemoglobin A2 for beta-thalassemia screening; update by the IFCC/ICSH Joined Working Group.
Cornelis L. Harteveld (on behalf of the JWG)
Standardization of laboratory tests is instrumental for the detection of beta-thalassemia carriers when using HbA2 levels as a first indicator. A variety of HPLC and CE instruments are on the marked to separate Hb fractions and quantitate the HbA2 and used in screening- and diagnostic laboratories as part of a premarital, preconception or antenatal screening program for the prevention of hemoglobinopathies identifying beta-thalassemia carriers by an elevated HbA2. The present WHO HbA2 standard is already over 30 years old and reaching its end. The IFCC standardization project started in 2004 and in 2015 the ICSH joined in collaboration in the IFCC/ICSH Joined Working Group (JWG). The project involves the developing a reference measurement procedure, defining and producing calibrators and certified reference materials. Recently a road map was published to illustrate the steps still to be taken and the role of the different stakeholders in this process.
An overview will be given of what has been done so far, and what still needs to be done to achieve the final goal, that is, a certified reference material for HbA2 measurement to facilitate standardization worldwide.
CONSTRUCTION OF AN AUTOMATIC QUANTIFICATION METHOD FOR BONE MARROW CELLULARITY USING IMAGE ANALYSIS SOFTWARE
Yuki Hatayama1, Yukari Endo2, Takuya Iwamoto1, Hitomi Ichikawa1, Koji Kawamura3, Tetsuya Fukuda1, Toru Motokura3
1Division of Clinical Laboratory, Tottori University Hospital Yonago Japan, 2Department of Pathology, Tottori University Hospital Yonago Japan, 3Division of Clinical Laboratory Medicine, Department of Multidisciplinary Internal Medicine, School of Medicine, Tottori University Faculty of Medicine Yonago Japan
[Background] Although evaluation of bone marrow cellularity is largely dependent upon visual estimates, it is rapid but roughly semi-quantitative. The aim of this study was to construct an automatic quantification method for bone marrow cellularity using image analysis software. [Methods] We used HE specimens of bone marrow biopsies and clots from patients who underwent bone marrow examination at Tottori University Hospital from 2020 to 2022. Cellsens (OLYMPUS) and WinRoof2015 (Mitani Corporation) were used for image analysis. We developed a method in which the non-fat area is used as a quantification value for cellularity (method A), and a method in which the nuclear area of cells is quantified by discriminant analysis after monochromeizing the image and the cellularity is calculated (method B). The cellularity evaluation was compared with the visual estimates in pathology reports. [Results] A total of 91 HE specimens were used in 54 cases. The male to female ratio was 29:25, 38 biopsy and 53 clot specimens were included. Cellularity was visually scored as hypocellular (N = 17), normocellular (N = 44), or hypercellular (N = 30). In comparison with the visual estimates in the pathology reports, the correlation coefficients of methods A and B were 0.80 and 0.85, respectively. In ROC analysis with hypocellularity as the objective variable, the AUC for method B was significantly higher (0.95 vs. 0.88, p < 0.01). In ROC analysis with hypercellularity as the objective variable, AUC of method B showed higher than method A (0.96 vs. 0.93, p = 0.18). Akaike's information criterion (AIC) of methods A and B were 495.3 and 504.9, respectively. Next, we developed a method C by combining methods A and B. When comparing the method C with the visual estimates in the pathology reports, the correlation coefficient was 0.88, and the AUCs for hypocellularity and hyper cellularity were 0.94 and 0.97, respectively. In addition, AIC was 467.4, which was the lowest among the three methods. [Conclusions] The quantification value by method A was overestimated in hypocellular marrows and that of method B tends to overestimate in hypercellular marrows. With the method C, the most appropriate values can be obtained for the pathology reports.
RARE INHERITED COAGULATION AND FIBRINOLYTIC DEFECTS THAT CHALLENGE DIAGNOSTIC LABORATORIES
Catherine Hayward
McMaster University, Canada
Introduction: Coagulation factors, anticoagulants, and fibrinolytic proteins are important for hemostasis, and mutations affecting these proteins cause some rare inherited bleeding disorders that are particularly challenging to diagnose. This review provides current information on rare inherited bleeding disorders that are difficult to diagnose. Methods: A review of the literature was conducted for up-to-date information on rare and difficult to diagnose bleeding disorders. Results: Some rare bleeding disorders cause an inherited deficiency of multiple coagulation factors (F), such as combined FV and FVIII deficiency and familial vitamin K dependent clotting factor deficiency. Additionally, congenital disorders of glycosylation can affect a variety of procoagulant and anticoagulant proteins and also platelets. Some bleeding disorders reflect mutations with unique impairments in the procoagulant/anticoagulant balance, including those caused by F5 mutations that secondarily increase the plasma levels of tissue factor pathway inhibitor as well as THBD mutations that increase functional thrombomodulin in plasma or cause a consumptive coagulopathy due to thrombomodulin deficiency. Some bleeding disorders accelerate fibrinolysis due to loss-of-function mutations in SERPINE1 or SERPINF2, or in the case of Quebec platelet disorder, a duplication mutation that rewires PLAU and selectively increases expression in megakaryocytes, resulting in a unique platelet-dependent gain-of-function defect in fibrinolysis. Conclusions: Current information on rare and difficult to diagnose bleeding disorders indicates they have unique clinical and laboratory features, and pathogenic characteristics to consider for diagnostic evaluation. Laboratories and clinicians should consider these disorders in their strategy for diagnosing bleeding disorders.
EVALUATION OF BLOOD CELL CLASSIFICATION PERFORMANCE AND DETECTION OF ABNORMAL HEMATOPOIETIC CELLS IN PERIPHERAL BLOOD SMEARS BY A NOVEL AUTOMATED IMAGE ANALYSIS SYSTEM USING DEEP CONVOLUTIONAL NEURAL NETWORK
Yuki Horiuchi1,2, Kenji Tayama2, Akihiko Matsuzaki2, Kumiko Nishibe2, Kimiko Kaniyu2, Yosuke Iwasaki3, Aya Konishi3, Yoko Tabe1,2
1Department of Clinical Laboratory Medicine, Juntendo University Graduate School of Medicine Tokyo Japan, 2Department of Advanced Research Institute for Health Science, Juntendo University Graduate School of Medicine Tokyo Japan, 3Sysmex Corporation Kobe Japan
Introduction: We have constructed a Deep Learning System (DLS) that uses Convolutional Neural Networks (CNN) to recognize cell characteristics by cell classifications and morphological abnormality comments in peripheral blood (PB) smears. In this study, the cell classification performance and ability to detect abnormal cells by this system was evaluated using routine PB smears. MATERIALS AND Methods: Training of the morphological DLS was performed by CNN using approximately 1 million digitalized PB cell images collected at Juntendo University Hospital (Tokyo, Japan). PB smears were stained with May Grunwald-Giemsa using a fully automated slide-maker SP-50 (Sysmex), and the digital cell images were obtained by DI-60 (Sysmex). The performance of DLS was evaluated using total 139 378 images from 589 PB smears (375 patients and 214 healthy controls). Data were analyzed using JMP15 software (SAS). Results: The accuracy of cell classification ability was 97.3% or higher for all 17 classifications. The accuracy of assigning abnormal comments was 90% or higher for 11 of 12 abnormal comments related to lymphoid cells in the lymphoma cases and 12 of 16 abnormal comments related to mature neutrophils in the MDS cases. In all 118 PB smears determined to have abnormal cells by routine microscopic examination in the hematology laboratory, the DLS was able to detect abnormal cells with the classifications to blasts (n = 115) or morphological abnormality of lymphocytes (n = 3). Abnormal comments of lymphocytes appeared more frequently in the lymphoma group than in the HC group (p > 0.05). CONCLUSIONS The constructed DLS showed good performance not only in cell identification, but also in the recognition of morphological abnormalities that contribute to the detection of abnormal cells.
IS IMATINIB THE BEST CHOICE FOR PLANNING TREATMENT FREE REMISSION IN CML PATIENTS?
Nahla Ibrahim
Pro Dr Holly Makkah, Saudi Arabia
Background: Treatment of chronic myeloid leukemia had been revolutionized by the use of Tyrosine kinase inhibitors. Recently, the strategy of treatment free remission had been introduced to reduce toxicity and financial burden beside allowing patients who now have similar survival to normal people to achieve some goals as childbearing. Aim of this study: to check the suitability of imatinib as a first line treatment in potential patients in whom treatment free remission will be an ultimate goal. Methods: This study included patients with chronic myeloid leukemia, chronic phase in the period between 2011 and 2020. Initial diagnosis was done by bone marrow, cytogenetics, molecular testing for BCR/ABL in addition to quantitative estimation of BCR-ABL1 on peripheral blood every 3 months. Results: 140 patients were included in this study who received imatinib as first line therapy. The male to female ratio was 1.1 and the median age was 42 years. The majority of patients were considered low risk (70.2%) as by EUTOS risk score. Breakpoint region was e13/a2 in 39.3%, e14/a2 in 38.3% and unknown in 22.7% of patients. 62% of patients were compliant with treatment. At the time of analysis, 79 patients (56%) remained on imatinib. 51/140 (36%) stopped it due to failure, 11 due to intolerance (7.9%). Favorable molecular responses were achieved in 67.4%, 53.9% and 50% at 3, 6, 12 months respectively Compliance and risk scores were significantly affecting these responses. 54/70 (77%) of those who achieved MMR at 12 months achieved a deep molecular response (M4, M4.5) after a median period of 36 m. 40 patients (57%, 74%) of those who achieved MMR, DMR respectively developed DMR lasting for more than 2 years (which is the requirement for TTF). This also reflects 28.5% of the whole group of patients. Conclusions: Although Imatinib continues to be the preferred first line in treating CML, CP yet it might be more suitable to use a second generation TKI if TFR is planned ahead.
ACUTE MYELOID LEUKEMIA IN A PATIENT TREATED WITH PEMBROLIZUMAB FOR STAGE IV NON-SMALL CELL LUNG CANCER
Nahla Ibrahim
Professor Dr Nahla Ahmed Holloy Makkah, Saudi Arabia
EVALUATION OF THE CLINICAL UTILITY OF IMMATURE PLATELET FRACTION (IPF) MEASUREMENT IN PATIENTS WITH THROMBOCYTOPENIC CONDITIONS IN AN ACUTE CARE HOSPITAL IN SINGAPORE
Frederick Ilagan, Siti Thuraiya Bte Latiff, Ping Ying Heng, Vishnu Prasad
Khoo Teck Puat Hospital Singapore, Singapore
Introduction: Thrombocytopenia is a condition characterised by an abnormally low platelet count. The causes of thrombocytopenia are broadly classified into two categories: ineffective platelet production and increased platelet destruction or consumption. In Khoo Teck Puat Hospital (KTPH), the adult reference interval for platelet count is 173 to 414 × 109 cells/L. Immature platelet fraction (IPF) measurement is available on the haematology fluorescence flow cytometry analyser Sysmex XN-9000 (Sysmex, Japan) which is used in the Department of Laboratory Medicine. IPF is suggested to be useful in the differential diagnosis for thrombocytopenia. The authors seek to perform a clinical validation on the utility of the IPF parameter in an acute care hospital in Singapore. Methods: IFP results from fifty thrombocytopenic patients were correlated against their clinical diagnosis. Fourteen patients had undergone bone marrow aspirate procedure for clinical diagnosis. Three patients also tested on A Disintegrin-like Metalloprotease domain with ThromboSpondin type 1 motifs (ADAMSTS13) assay to confirm thrombotic thrombocytopenic purpura (TTP). Dengue serology tests (dengue NS1 antigen, Dengue IgM and Dengue IgG) were performed on thirty-three patients to confirm dengue virus infection. The patients are grouped according to the two manufacturer recommended clinical ranges: 1.1%–6.1% which is indicative of ineffective platelet production and above 6.2% which is indicative of increased platelet destruction or consumption. Sensitivity, specificity and predictive values of IPF was calculated with data collected. Results: In patients with conditions resulting in ineffective platelet production, the IPF parameter showed a sensitivity and specificity of 100% and 76% respectively. The positive and negative predictive values are 27% and 100%. The overall efficiency is 78%. In patients with conditions resulting in increased platelet destruction or consumption, the IPF parameter showed a sensitivity and specificity of 76% and 100% respectively. The positive and negative predictive values are 100% and 27%. The overall efficiency is 78%. Conclusions: The study shows that the IPF parameter is useful in the differential diagnosis of thrombocytopenic patients. The authors suggest that the inclusion of IPF parameter as a reflex test for patients with unclear or unknown cause of thrombocytopenia may provide insight on additional diagnostic tests that can be requested for confirmation of diagnosis in patients with thrombocytopenia.
QUALITY ASSURANCE IN CAR-T THERAPY: HOW THE LAB SUPPORTS THE PATIENT JOURNEY
Swami Iyer
MD Anderson
APPLIED MACHINE LEARNING IN HEMATOPATHOLOGY
Clinton J V Campbell
McMaster University, Canada
An increasing number of machine learning applications are being developed and applied to digital pathology, including hematopathology. The goal of these modern computerized tools is to support diagnostic workflows by extracting and summarizing information from multiple data sources, including whole-slide images (WSI) of human tissue. Hematopathology is inherently multimodal and can serve as an ideal case study for machine learning applications in pathology. However, hematopathology also poses unique challenges when applying machine learning approaches. By modeling the pathologist workflow and thinking process, machine learning algorithms can be designed to address practical and tangible problems in hematopathology. In this presentation, the role of machine learning in hematopathology workflows will be discussed. Currently machine learning research trends in the field will be reviewed, with a focus on bone marrow cytology and histopathology, and how adoption of new machine learning tools may be enabled through the transition to digital pathology. Finally, potential future approaches such as multimodal representations will be reviewed, including how such approaches may one day serve as clinical decision support tools in hematopathology.
BURKITT-LIKE VACUOLATED LYMPHOCYTES AS A LEADING DIAGNOSTIC EVIDENCE FOR A RARE LYSOSOMAL STORAGE DISORDER
Elham Jamali1,2, Ehsan Sarraf Kazerooni1, Reza Ranjbaran1
1Diagnostic Laboratory Sciences and Technology Research Center, School of Paramedical Sciences, Shiraz University of Medical Sciences, Shiraz, Iran, 2Peyvand Pathobiology and Genetic Lab Complex, Shiraz, Iran
Introduction: Lysosomal storage disorders (LSDs) are a group of rare inherited diseases, which can go undiagnosed for years due to their heterogeneity. Galactosialidosis is a rare form of LSDs caused by mutations affecting CTSA gene, that encodes the protective protein/cathepsin A. It results in deficiencies of β-galactosidase and neuraminidase 1. Clinical manifestations of galactosialidosis is similar to other lysosomal disorders and its definitive diagnosis is challenging due to lack of available diagnostic test and its infrequency. Methods and results: A 7-year-old female presented with mucopolysaccharidosis-like symptoms including rough facial features, cardiomegaly, and intellectual disability. The size of liver and spleen were normal with no mass lesion. Except for mild neutropenia (ANC: 1.75 × 10⁹/L), no other abnormal hematologic parameters were found in the initial investigation. Comprehensive metabolic and thyroid panels also revealed no noticeable abnormalities in kidney, liver, or thyroid function (TSH: 1.75 IU/mL; T4: 9.5 μg/dL; BUN: 17 mg/dL; Cr: 0.38 mg/dL). No atypical Alder granulation was found in granulocytes and the level of glycosaminoglycansin urine was normal (urine-MPS; 4.2 mg/mmol creatinine), which almost exclude the diagnosis of mucopolysaccharidosis. However, the prominent cytoplasmic vacuoles in peripheral blood smear lymphocytes were still suggestive of a storage disorder. Accordingly, whole exome sequencing was proposed as the next lab investigation and diagnosis of galactosialidosis was confirmed by homozygous mutations in the CTSA gene (c.556C>A: p.P186T). Conclusion: Unlike the cytoplasmic vacuoles in neutrophils and monocytes, which could form in different conditions due to their phagocytic characterization, the presence of these vacuoles in lymphocytes should not be simply ignored as they could be leading evidence for diagnosis of an LSD.
THE PERFORMANCE OF A NEW AI-BASED DIGITAL CELL MORPHOLOGY ANALYZER IN CLINICAL LABORATORIES: A MULTICENTRIC STUDY IN ELEVEN TERTIARY HOSPITALS
Hong Jiang1, Wei Xu2, Wei Chen3, Jun He4, Ming Guan5, Min Liu6, Mianyang Li7, Chenxue Qu8, Ziyong Sun9, Lei Zheng10, Xuefeng Wang11
1West China Hospital of Sichuan University Chengdu China, 2The First Bethune Hospital of Jilin University Jilin China, 3The First Affiliated Hospital of Xi'an Jiaotong University Xian China, 4The First Affiliated Hospital of Soochow University Suzhou China, 5Huashan Hospital Fudan University Shanghai China, 6The First Affiliated Hospital, Sun Yat-sen University Guangzhou China, 7Chinese PLA Ceneral Hospital Beijing China, 8Peking University First Hospital Beijing China, 9Tongji Medical College of Hust Wuhan China, 10Nanfang Hospital Guangzhou China, 11Ruijin Hospital, Shanghai Jiaotong University School of Medicine Shanghai China
Background: Over the past decades, the demand for digital morphology analyzers has increased because conventional microscopic examination is labor-intensive, time-consuming, and requires professionally trained personnel. ICSH recommended the hematology laboratories perform comparison studies before utilizing the digital imaging. The Mindray MC series is a new artificial intelligent-based digital morphology analyzer, and a comprehensive evaluation is essential to use it confidently in laboratories. This study investigated the performance of the instrument in a multicentric setting involving eleven tertiary hospitals in China. Methods: One hundred normal and five hundred abnormal blood samples were analyzed by the MC series and then verified by the morphologists for WBC differential. The pre-classification performance was evaluated by comparing the results before and after verification. The same blood samples were also reviewed by manual microscopies according to the CLSI H20-A2 guidelines, and the post-classification results were correlated with the manual differential to evaluate the post-classification performance. RBC classification function was also studied with a similar procedure. Blood samples with different PLT levels were also analyzed by the MC series, and the PLT counts were compared with that measured by the PLT-O mode of BC-6800plus. We also collected eight EDTA-PTCP blood samples in both EDTA-K2 and sodium citrate-containing vacutainers and then compared their PLT clump numbers with PLT-pro mode. The within-run imprecision and blood smear reading efficiency were also investigated. Results: The agreements between MC series pre-classification and verification on five types of normal WBCs were all very high (κ > 0.96), and they were lower but still acceptable for abnormal WBCs classification (κ = 0.90). The WBC post-classification results correlated very well with manual microscopy review for normal WBCs (r > 0.94) except for basophils (r = 0.848). The regression coefficients for immature granulocytes, blast cells, and nucleated RBCs were above 0.94. For RBC classification, the clinical sensitivity and specificity of each RBC abnormality were all above 90% compared with manual microscopy reviews after verification. The PLT counts estimated by the digital morphology analyzers before and after verification both correlated very well with those measured by the PLT-O approach (r = 0.98). The PLT clumps were classified and counted in the EDTA-PTCP blood samples, and significantly more PLT clumps were detected in the EDTA-K2 group than in the sodium citrate group (p < 0.05). Conclusion: The MC series is an accurate and reliable digital cell morphology analyzer and offers another intelligent option for hematology laboratories.
THE UTILIZATION OF A CHEMILUMINESCENCE-BASED IMMUNOASSAY [HEMOSIL HIT-AB(PF4-H)] IN DIAGNOSIS OF HEPARIN-INDUCED THROMBOCYTOPENIA
Jing Jin1, James L Zehnder2
1Special coagulation, Stanford Health Care Stanford, CA, USA, 2Department of Pathology, School of Medicine, Stanford University Stanford, CA, USA
HOW LOW IS LOW?–A RETROSPECTIVE CHART REVIEW TO EVALUATE THE CLINICAL RELEVANCE OF FACTOR FXIII DEFICIENCY
Jing Jin1, Derick Okwan2, James Zehnder2
1Special Coagulation, Stanford Health Care Stanford, CA, USA, 2Department of Pathology, School of Medicine, Stanford University Stanford, CA, USA
GENETIC ANALYSIS AND HEMOPHILIA IN THE MY LIFE, OUR FUTURE
Jill Johnsen
University of Washington, USA
Hemophilia A (HA) and hemophilia B (HB) are rare inherited bleeding disorders. My Life, Our Future (MLOF) was a multisector cross-sectional U.S. initiative to improve our understanding of hemophilia through widespread genotyping. Individuals with hemophilia and potential female genetic carriers were eligible to enroll at U.S. Hemophilia Treatment Centers (HTCs). Clinical genotyping was performed centrally using a next generation sequencing screen followed by validation by an orthogonal method. Clinical genotyping reports were returned to providers to return to participants. Sites provided sex and factor levels at the time of submission. Additional clinical data were abstracted from the American Thrombosis and Hemostasis Network dataset. From 2013 to 2017, 107 HTCs enrolled 11 341 subjects (68.8% male, 31.2% female) for testing for HA (n = 8976), HB (n = 2358), HA/HB (n = 3), and hemophilia not otherwise specified (n = 4). Genotyping was high yield, with reportable variants detected in most males (98.2% HA, 98.1% HB). Throughout the program, 1914 unique variants were found (1482 F8, 431 F9), of which 744 variants were novel (610 F8, 134 F9). Inhibitor data were available for 6986 subjects (5583 HA; 1403 HB). In severe HA, genotypes with the highest inhibitor rates were large deletions (77/80), complex intron 22 inversions (9/17), and no variant found (7/14). In severe HB, the highest rates were large deletions (24/42). Inhibitor risk was associated with both non-White race and Hispanic/Latino ethnicity, including a higher rate of inhibitors reported in Black (27.3%) versus White (16.2%) subjects. In summary, MLOF is the largest hemophilia genotyping project performed to date. Our results support the need for comprehensive genetic approaches in hemophilia. This effort has contributed significantly towards better understanding variation in the F8 and F9 genes in hemophilia and risks of inhibitor formation.
WHAT'S DRIVING RDW? IN-VITRO AND IN-SILICO EVIDENCE FOR OXIDATIVE STRESS
Huibert-Jan Joosse, Brigitte A van Oirschot, Sander AA Kooijmans, Imo E Hoefer, Richard AH van Wijk, Albert Huisman, Wouter W van Solinge, Saskia Haitjema
Central Diagnostic Laboratory, University Medical Center Utrecht, Utrecht University, Utrecht, Netherlands
CD36 POSITIVE/CD64 NEGATIVE ACUTE LEUKEMIAS WITH IMMATURE BLAST PHENOTYPE AND UNUSUALLY HIGH CD25 INTENSITY. A DISTINCT IMMUNOPHENOTYPIC ENTITY TO BE INVESTIGATED?
Christina Karela1, Nikolaos J Tsagarakis2, Georgios Oudatzis1, Georgios Androutsos2, Ioulia Chaliori2, Maroula Milaiou1, Sofia Nikolaou1, Stefanos I Papadhimitriou2, Sofia Chaniotaki2, Dimitrios Liakopoulos2, Anna Kalogianni1, Paraskevi Vasileiou3, Anna Taparkou4, Theodoros Marinakis5, Elpiniki Kritikou-Griva2, Georgios Paterakis1
1Department of Immunology, GNA G. Gennimatas, Athens, Greece, 2Department of Laboratory Hematology, GNA G. Gennimatas, Athens, Greece, 3«Flowdiagnosis» Diagnostic Centre Athens, Greece, 4First University Department of Pediatrics, Hippokration General Hospital Thessaloniki, Greece, 5Hematology Clinic, GNA G. Gennimatas, Athens, Greece
Introduction: The expression of CD64 in blasts of an acute myeloid leukemia (AML) case has a critical immunophenotypic weight in favor of monocytic commitment, as described in the official guidelines of European LeukemiaNet (ELN). The same is true for CD36, which is also suggested for the investigation of erythroid commitment. The question arises about the ontogenetic origin of CD36positive (pos)/CD64negative (neg) AML. Thus, the aim of this study was to define if there are specific immunophenotypic, morphological, molecular or cytogenetic features in this type of acute leukemias (AL). Methods: We retrospectively studied the immunophenotypic, morphological, cytochemical, molecular and cytogenetic features of all CD36pos/CD64neg AL cases diagnosed during the last 12-years period in our Hospital. Results: During the above period, 16/384 (4.2%) CD36pos/CD64neg AL cases were recorded, with male patients predominating (10/16, 62.5%). Only 5/16 (31.2%) were CD34neg, of which 4/5 were CD117 strongly positive. Also, 5/16 (31.2%) were also CD117neg, but all (5/5) showed at least partial CD34 positivity, suggesting immaturity of the blast cell. Only one case (1/16, 6.2%) was HLA-DRneg, while only 2/16 (12.5%) were CD33neg. All but one cases (which had CD71strong positivity, fulfilling criteria for pure erythroid leukemia) were CD71weak, while 12/16 (75%) were MPOneg. Moreover, there were three CD38neg cases (18.8%), all of which were CD34pos (leukemic stem cell phenotype), and only 3/16 (18.8%) were CD123neg. Interestingly, a subgroup of cases (9/14, 64.3%) was distinguished with the common characteristic of a very pronounced CD25 positivity, while among six of them with an available molecular profile, 5/6 (83.3%) were FLT3-ITD mutated. Also, all nine cases appeared with type I blasts, while none of them had erythroid blast morphological features. Additionally, all nine cases were MPOneg, although 4/6 cases investigated, showed weak alpha-naphthyl-acetate esterase (ANAE) positivity. Only (2/9) cases were classified as AML-MRC (secondary to MDS and MPN, respectively), while 7/9 were classified as M0/M1. Overall, apart from the erythroleukemia case, no other case showed CD41, CD42a and CD61 positivity, while 5/7 cases investigated (71.4%) were Glycophorin-A negative. Finally, there were no significant cytogenetic findings, except from three cases with isolated findings [−7, del(5q31), 3 × 11q23 & +13, 3 × 3q14 & −7, del(7q31)]. Conclusions: Most of CD36pos/CD64neg AL cases do not match immunophenotypically with monocytic leukemias. They exhibit morphological, cytochemical and molecular heterogeneity. However, a subgroup was distinguished with abnormally increased CD25 expression in a hierarchically immature blast cell, indicating the need for prospective investigation of its ontogenetic origin.
DIGITAL CHARACTERIZATION OF BLOOD SMEAR MORPHOLOGY UNDER DIFFERENT FIXATION CONDITIONS
Hajimu Kawakami, Hirokazu Kurata
Sysmex Corporation 4-4-4 Takatsukadai, Nishi-ku, Kobe, Japan
Introduction: The morphology of blood cells is largely influenced by the methods of smear slide preparation, especially drying conditions. Traditionally, natural drying method has been used in many western countries, while forced-air drying has been applied in some Asian countries. The former creates differential shrinking patterns depending on cell subtypes, leading to the clear discrimination between lymphocytes and monocytes, as well as the identification of hairy cells and others. In contrast, the latter creates well-elongated shapes of cells, enabling the identification of intra-cellular organelles and the evaluation of their color tones. In this study, we analyzed the cell images, using our digital morphology algorithm, and identified the differences in specific features under the two conditions. Methods: Smear slides of six normal adult peripheral blood samples were prepared under (A) forced air drying and (B) naturally drying conditions (room temperature, moisture 50%), and stained with May-Giemsa stain. The cell images were taken with DI-60 (Syodssmex Corporation), and analyzed for ninety-four parameters critical for cellular discrimination, including (1) areas of cellular and nuclear regions, N/C ratio, imaginary diameters of cells and nucleus, (2) cellular roundness (circularity), (3) color tones of nuclear and cytoplasmic areas, chromatin aggregation pattern, quantities of granules and vacuoles, and so forth. Results: The ratios of mean parameters under (A) forced-air drying to (B) natural drying conditions, were as follows (neutrophils, lymphocytes, and monocytes, respectively); (1) cellular diameter (110.7%, 115.0%, 124.0%), N/C ratio (95.2%, 91.3%, 80.6%), area of cytoplasmic region (126.5%, 193.3%, 199.1%), and (2) cellular roundness (87.6%, 93.0%, 84.3%). These indicate that forced-air drying may lead to increased cellular diameter and cytoplasmic area, as well as decreased N/C ratio and circularity, with marked increase in cytoplasmic areas of lymphocytes and monocytes as compared with that of neutrophils. Moreover, natural drying may lead to increased cellular roundness, especially in lymphocytes and monocytes. The color tones of both nucleus and cytoplasm (including chromatin and granules) were denser in (B) than in (A). Conclusions: This study realized the quantification of various blood cell image features, by using our digital morphology algorithm, and revealed the clear differences in cell image parameters between the two drying conditions. These results may contribute to the standardization of smear preparation and cell image analyses.
USING AI TO GENERATE PEPTIDE THERAPEUTICS AGAINST THE VWF-GP1B & ALPHA; INTERACTION
Thomas DD Kazmirchuk1, Maha Othman2,3,4, Ashkan Golshani1
1Department of Biology and the Ottawa Institute of Systems Biology, Faculty of Science, Carleton University Ottawa, ON, Canada, 2Department of Biomedical and Molecular Sciences, Faculty of Medicine, Queen's University Kingston, ON, Canada, 3School of Baccalaureate Nursing, St. Lawrence College Kingston, ON, Canada, 4Clinical Pathology Department, Faculty of Medicine, Mansoura University Mansoura, Egypt
Introduction: Platelet glycoprotein-1b alpha (GP1bα) is a surface glycoprotein that is functionally defective in platelet-type von Willebrand disease (PT-VWD), which is characterized by gain-of-function mutations within the β-sheet thereby converting GP1bα to an open conformation. This results in the excessive association of GP1bα with its receptor von Willebrand clotting factor (VWF), counterintuitively leading to a bleeding phenotype in PT-VWD patients. The β-sheet mutations (clustered within the Trp230–Met239 window) therefore represent an attractive site to develop peptide therapeutics. Recently, we developed the In-Silico Protein Synthesizer (InSiPS), which is a computational tool that intelligently designs small peptides to interfere with important protein-protein interactions (PPIs). Thus, we used InSiPS to generate small peptides against the GP1bα-VWF interaction. Methods: We first used InSiPS to generate a peptide candidate list specific to GP1bα. InSiPS is a genetic algorithm developed around co-occurring protein motifs that mediate PPIs. It is a closed system that generates small peptides with a given interaction profile. The resulting peptides can bind to specific regions of a target protein while also avoiding interactions with a set of predefined, non-target proteins. These peptides are constantly improved through a cycle of evaluating and mutating an initial pool of sequences. After generating a ranked-list of peptide candidates that specifically target GP1bα, we took the top five-scoring peptides and performed a combination of in-silico docking experiments and in-vitro binding assays. Results: We have generated five peptides that are specific to GP1bα. The interaction between some of these peptides and GP1bα were further confirmed in-silico using AlphaFold2. Our preliminary in-vitro data confirms the interaction between some of these peptides and GP1bα. We will further evaluate the ability of these peptides to interfere with the interaction between GP1bα and VWF. Conclusions: We conclude that InSiPS is a suitable tool to develop small peptides against pharmaceutically important targets, such as GP1bα. Future work will focus on testing the efficacy of these peptides against GP1bα in a mammalian system.
ANEMIA IN DEVELOPING COUNTRIES: CHALLENGES AND PERSPECTIVES
Saleem Khan
National University of Medical Sciences, Islamabad
Anemia is a condition in which the number of red blood cells or their oxygen carrying capacity is insufficient to meet the physiological needs; which may vary for the age, sex, altitude, smoking and pregnancy. Anemia is a major public health problem worldwide, especially in developing countries in Western and Central Africa and South Asia. Beside ill health, anemia is associated with poor cognitive and motor development in children and work capacity in adults, influencing economic development of country. Physical and cognitive losses due to anemia costs the developing countries up to 4.5% loss in GDP per annum.
According to WHO, about 1.8 billion people of the world are suffering from anemia and its prevalence is five times higher in low and middle income countries. Asia and Africa account for 85% of the absolute burden of anemia in high risk groups. The most vulnerable group is children below the age of 5 years and females in their reproductive years. In 2019, global anemia prevalence in women of reproductive age group (15–49 years) was 29.6% in non-pregnant and 36.5% in pregnant women. Similarly, in 2019, global anemia prevalence was 39.8% in children aged 6–59 months: the highest being in the African region (60.2%). The developing countries having the highest burden of anemia in Africa are Zambia, Mali, Congo, Nigeria, Senegal, Sierra Leone, Chad, Tonga and Burkina Faso. Similarly, among the Asian countries, the higher prevalence of anemia is seen in Yemen, Afghanistan, India, Bangladesh, Pakistan, Nepal, Burma, Kazakhstan, and Cambodia.
Anemia can be caused by nutrition-specific factors (e.g., due to insufficient intake or poor absorption of micronutrients), non-nutritional factors, or a combination of both. In developing countries, each of these factors has social determinants as well. Non-nutritional causes of anemia include malaria, worm infestation, chronic renal failure, endocrine disorders, genetic hemoglobin disorders, vitamin A deficiency and chronic inflammatory disorders. Among nutritional factors, iron deficiency is the most common cause of anemia. Iron deficiency is present in approximately a quarter to half of children aged 6–59 months and women aged 15–49 years with anemia. The lower proportion of anemia cases associated with iron deficiency is likely in populations with a high burden of anemia and infections.
Anemia prevention and control strategies include improved dietary intake and increased food diversity with increased iron bioavailability. The targeted fortification of foods for high-risk groups and iron (and folic acid) supplementation (tablets, powders, spreads) for children and adolescents are quite beneficial. However, barriers exist regarding the dissemination and uptake of these programs, including insufficient priority, lack of knowledge and education around anemia prevention, and the difficulty in meeting the needs of high-risk groups at specific times in their lives.
Although the age standardized point prevalence and Years Lived with Disability (YLD) rates due to anemia decreased from 1990 to 2019, its burden remains high, particularly in less developed countries. Despite the observed improvement in anemia, prevalence remains high in the poorest regions in the world, presenting an obstacle to reducing maternal and neonatal mortality, as well as promoting healthy early childhood development and improving school performance and work productivity. Further reductions in anemia prevalence are likely to require a combination of programs that address the infectious and nutritional determinants.
In 2012, the 65th World Health Assembly (WHA) approved commitment to halve anemia prevalence in women of reproductive age by 2025. WHO and UNICEF extended this target to 2030 to align with UN sustainable development goals (SGDs). In 2020, the prevalence of anemia in women aged 15–49 years was added as indicator 2.2.3 of SGDs. This is a global commitment but to be effective at country level a targeted campaign with regular evaluation and monitoring is required. Overcoming bureaucratic, operational, and technical barriers to anemia control will foster more effective implementation of policies sand strategies. Moreover, effectively addressing anemia in all its forms requires a firm understanding of the unique determinants of anemia in a particular setting in relation to its cultural, religious and social norms. The prevention of anemia should continue to be supported, encouraged and adopted to achieve the targets.
MOLECULAR MUTATION PROFILING OF PATIENTS WITH SUSPECTED MYELODYSPLASTIC SYNDROMES USING NEXT GENERATION SEQUENCING–A SINGLE CENTRE EXPERIENCE
Si Jie Khoo, Gee Fung How, Melvin Fuxun Ong, Charles Chuah, Zhentang Lao, Chuen Wen Tan, Hein Than
Department of Haematology, Singapore General Hospital Singapore, Singapore
Introduction: Myelodysplastic syndrome (MDS) is a spectrum of clonal stem cell disorders characterized by haematopoietic cell dysplasia with predisposition for leukaemic transformation. The WHO 2022 classification reorganizes MDS categories by emphasizing cytogenetics and mutations. Next generation sequencing (NGS) is a powerful tool to consolidate genetic profile of multiple biomarkers into a single test across multiple samples. With NGS incorporated into the diagnosis of MDS, we can comprehensively identify MDS-associated genetic variants involving tumor suppressor, transcription factors, signaling factors and epigenetic pathways. Methods: Diagnostic bone marrow/blood samples received between November 2021 and December 2022 from 95 patients with suspected MDS were included. The extracted DNA and RNA were amplified using the OncomineTM Myeloid Research assay to interrogate 40 DNA genes and 29 fusion driver genes associated with myeloid malignancies. NGS libraries were sequenced using the Ion PGM and S5 system, and the data was analyzed using in-house bioinformatics pipelines and ion reporter software. Somatic genetic alterations including point mutations, indels and fusions were consolidated, and their association with patients' demographics, bone marrow morphology, karyotyping and fluorescence in situ hybridization (FISH) findings was determined using Fisher's exact test and Wilcoxon rank-sum test. Results: The median age was 70 years (range, 24–90). A total of 143 point mutations and indels in 28 different genes, and 1 fusion transcript were identified. Mutations in TET2, TP53, U2AF1, ASXL1, DNMT3A, SF3B1, SRSF2 and RUNX1 were frequently reported. 72 out of 95 patients (75.8%) showed one or more somatic mutations and/or cytogenetic abnormalities. At least one driver mutation was identified in 69.5% of the patients. Of the 55 patients with normal cytogenetics or unavailable karyotype/FISH results, 32 had somatic variants identified by NGS. The presence of somatic mutations and the number of mutations were significantly associated with the presence of MDS-defining cytogenetic alterations (p = 0.003 and p = 0.001 respectively). No significant associations were found between the number of somatic variants and the age or gender of the patients. Conclusions MDS is genetically complex and highly heterogeneous in clinical presentation and molecular/cytogenetics profile. Integration of NGS panels in the diagnosis of MDS, in addition to morphology, aids in accurate classification, prognostication and determination of targeted therapy.
THE RELATION OF REGULATORY T CELLS AND LYMPHOCYTE SUBPOPULATION WITH TREATMENT RESPONSE AND SURVIVAL IN GASTRIC CANCER
Hyunjung Kim1, Hae Kyung Lee1, Der Sheng Sun2, Hye Sung Won2, Yoon Ho Ko2
1Department of Laboratory medicine, College of Medicine, The Catholic University of Korea Seoul, Korea, 2Internal Medicine, College of Medicine, The Catholic University of Korea Seoul, Korea
SCREENING OF MYELODYSPLASTIC SYNDROME USING CELL POPULATION DATA OBTAINED FROM AN AUTOMATIC HEMATOLOGY ANALYZER
Hyunjung Kim, Hey Kyung Lee, Yonggoo Kim
Department of Laboratory Medicine, College of Medicine, The Catholic University of Korea, Seoul, Korea
[Background] It is a long-standing goal to obtain accurate diagnostic clues of myelodysplastic syndrome (MDS) by detecting PB abnormalities using an automated analyzer. This study evaluated the diagnostic utility of complete blood cell (CBC) and automated cell population data (CPD) parameters of Sysmex XN analyzer (Sysmex Corporation, Kobe, Japan), especially information about morphology of neutrophils and monocytes, to screen MDS using PB [Methods] The hematology automated analyzer Sysmex XN-1500 were used and neutrophil-FSC (NEFSC), neutrophil-SSC (NESSC), neutrophil-SFL (NESFL), monocyte-FSC (MOFSC) and monocyte-SSC (MOSSC) and other CPD were analyzed. Dysplastic neutrophil was defined by microscopic findings including nuclear hypolobulation, hypersegmentation, bizarre lobulation, clumping, cytoplasmic hypogranularity and pseudo-Chediak-Higashi granules and small size. [Results] A total of 390 participants were enrolled (63 with MDS and 327 as controls; mean age, 51.6 years) during May and July 2018. The number of the sub-classification of MDS in this study were as follows: MDS with single lineage dysplasia (n = 1), MDS with multi-lineage dysplasia (n = 14), MDS with excess blasts (n = 47), and unclassifiable MDS (n = 1). In multiple regression analysis, RBC count (p = 0.0001), platelet count (p = 0.0001), NEFSC (p = 0.0002), NESSC (p = 0.0138), QFlag(Blasts) (p = 0.0002), PB-blast(%)(p = 0.0002) and IPF count (p = 0.0002) were independently associated with MDS. The area under curve (AUC) for RBC count (0.942), platelet count (0.881), NESSC (0.876), and NEFSC (0.865) showed higher diagnostic power with acceptable sensitivity and specificity in receiver operation characteristic curves (ROC) analysis. When using combinations of ‘NESSC and NEFSC and RBC count and platelet count, the positive predictive value (PPV) markedly increased to 100.0% (100%), however, the sensitivity decreased to 50.8%. Overall, if combination criteria satisfying one of four CPD cut-off criteria were used, all 64 MDS patients could be detected (sensitivity 100%). [Conclusion] This study demonstrates that CPD representing cell volume (decreased NEFSC) and complexity of neutrophils (decreased NESSC) may be useful for screening MDS using PB. The existing known markers, low RBC count and platelet count showed highest diagnostic efficiency in screening MDS. The combination of these four markers markedly improved sensitivity of MDS detection. These parameters are convenient and objective markers obtained from the automated analyzer with the CBC test. This could help to suspect the presence of MDS rapidly without additional cost.
VALIDATION OF THE INTERNATIONAL CONSENSUS GROUP CRITERIA FOR SLIDE REVIEW FOLLOWING AUTOMATED COMPLETE BLOOD COUNT
Girum Kiya1, Aklilu Mamo1, Sintayehu Biya1, Dejene Gobena1, Nathal Demeke2, Tilahun Yemane1
1School of Medical Laboratory Science, Health Institute, Jimma University Jimma, Ethiopia, 2Jimma Medical Center, Jimma University Jimma, Ethiopia
WHOLE GENOME SEQUENCING IDENTIFIES A 58.9 KB SEGMENTAL DUPLICATED REGION ENCOMPASSING THE α GLOBIN GENE CLUSTER WITHOUT THE CONSERVED REGULATORY ELEMENT HS-40
Tamara T Koopmann1, Jeroen Knijnenburg1, Sabine Heber2, Saskia Herbst2, Elisabeth Ohmann2, Cees L Harteveld1
1Department of Clinical Genetics, Leiden University Medical Center Leiden, Netherlands, 2Labor Staber, Medizinisches Versorgungszentrum für Humangenetik Regensburg, Germany
Introduction:–After the introduction of MLPA as a standard tool in molecular diagnostics for thalassemia, a variety of cases emerged to have duplications of the complete α-gene cluster, including the conserved regulatory element HS-40. Increased α-globin synthesis leading to chain imbalance can have an aggravating effect in carriers of β-thalassemia variants by converting a typically asymptomatic carrier state into a thalassemia intermedia. Methods and Results–Here we describe a 58.9 kb segmental duplication of the entire α-globin gene cluster in a patient with low/borderline hemoglobin (10.4–11.7) while having normal ferritin and iron parameters. This finding was found using standard MLPA and was confirmed with and investigated further using CNV analysis from PCR free whole genome sequencing data. Breakpoint analysis shows a tandemly oriented local duplication, but with a probable inversion of only the duplicated HBZ gene in the duplicated gene cluster, thus suggesting a more complex rearrangement. Interestingly, HS-40 is not involved in the duplication, in contrast to most segmental duplication cases known from literature. Additional breakpoint PCR and Sanger sequencing will follow to confirm these findings. Conclusion–Segmental duplications of the entire α-globin gene in general have no effect on the hematology in carriers, as is the case in our patient. It remains unclear how this duplication affects the α-gene expression as the HS-40 is quite remote from the α-genes in the duplicated segment. One explanation could be that HS-40 divides its function over the duplicated clusters, resulting in equally distributed α-gene expression. Further studies need to be done to understand how the expression of the duplicated two α-genes is regulated.
THE EFFECTS OF HEMOGLOBIN C OR S CARRIER STATUS ON OSMOTIC GRADIENT EKTACYTOMETRY
Jennifer B Korpik1, Yasmin El Gammal2, Cesar M Rueda1, Tammy M Ward1, Miya M Lu1, Ellie T Fisk1, Charles T Quinn1,2, Theodosia A Kalfa1,2
1Erythrocyte Diagnostic Laboratory, Cancer and Blood Diseases Institute, Cincinnati Children's Hospital Medical Center Cincinnati, OH, USA, 2Division of Hematology, Cincinnati Children's Hospital Medical Center Cincinnati, OH, USA
PLATELET FUNCTIONAL ACTIVITY IN PATIENTS WITH PH-NEGATIVE MYELOPROLIFERATIVE NEOPLASMS
Natmors Analia Korsakova, Olga Golovina, Lana Tarkovskaya, Tatiana Morozova, Olesya Matvienko, Natalia Silina
Russian Research Institute of Hematology and Transfusiology Saint-Petersburg, Russia
APTT-CWA CAN DISTINGUISH LUPUS ANTICOAGULANT POSITIVE SAMPLES FROM HEMOPHILIA A NON-INHIBITORS AND HEMOPHILIA A WITH INHIBITOR SAMPLES
Narender Kumar1, Nithye Parvathy2, Jasmina Ahluwalia1, Chander Hans1, Priya Punj1, Varun Dhir3, Surjit Singh4
1Department of Hematology, PGIMER Chandigarh, India, 2Department of Pathology, PGIMER Chandigarh, India, 3Department of Internal Medicine, PGIMER Chandigarh, India, 4Department of Pediatrics, PGIMER Chandigarh, India
AUTOMATED IMAGE ANALYSIS IN SUPPORT OF ANTI-MALARIAL DRUG DEVELOPMENT
Jonathan D Kurtis
Center for International Health Research, Rhode Island Hospital, Brown University Medical School, Providence, RI, USA
LABORATORY TESTING IN THE NEW ERA OF CLASSIFICATIONS
Jason Kurzer
Stanford University, USA
The World Health Organization (WHO) and International Consensus Classification (ICC) recently updated their classification systems for myeloid neoplasms, including acute myeloid leukemia (AML) and myelodysplastic syndrome (MDS), as well as lymphoid neoplasms, including high grade B-cell lymphoma. These updates have significant implications for the diagnosis and management of these diseases, and molecular laboratory testing plays a crucial role in identifying specific genetic mutations that inform treatment decisions. In this talk, we will discuss the implications for laboratory testing and how to navigate the subtle differences between the two systems. We will review the specific genetic mutations that are associated with a subset of these diseases, including those that are now included in the updated classification systems, and discuss the latest laboratory techniques for detecting these mutations. We will also discuss the challenges associated with implementing these updates in clinical practice and the need for continued research to refine and improve molecular laboratory testing, particularly at the boundaries of AML and MDS. This talk will be of interest to clinicians, laboratory professionals, and researchers who are involved in the diagnosis and treatment of hematopoietic neoplasia.
UNDERSTANDING THE UNDERLYING BIOLOGY FOR SUCCESSFUL TREATMENT OF HOMOZYGOUS ALPHA THALASSEMIA (A-THALASSEMIA MAJOR): AN EXAMPLE CASE
M Karen Lazarus1,2, Amy Chadburn1,3
1New York Presbyterian Hospital, Weill Cornell Campus New York, NY, USA, 2Marist College Poughkeepsie, NY, USA, 3Cornell Medical College New York, NY, USA
Introduction: The genetic loss of all four alpha chains (homozygous a0thalassemia; genotype: –/–) results in a lack of alpha chain synthesis, such that no hemoglobin A, A2 or F can be generated, and the clinical syndrome of Bart's hydrops fetalis. Bart's hydrops fetalis is seen most frequently in Southeast Asia, where alpha thalassemia is prevalent but has been described in other areas. Usually, it is incompatible with life, with death in utero or shortly after birth. Antenatal diagnosis offers the option for in-utero therapy, which can result in a healthy live birth. However, the method treatment impacts therapeutic response–both based on laboratory findings and clinical response. Methods/results: The patient, currently 27 years old, was diagnosed with alpha thalassemia major (--SEA/--SEA) at 12 weeks gestational age and subsequently underwent both intra-uterine stem cell transplant (father's CD34+ stemcells) and intra-uterine red cell transfusions. The patient was born at 35 weeks gestational age via C-section with an exchange transfusion on day 1. Bone marrow biopsy showed no engraftment of the paternal stem cells. Although his physical development was delayed, in part to due to growth hormone deficiency, his intellectual skills were unimpaired. After receiving straight transfusions for many years, in 2015 the patient was changed to exchange transfusions. However, he soon rejected exchange transfusions due to time constraints. He received single donor units at 1–3-week intervals. During this time his hemoglobin level approached 14 g/dL, hemoglobin H levels rose to 86%, and nRBC count increased to almost 400/100 WBC, all indicators of a hematopoietic response. The hypoxia due to Hemoglobin H's extremely high affinity for oxygen and the hemolytic effect of precipitated beta tetramers attached to the RBC membrane, contributed to this response. Approximately 6 months ago he resumed monthly exchange transfusions. His hemoglobin H levels are now <10%, and his last hemoglobin value is 11.5 g/dL with<10 nRBC/100 WBCseen on smear. Conclusion: The expected lifespan of a viable newborn with alpha thalassemia major no longer needs to be 2 weeks. With prenatal identification of parental carriers of alpha thalassemia trait, in utero diagnosis can lead to birth of a healthy infant whose life expectancy is now unknown.
RETICULOCYTE HAEMOGLOBIN EQUIVALENT (RET-HE) DOES NOT RELIABLY DIFFERENTIATE BETWEEN IRON DEFICIENCY ANAEMIA AND THALASSAEMIA TRAIT IN PAEDIATRIC PATIENTS
Kah Jing Lee, Soh Hong Ang, Joyce Ching Mei Lam
Haematology Laboratory, Department of Pathology and Laboratory Medicine, KK Women's and Children's Hospital Singapore, Singapore
CO-OCCURRING MUTATIONAL PATTERN IN BCR-ABL1-NEGATIVE MYELOPROLIFERATIVE NEOPLASMS
Young Kyung Lee, Sangkeun Park, Yonggeun Cho
Department of Laboratory Medicine, Hallym University College of Medicine & Hallym University Sacred Heart Hospital Anyang, Korea
Introduction: BCR-ABL1 negative myeloproliferative neoplasms (MPN) are characterized by the presence of driver mutations of JAK2, CALR, and MPL genes, which constitute diagnostic criteria. Recently, Next generation sequencing (NGS) enables to detect multiple genetic abnormalities but the effect of co-occurring mutations other than JAK2, CALR, and MPL genes remain unclear. In this study, we investigated the occurrence of co-occurring gene mutations and tried to figure out the impact of these genetic abnormalities on MPN. Methods: We retrospectively reviewed the NGS data of BCR-ABL1 negative MPN cases newly diagnosed from January 2021 to December 2022 in a university hospital. NGS was performed using gene panel of 108 genes associated with myeloid neoplasm. Total number of MPN was 28 cases: 7 polycythemia vera (PV), 16 essential thrombocythemia (ET), and 5 primary myelofibrosis (PMF). Results: Among 28 MPN cases, 18 cases (64.3%) had JAK2 mutation and two cases (7.1%) had CALR mutation and eight cases (28.6%) were triple-negative (TN). Co-occurring mutations were detected in 50.0% (14/28) of all MPN. There was no difference in the prevalence of co-occurring mutations between JAK2 mutation group and TN group (55.6% vs. 50.0%, p = 0.066). No co-occurring mutations were found in two CARL mutation-positive cases. Co-occurring mutations were present in 28.6% (2/7) of PV, 50.0% (8/16) of ET, and 80% (4/5) of PMF. The frequent mutations were TET2 (17.9%), DNMT3A, and MLLT3 (14.3% each), and ASXL1, SRSF2, and ZRSRS (7.1% each) in all MPN. TET2 (22.2% vs. 10.0%), DNMT3A (16.7% vs. 10.0%), and ASXL1 (11.1% vs. 0%) mutations tended to be more frequent in JAK2 mutation-positive group than TN group. Four (80%) out of five cases having TET2 mutation were ET, and SRSF2 mutations were only found in PMF Conclusions: Co-occurring mutations were found in more than half of all MPN cases and their prevalence was high in PMF and low in PV. TET2 mutations were frequent and mostly found in JAK2 mutation-positive ET cases. Although limited by the small number of cases studied, our results provide insight into the patterns of co-occurring mutations in MPN. Accumulation of data on co-occurring mutations will further strengthen the role of genetic abnormalities in clinical decision.
MODIFIED CHROMOGENIC ASSAY TO ASSESS APIXABAN ANTI-XA AFTER ADMINISTRATION OF ANDEXANET ALFA
Rachel R Leger, Julie I Tange, Dong Chen, Rajiv K Pruthi, Jansen Seheult
Mayo Clinic Rochester, MN, USA
EVALUATION OF RAL MCDH STAIN METANOL FREE IN CLINICAL LABORATORY
Alba Leis-Sestayo, Alicia MartÃnez-Iribarren, Pablo González-RodrÃguez, MH Abid, Xavier Tejedor-Ganduxé, Cristian Morales-Indiano
Medicine Laboratory Department. Hospital Universitari Germans Trias i Pujol, Badalona, Spain
AUTOMATED MACHINE LEARNING-BASED DIAGNOSIS AND MOLECULAR CHARACTERIZATION OF ACUTE LEUKEMIAS USING FLOW CYTOMETRY DATA
Joshua E Lewis1, Lee AD Cooper2, David L Jaye3, Olga Pozdnyakova1
1Department of Pathology, Brigham and Women's Hospital Boston, MA, USA, 2Department of Pathology, Northwestern University Chicago, IL, USA, 3Department of Pathology and Laboratory Medicine, Emory University Atlanta, GA, USA
Introduction: Current flow cytometric analysis of blood and bone marrow samples for the diagnosis of acute leukemias relies heavily on manual intervention in both the processing and analysis steps, introducing significant subjectivity into the resulting diagnosis and increasing diagnostic turn-around time. Additionally, concurrent molecular characterization of these samples via cytogenetics and targeted sequencing panels can take multiple days, thereby delaying patient diagnosis and treatment. Attention-based multi-instance learning models are machine learning models that can make accurate predictions and generate interpretable insights regarding the classification of a sample from multiple events/cells; while these models have been developed for anatomic pathology applications, they have yet to be applied to flow cytometry data. Methods: By utilizing 1820 flow cytometry samples from 2019 to 2022 at Brigham and Women's Hospital, we developed attention-based multi-instance machine learning models for automated diagnosis of acute leukemia, including differentiation of acute myeloid leukemia (AML) from B-lymphoblastic leukemia/lymphoma (B-ALL). Additionally, using concurrent cytogenetic and targeted sequencing data from 674 acute leukemia samples, machine learning models for prediction of molecular aberrancies from flow cytometry data were developed. Machine learning models were created using the TabNet deep learning architecture and VIME self-supervised training algorithm, which are state-of-the-art approaches towards machine learning from tabular data including flow cytometry data. Results: Attention-based multi-instance models demonstrated strong performance for the automated diagnosis of acute leukemia versus non-leukemia samples (AUROC 0.869), as well as the separation of AML from B-ALL samples (AUROC 0.971). These models also accurately predicted cytogenetic aberrancies among AML samples, including t(15;17);PML::RARA (AUROC 1.00), as well as mutations including NPM1 (AUROC 0.725). These models do not require any manual intervention including compensation or gating, and additionally provide quantitative scores for the relative importance of different flow cytometry events and markers for the diagnosis of a particular sample. These importance scores can be integrated into flow cytometry analysis software for visualization and interpretation by hematopathologists. Conclusions: In this study, we have demonstrated the capability of machine learning models to provide automated diagnoses of acute leukemia, as well as accurately predict cytogenetic and molecular aberrancies in blood and bone marrow samples using flow cytometry data. This automated workflow can significantly decrease diagnostic turn-around time and ultimately improve patient outcomes.
ARTIFICIAL INTELLIGENCE-BASED ONLINE PLATFORM ASSISTS BLOOD CELL MORPHOLOGY LEARNING: A MIXED-METHODS SEQUENTIAL EXPLANATORY DESIGNED RESEARCH
Jun Xun Li
First Affiliated Hospital, Sun Yatsen University, Guangzhou, China
HEALTH-RELATED QUALITY OF LIFE IN ACQUIRED APLASTIC ANEMIA: A CROSS-SECTIONAL SURVEY IN CHINA
Ping Li1, Jun Peng2, Zengjun Li1, Kun Ru1
1Shandong Cancer Hospital and Institute, Shandong First Medical University and Shandong Academy of Medical Sciences, Jinan, China, 2Qilu Hospital, Cheeloo College of Medicine, Shandong University, Jinan, China
A CONVOLUTIONAL NEURAL NETWORK-BASED QUANTITATIVE COMPLETE BLOOD COUNT SCATTERGRAM MAPPING FRAMEWORK PROMPTLY SCREENSACUTE PROMYELOCYTIC LEUKEMIA WITHHIGH SENSITIVITY
Hongyan Liao1, Yan Liu2, Qin Zheng1
1Department of Laboratory Medicine, West China Hospital, Sichuan University, Chengdu, China, 2College of Electrical engineering, Sichuan University, Chengdu, China
EVALUATION OF ARTIFICIAL INTELLIGENCE ASSISTED-BONE MARROW ASPIRATE DIFFERENTIALS FOR DIAGNOSING HEMATOLOGICAL DISORDERS
Zhengchun Lu1, Yunpeng E Lyu1, Andrew Gao1, Tyler S Yeager1, Sophia Wang2, Alan Wang2, Guang Fan1
1Department of Pathology & Laboratory Medicine, Oregon Health & Science University Portland, OR, USA, 2DeepCyto LLC West Linn, OR, USA
FASTER THAN GLASS: IMPLICATIONS AND OUTCOMES OF FULLY DIGITAL PATHOLOGY
Giovanni Lujan
The Ohio State University
EFFECTS OF ISOLATED CENTRAL NERVOUS SYSTEM INVOLVEMENT EVALUATED BY MULTIPARAMETER FLOW CYTOMETRY PRIOR TO ALLOGENEIC HEMATOPOIETIC CELL TRANSPLANTATION ON OUTCOMES IN ALL PATIENTS
Ling Ma, Yinjun Chang, Xiaojun Huang, Lanping Xu, Xiaohui Zhang, Yu Wang, Yuqian Sun, Chenhua Yan, Xiaodong Mo, Qian Jiang, Jin Lu, Hao Jiang, Kaiyan Liu, Yanking Liu
Peking University People's Hospital, Beijing
ANEMIAS ICUS, CCUS AND BEYOND
Yazan Madanat
UT Southwestern Medical Center
Older patients are more prone to develop anemia or mild cytopenias. For decades, little was understood about the etiology of these cytopenias in the setting of normal lab evaluation for vitamins /minerals and occasionally having normal bone marrow biopsies. Gene panel testing using next generation sequencing has shed insight into the presence of abnormal bone marrow clones carrying myeloid mutations without meeting criteria for a diagnosis of a myeloid neoplasm. In these presentation, we will cover various entities that involve clonal hematopoiesis, clonal cytopenia of undetermined significance (CCUS) and the current available prognostic tools that may aid in risk stratification, in addition to treatment options for those patients.
A NOVEL METHOD TO DIFFERENTIATE PLASMA SAMPLES FROM PATIENTS TREATED WITH EMICIZUMAB PROPHYLAXIS USING ACTIVATED PARTIAL THROMBOPLASTIN TIME-BASED CLOT WAVEFORM ANALYSIS
Yuka Maeda1, Naruto Shimonishi1,2, Kenichi Ogiwara2, Kengo Onishi3, Toshiki Kawabe3, Tomohisa Nishio3, Keiji Nogami 1
1Department of Pediatrics, Nara Medical University Nara Japan, 2The Course of Thrombosis and Hemostasis Molecular Pathology, Nara Medical University Nara Japan, 3SEKISUI MEDICAL CO., LTD. Tokyo Japan
Introduction; Emicizumab (Emi), a bispecific antibody for hemophilia (H)A treatment, mimics as a cofactor function of activated factor (F)VIII and improves hemostatic effects. In activated partial thromboplastin time (APTT) measurement, it is difficult to differentiate Emi-treated patients from other patients based on the clotting times. If it can be presented as an Emi-contained plasma sample in the routine APTT measurement, it should be very helpful in the early detection of the appearance of anti-Emi antibodies and in the emergent treatment of Emi-treated patients under unconsciousness condition. The purpose of this study was to differentiate Emi-containing samples using APTT-based clot waveform analysis. Methods; Coagpia APTT-N and CP3000TM (SEKISUI MEDICAL CO., LTD.) were used for APTT reagents and measurements. Total 69 patients in the Emi group (15 with and 54 without FVIII inhibitor; APTT 21.2-37.9 sec) and total 30 patients in control group [normal (10), congenital HA (1), acquired HA (4), HB (4), von Willebrand disease (3), FV deficient (4), Lupus anticoagulant (1) and others (3) within the reference range of APTT (24-39 sec)] were used. We applied two parameters "corrected Vmax × VmaxT" (corrected Vmax means the maximum velocity when the maximum value of the reaction curve is regarded as 100, and VmaxT means the time to reach the Vmax) and “R/L ratio” (L shows the time from 38% height of Vmax to reach Vmax, R shows the time to drop from Vmax to 38% height of Vmax). Differentiation was performed after SDI transformation of the parameter values of the Emi group using the mean and standard deviation of the control group. Results; Maximum velocity (Vmax) decreased in the Emi group compared to the control group. The Emi and control groups could be differentiated with 100% sensitivity and specificity using the "corrected Vmax x Vmax T (cut-off value: 1.8)" and "R/L ratio (cut-off value: 2.7)", Conclusions; We successfully differentiated the presence of all Emi-contained samples by using APTT-based clot waveform analysis. This method is expected to enable detection of Emi-treated HA patients' samples quickly in routine APTT measurement.
GLUCOSE-6-PHOSPHATE DEHYDROGENASE DEFICIENCY: FAMILY CASE REPORT
Bello Rego Marta1, Natali Augusto Octavio2, Leire Sãiz Sierra2, Anna Marull Arnall2,3, Orlando Jimã‰Nez Romero2,3, Maite Serrando Querol2,3
1hospital Meixoeiro Vigo, Spain, 2laboratori Clinic Territorial ICS-IAS Girona, Spain, 3Group Neoma Facultat Medicina UDG Girona, Spain
OPTIMIZING ISLH LYMPHOCYTOSIS AND MONOCYTOSIS THRESHOLDS FOR MANUAL DIFFERENTIAL SMEAR REVIEW IN THE PEDIATRIC SETTING
Dana Martin1, Megan Zoltowski2, Emily Williams2, Elizabeth Margolskee2
1Hospital of the University of Pennsylvania Philadelphia, PA, USA, 2Children's Hospital of Philadelphia Philadelphia, PA, USA
Introduction: At the Children's Hospital of Philadelphia, approximately 37% of automated CBC differentials reflex to a manual differential when the ISLH Consensus Guidelines are applied. ISLH guidelines were developed for adult patients, but certain disorders, such as small B-cell lymphoma, are vanishingly rare in pediatrics. Given the time and resources involved, a target under 25% manual differentials is desirable. Methods: We evaluated the frequency of flagging for monocytosis and lymphocytosis. Historical rule: If lymphocytes >7K, perform manual differential with 1 day window. If monocytes >3K, perform manual differential with 1 day window. Data was collected from the electronic medical record on the frequency of these flags, the total differential counts and manual differential counts performed for the four months surrounding the rule changes. Results: Lymphocytosis flag triggered 415 and 412 times in the months prior to the change. 80% were on children under 2 years of age. None of these children had lymphoid neoplasms. Therefore, we changed the rule from a threshold of 7 to 10 K with a 30 day lookback window. The flag was triggered 101 and 101 times in the months following the change. Monocytosis flag triggered 161 and 175 times in the months prior to the change. 50% were on children under 3 months of age. No children had clinically significant monocytosis. Therefore, we changed the rule from a threshold of 3 to 4 K with a 14 day lookback. The flag was triggered 38 and 31 times in the months following the change. After implementation of these rule changes, the frequency of lymphocytosis and monocytosis flags across all differentials performed decreased from 5.4% to 1.3%. The frequency of manual differentials did not change significantly (35.3%, 36.4% prior and 36.9%, 34% after the rule change). Conclusions: Pediatric hospitals serve a unique patient population which may warrant adjustment of the ISLH guidelines for manual differentials. Changes to individual flags will decrease the frequency at which they are triggered, however due to individual specimens triggering multiple flags, this may not decrease the frequency of manual differentials. Additional investigation is required to discover other rule changes that may decrease the time and resource burden of manual differentials without negatively impacting patient care.
COMPARISON OF LEUKOCYTE COUNT BY DIFFERENT TECHNOLOGIES IN INTERFERENTS' PRESENCE
A Martinez-Iribarren1, M Sorigué2, A Leis-Sestayo1, M Raya2, E Viñets2, C Morales-Indiano1
1Laboratory Medicine Department. Hospital Universitari Germans Trias i Pujol Badalona Spain, 2Hematology Department. Institut CatalÃs d’Oncologia. Hospital Universitari Germans Trias i Pujol Badalona Spain
NORMALIZATION OF PLATELET AGGREGATION IN QUEBEC PLATELET DISORDER DURING ANTIFIBRINOLYTIC THERAPY
Natalie Mathews1,2, Subia Tasneem1, Georges-Etienne Rivard3,4, Catherine, PM Hayward1,2,5
1Department of Pathology and Molecular Medicine, McMaster University Hamilton, ON, Canada, 2Hamilton Regional Laboratory Medicine Program Hamilton, ON, Canada, 3Division of Hematology-Oncology, Department of Pediatrics, CHU Sainte-Justine, Université de Montréal Montréal, QC, Canada, 4Department of Clinical Laboratory Medicine, OPTILAB Montréal-CHU Sainte-Justine, Université de Montréal Montréal, QC, Canada, 5Department of Medicine, McMaster University Hamilton, ON, Canada
Introduction: Quebec platelet disorder (QPD) is an autosomal dominant bleeding disorder with a platelet-dependent gain-of-function defect in fibrinolysis. The cause is a duplication mutation of PLAU, that repositions a downstream, megakaryocyte-specific enhancer element, resulting in a > 100-fold increase in PLAU expression during megakaryopoiesis. Many of the clinical and laboratory features of the disorder can now be attributed to this unique fibrinolytic defect. For example, the lower platelet counts in persons with QPD improve on antifibrinolytic therapy, and return to baseline about 10 days after therapy. A relationship between the fibrinolytic defect and the platelet aggregation abnormalities in QPD has not been established. Persons with QPD show reduced aggregation and/or an absent secondary aggregation wave with epinephrine, with or without additional aggregation defects (e.g., with ADP and/or collagen) that resemble the effects of alteplase and reteplase lytic therapy on human platelet function. We postulated that the impaired QPD platelet aggregation function is directly related to the QPD fibrinolytic defect and would normalize during prolonged antifibrinolytic therapy. Methods: A father and son with QPD (confirmed by molecular testing for the QPD PLAU duplication mutation) were retested for aggregation abnormalities during prolonged tranexamic acid therapy. Platelet aggregation records from studies done twelve to thirteen years earlier were reviewed for comparisons. The father was tested several years after stating combined tranexamic acid and apixaban to prevent recurrence of thromboembolic stroke with hemorrhagic evolution, complicating atrial fibrillation. His affected son was tested 10 days after restarting tranexamic acid treatment for a right hip hemarthrosis. Results: Initial light transmission platelet aggregation tests for both individuals showed maximal aggregation responses (MA) of 15%–16% (reference range: 9%–100%), and the characteristic, absent secondary wave with 6 μmol/L epinephrine. The son's first test also showed mildly reduced MA with 1.25 mg/mL ristocetin (68%; reference range: 75%–100%) without von Willebrand factor deficiency. During tranexamic acid treatment, both had a biphasic aggregation response to 6 μmol/L epinephrine that reached 86%–92% MA, and the son's aggregation with 1.25 mg/mL ristocetin was normal (MA: 85%). Conclusion: Antifibrinolytic therapy for QPD restores biphasic aggregation responses to epinephrine, illustrating that like QPD bleeding, wound healing problems, and lower platelet counts, QPD platelet aggregation findings are a direct consequence of the platelet/megakaryocyte gain-of-function defect in fibrinolysis that normalizes with antifibrinolytic therapy.
EFFECT OF ANTICOAGULANT PROPHYLAXIS ON MICROPARTICLE-ASSOCIATED THROMBIN GENERATION IN PATIENTS AFTER COVID-19
Olesia Matvienko, Olga Golovina, Natalia Korsakova, Natalia Silina, Olga Smirnova
Russian Research Institute of Hematology and Transfusiology, Saint-Petersburg, Russia
VALIDATION OF A MODIFIED FACTOR VIII ONE-STAGE CLOTTING ASSAY USING THE SIEMENS BCS®XP TO MEASURE EMICIZUMAB IN PLASMA
Steven J McBryant, William M Pickering, Mary M Robinson, Brian F Poirier
Colorado Coagulation, Labcorp Englewood, CO, USA
Introduction::Emicizumab (Hemlibra®, Genentech/Roche) is a bi-specific monoclonal antibody that acts as a surrogate for Factor VIII (FVIII), bridging activated Factor IX (FIXa) and Factor X (FX) to activate FX (FXa). Emicizumab treatment adjusted to body-weight has a predictable pro-coagulant response: routine monitoring is usually not required. In the instance of an unexpected bleeding event, and because of the expanding use of emicizumab worldwide, there is growing interest in availability of an assay to measure emicizumab levels. The aim of this study was to validate a modified One-Stage FVIII activated partial thromboplastin time (aPTT) assay to measure emicizumab in HA plasma. Methods: Emicizumab measured on the BCS®XP (Siemens Healthineers) used Dade® Actin® FSL (Siemens Healthineers) using emicizumab as a calibrator. The calibrator is assigned by r2 Diagnostics, Inc. versus a master calibrator tied to the manufacturers (Genentech) potency assignment. Calibrator dilution by the instrument generates a 7-point calibration curve (2.5–100 μg/mL). Samples were tested in duplicate at the standard 1:8 dilution or 1:20 in saline (0.9 g/L). Diluted samples were mixed with immuno-depleted FVIII deficient plasma and aPTT reagent, and incubated at 37°C for 3 min. With the addition of calcium chloride the clotting time was measured. Three quality control levels were used: 12.5, 25 and 75 μg/mL emicizumab. Intra- and inter-assay accuracy and precision were assessed at 80.0, 40.0, 10.0, and 5.0 μg/mL emicizumab. Carryover, reagent stability, dilution linearity, selectivity, interferences and sample stabilities were assessed. Results: Intra- and inter-assay accuracy and precision were within ±20% for all emicizumab concentration levels. Dilution linearity was demonstrated up to a 1:4 pre-dilution in FVIII deficient plasma, and allowed a reportable range of 5.0 to 360 μg/mL. Carryover was not observed when employing the intensive wash function on the analyzer. The aPTT reagent system was stable for 8 h on the instrument, and samples were stable up to 6 h on a cold block, 6 h on the instrument, and for up to three additional freeze-thaw cycles. Long term sample stability at −20 and −70°C was demonstrated at 1 month; testing is ongoing. Neither hemolysis, icterus (40 mg/dL) nor lipemia (1400 mg/dL) interfered with the assay. Selectivity was demonstrated in ten haemophilia A donor plasma at 5.0 and 80.0 μg/mL emicizumab. Conclusions: A modified aPTT assay using emicizumab-specific calibration was successfully validated using the automated BCS®XP platform. This assay is suitable for diagnostic laboratory measurement of emicizumab in citrated plasma.
SENSITIVITY AND SPECIFICITY OF HIGH FLUORESCENCE LYMPHOCYTE COUNT IN DENGUE INFECTION AND ITS CORRELATION WITH SEVERE DENGUE INFECTION MARKERS
Tandry Meriyanti1,2, Paramita 3
1Siloam Hospitals Lippo Village Banten, Indonesia, 2University of Pelita Harapan Banten, Indonesia, 3Siloam Hospitals Kelapa Dua Banten, Indonesia
Introduction: Dengue infection is a common cause of acute febrile illness in Indonesia and has a wide range of clinical presentations, from subclinical to fatal Dengue Shock Syndrome. Diagnosis of dengue infection can be established by serological test which detects antigen and/or antibody based on days of fever. Leukopenia and thrombocytopenia are frequent findings in dengue infection and can be laboratory markers of severe dengue infection in critical phase which usually occur on day 3 to day 7 of fever. High fluorescence lymphocyte count (HFLC) is a research parameter in Sysmex which correlates with the presence of blue plasma lymphocyte which is characteristic of dengue infectiosn. We aim to assess sensitivity and specificity of HFLC in patients with dengue infection based on serological tests and the correlation of HFLC with leukocyte and platelet count in dengue infection as markers of severe dengue infection. Methods: A cross sectional retrospective study was conducted during January – August 2022 at Siloam Hospitals Lippo Village, Indonesia. Full blood count and HFLC data from Sysmex XN-1000 were obtained for 302 samples which were serologically positive for non-structural 1 antigen (NS1) dengue (105 samples), positive dengue antibody (50 samples), positive dual antigen-antibody (47 samples), and seronegative samples as controls (150 samples). Statistical analysis of data was done by SPSS ver29. Results: On receiver operator characteristic (ROC) curve analysis, we find that cut off value of HFLC <0.35% has sensitivity 61.9% and specificity 54.7% for positive antigen group, cut off <3.2% has sensitivity 82% and specificity 98.7% for positive antibody group, and cut off <1.85% has sensitivity 83% and specificity 92% for positive dual antigen-antibody group. Further analysis revealed that there was significant negative correlation between HFLC and platelet count (Spearman's correlation coefficient −0.501, p < 0.001), but no significant correlation between HFLC and leukocyte count. Conclusions HFLC is a valuable tool in screening dengue infection especially in critical phase which is in conjunction with the time of dengue antibody detection. Furthermore HFLC can be used as additional data for monitoring the patient during the course of disease.
INITIAL EVALUATION OF MRX PT DOAC ASSAY FOR DETECTION OF CLINICALLY RELEVANT FACTOR XA INHIBITOR DRUG LEVELS
Siraj Mithoowani1,2, Karen A Moffat1,2,3, Stephen A Carlino3, Liselotte Onelov4, Mark A Crowther1,2
1Department of Medicine, McMaster University Hamilton, ON; 2Department of Pathology and Molecular Medicine, McMaster University Hamilton, ON; 3Hamilton Regional Laboratory Medicine Program Hamilton, ON; 4Nordic Biomarker Umea, Sweden
INITIAL EVALUATION OF AN ASSAY TO MEASURE THE FUNCTIONAL EFFECT OF DOACS IN A CLINICAL LABORATORY
Karen A Moffat1,2,3, Stephen A Carlino3, Siraj Mithoowani1,2, Liselotte Onelov4, Mark A Crowther1,2
1Department of Medicine, McMaster University Hamilton, ON; 2Department of Pathology and Molecular Medicine, McMaster University Hamilton, ON; 3Hamilton Regional Laboratory Medicine Program Hamilton, ON; 4Nordic Biomarker Umea, Sweden
Introduction: Direct oral anticoagulants (DOACs) are often prescribed in clinical practice. While routine monitoring is not recommended, some clinical situations may require a drug level. As specific drug levels are not routinely available, we evaluated the MRX PT DOAC assay as an alternative approach to measuring the functional effect of DOACs. The test principle is based on two prothrombin time (PT) assays run simultaneously, one DOAC-sensitive, the other DOAC-insensitive, and the clot time ratio (CTR) calculated. Our study aimed to evaluate the performance and feasibility of offering the assay in clinical laboratories. Methods: All reagents, calibrators and quality control (QC) were provided by Nordic Biomarker and are currently labelled Research Use Only (Umea, Sweden). Test protocols for DOAC-sensitive and DOAC-insensitive PT assays were programmed into ACLTOP 750 (Werfen, Bedford, MA). The DOAC-sensitive assay requires a 1:3 sample dilution, while the DOAC-insensitive assay has a final sample dilution is 1:21. Microsoft Excel (Redmond, WA) was used to calculate the CTR [DOAC-sensitive/DOAC insensitive results]. Our evaluation was limited to calibration, QC samples and individual normal donor plasma samples. Results: A single lot number of the reagent and QC material were tested. Following manufacturer direction, replicates of calibrators A, B and C determined acceptable ISI and normal clotting time (NCT) for the PT-DOAC insensitive assay, and the DOAC Sensitivity Index (DSI) and NCT for the PT-DOAC sensitive assay. Three levels of QC (low, normal and high (n = 11 per level)) had CTRs within manufacturer ranges. Individual normal donor plasma samples (n = 20) supported manufacturer CTR reference interval transference. Conclusions: Overall, the MRX PT DOAC performed well on the ACLTOP 750. A limitation of our study was that a single lot number of reagent was evaluated, and thus lot-to-lot variations were not assessed. Further study using patient samples on DOACs, other anticoagulants and interferences, such as lupus anticoagulant, are required. Calculating the CTR offline when run on ACLTOP analyzers is feasible for clinical laboratories.
PERFORMANCE EVALUATION OF MIXING STUDIES PRIOR TO FACTOR ASSAY
Bushra Moiz, Bushra Rizvi, Mahnoor Tahir, Anila Rashid
Aga Khan University Karachi, Pakistan
Introduction: Prolonged PT and APTT are often observed in patients having bleeding symptoms or during the pre-operative workup. To differentiate clotting factor deficiency from factor inhibitor or lupus anticoagulants, PT/APTT mixing studies are performed. There is no consensus in what is considered corrected vs. non-corrected studies. In this study, we compared different approaches of interpretation of mixing APTT studies and evaluate the added value of mixing studies in patients requiring factor assay. Methods: APTT-1:1mixing studies during Dec 2022 to Jan 2023 were analysed through various approaches for correction and compared with our own criteria defined as a clotting time below the upper reference interval (URI). The studies were performed on fully automated coagulation analyzer CS 2500 (Sysmex, Singapore) before and after 2-hour-incubation at 37°C using lupus-insensitive reagent. Results were correlated with the specific clotting factor deficiency and or inhibitors as well as with ‘parallelism'. Results: A total of 48 mixing tests were evaluable after excluding 6 tests that showed prolonged PT only. There were 36 males and 12 females with a median (IQR1-3) age of 6 (1–18) years. Thirty two patients had an isolated prolonged APTT while both PT and APTT were prolonged in 16 patients. Overall, mean(±SD) PT was 29.4 (±45.5) and APTT was 82.3 (±43.9) seconds. Immediate and post-incubation correction was observed in 46 of 48 samples (95.8%) and factor deficiencies identified were VIII (n = 25), V (n = 8), IX (n = 6), X (n = 5), XII (n = 2), XI and XII (n = 1), and fibrinogen (n − 1). Two patients with uncorrected APTT-mix were diagnosed with acquired haemophilia A and showed ‘non-parallelism'. Comparison of URI correction strategy in immediate and incubated tests respectively showed greatest discordance with approaches like ratio-comparison (24, 37%), 5-seconds difference (33,41%) as compared to Rosner index (RI) (6.5, 9%) and percentile correction (11, 13%). Increasing the cutoffs to 1.4, 10 seconds and 18 for APTT ratio, APTT-time-difference and RI respectively improves the sensitivity of these approaches in discriminating clotting factor deficiency from inhibitors. Conclusion: Correction based on URI, appropriately identified the clotting factor deficiency and the presence of inhibitors while Rosner Index showed the best correlation with our approach. Various techniques for interpretation of mixing studies gave variable results and can be improved by re-defining the cut-offs for correction by the laboratory.
COMPARATIVE STUDY OF THE BLAST FLAG PROVIDED BY MINDRAY BC 6800 PLUS AND ADVIA 2120I HEMATOLOGY ANALYZERS
Angel Molina, Judit Julian, Javier Laguna, Maria Rodriguez, Alexandra Casanova, Anna Merino
Core Laboratory. Biochemistry and Molecular Genetics Department. Biomedical Diagnostic Center, Hospital Clinic of Barcelona, Barcelona, Spain
PERIPHERAL BLOOD CELLS IMAGING GENERATION WITH DIFFUSION MODELS
Yefry Montcada1, Anna Merino2, José Rodellar3, Alexander Caicedo1,4, Santiago Alferez3
1Department of Electronics, Pontificia Universidad Javeriana Bogotá, Columbia, 2CORE Laboratory, Biochemistry and Molecular Genetics Department, Biomedical Diagnostic Center, Hospital Clinic, Barcelona, Spain, 3Department of Mathematics, Technical University of Catalonia Barcelona, Spain, 4Ressolve S.A.S Bogotá, Columbia
Introduction: The use of generative image models, specifically denoising diffusion probabilistic models (DDPMs), has gained significant interest in several applications. The improvements in diffusion model research have made DDPMs highly valued for their ability to generate high-quality and diverse samples. The purpose of this work is to augment existing data and compare it across eight types of peripheral blood (PB) cells using diffusion modelling techniques. Methods: PB smears were stained with May Grünwald-Giemsa and cell images were captured using the CellaVision DM96 analyzer. The data set, collected by our group and publicly available [1], comprises a diverse range of cell images including neutrophils eosinophils, basophils, lymphocytes, monocytes, immature granulocytes (metamyelocytes, myelocytes and promyelocytes), erythroblasts (NRBC) and platelets, with a total of 12 000 images. To balance the number of images of each type of cell, we used a total of 1000 images for each class. This set is divided into 70% for training, 10% for validation, and 20% for testing. The study employed a Diffusion Probabilistic Model, consisting of an autoencoder and a diffusion transition network, to remove noise from the data. The autoencoder compressed cell images into a latent space, which was then decoded back into the image space. A U-Net convolutional neural network was used to denoise the latent space and the autoencoder was frozen. The model generated synthetic samples for each cell type and was evaluated using 1600 images from the test set. The results showed the model's ability to reconstruct cell images effectively. Results: Using the test set, we use the Peak Signal Nosie Ratio (PNSR) metric to evaluate image reconstruction quality. In medical imaging a PSNR value above 25 is considered good, while a value above 30 is considered excellent. Fig. 1 shows some examples of the artificial generation of the PB cell images. The table in Fig. 1 shows that, eosinophils, basophils immature granulocytes and NRBC present higher PSNR values, preserving the relevant information in the images and reducing the amount of noise. Conclusion: We demonstrate the efficacy of using diffusion models in generating synthetic images of blood cells These models can help to significantly improve the accuracy of artificially generated images and contribute to improving the training of automatic recognition systems, particularly in cases of low-prevalence hematological diseases.
References
EVALUATION FOR CONVERGENCE OF THE TARGET ASSAY RANGE FOR FRESH BLOOD CALIBRATORS MEASURED BY LABORATORIES IN EXTERNAL QUALITY ASSURANCE SURVEY FOR LEUKOCYTE DIFFERENTIALS
Sayaka Mori1,2, Kazuto Tsuruda1,2,3, Katsunori Yanagihara2,4, Tomohiro Takeda1,5, Yutaka Nagai1,3,5, Kunihiko Takano6, Etsuko Ogawa7, Mai Yoshimura2, Yoko Yatabe8, Ryota Nakanishi9, kenji Yamade10, Kazumichi Matsumoto11, Hiroko Tanada12, Tohru Inaba13, Akiyoshi Takami3,14, Yutaka Yatomi15,16
1JSLH Standardization Sub-committee for Blood Cell Counting, Tokyo, Japan, 2Nagasaki University Hospital, Nagasaki, Japan, 3JSLH Standardization committee, Tokyo, Japan, 4Nagasakiken Medical Association, Nagasaki, Japan, 5Kansai University of Health Sciences, Osaka, Japan, 6Beckman Coulter, Tokyo, Japan, 7BD Biosciences, Tokyo, Japan, 8Keio University Hospital, Tokyo, Japan, 9Shiga University of Medical Science Hospital, Shiga, Japan, 10Kinki University Hospital, Osaka, Japan, 11University Hospital Kyoto Prefectural University of Medicine, Kyoto, Japan, 12Osaka Medical College Hospital Osaka, Japan, 13Kyoto Prefectural University of Medicine, Kyoto, Japan, 14Aichi Medical University, Nagakute, Aichi, Japan, 15 Japanese Society for Laboratory Hematology, Tokyo, Japan, 16The University of Tokyo, Tokyo, Japan
Introduction: The internationally recognized flow cytometry reference method for leukocyte differentials (RM-Diff) is established and used. It is important for practical use to confirm the convergence of the assay values for fresh blood calibrators measured by different laboratories. The Japanese Society of Laboratory Hematology (JSLH) executed assay value measurement in 12 laboratories to provide the target range for external quality assurance survey in Nagasaki prefecture. Methods: Fresh whole blood samples were collected from 2 healthy volunteers within blood bag containing CPDA solution, and EDTA-2K was added at a final concentration of 1.5 mg/mL. Aliquot volume (1.5 mL) of the samples were refrigerated and hand-delivered to each laboratory. The target assay ranges were determined by means of assay values measured by 13 flow cytometes (FACS CantoII 3, FACS Lyric 4, FACS Symphony 1 and Navios 5). The mean of three immunostaining tubes in three peripheral blood samples were used. The RM used the JSLH method which was validated by the ICSH method. All examiners were trained using the RM procedure provided by JSLH. The samples were measured within 24 h after drawing. Target assay values were determined by means of assay values, and the target assay ranges as allowance interval (AI) was determined from %Bias. %Bias was calculated by Intra-individual biological variation (CVI) and between individual biological variation (CVG). The CVI and the CVG were used values in the biological variation database by the European federation of clinical chemistry and laboratory medicine (EFLM-BV). %Bias was calculated by 0.25 x (CVG2 +CVI2)1/2). The convergence of the target assay range as analytical variation (CVA) was compared with CVI. Results: The AIs of sample A for %neutrophils, %lymphocytes, %monocytes, %eosinophils and % basophils were 52.93 (49.29–56.56), 39.18 (36.72–41.64), 4.74 (4.43–5.04), 1.74 (1.45–20.3) and 0.86 (0.80–0.92). The AIs of sample B for them were 62.97 (58.65–67.29), 28.53 (26.73–30.32), 5.45 (5.09–5.80), 1.27 (1.05–1.48) and 1.31 (1.21–1.40). All CVA were less than 0.5 CVI. Conclusion: The convergence of the assay values for fresh blood calibrators measured by different laboratories were within precision requirement of EFLM criteria of “desirable”. The AIs was determined by the mean of assay values and %Bias calculated CVI and CVG in the EFLM database.
VALIDATION OF THE SYSMEX XN "MONOCYTOSIS WORKFLOW OPTIMISATION" (MWO) APPLICATION AS A RELIABLE SCREENING TOOL FOR THE DETECTION OF NEOPLASTIC MONOCYTOSIS
Maida Navarrete, Carlos Palacio-Garcia, Laura Gallur, Julia Montoro, Silvia Saumell, Laura LÃ3pez, Ana MarÃn, Francesc Bosch
Department of Hematology, Hospital Universitari Vall d’Hebron, Vall d’Hebron. Instituto de OncologÃa (VHIO), Vall d’Hebron Barcelona Hospital Campus, Barcelona Barcelona, Spain
Introduction: Monocytosis is a frequent finding in hematology labs that often requires additional slide review under the optical microscope (OM). Owing to the great majority of monocytosis have a reactive origin an early and reliable method to identify neoplastic cases is of great interest, particularly for the diagnosis of chronic myelomonocytic leukemia (CMML). The MWO application is a new solution available in the Sysmex XN software aimed for the automated differentiation between reactive and neoplastic monocytosis. Aim: The goal of the present study was to evaluate the MWO application and to compare its results with OM and flow cytometry (FC) for the diagnosis of CMML. Methods: A MWO score was automatically calculated in the analyzers of XN9000 hematology line. A score <0.160 (−) considers the monocytosis as reactive, being automatically validated. By contrast, a score ≥ 0.160 (+) is suggestive of neoplastic monocytosis, therefore generating a blood smear for OM review. Two cohorts of samples were established: the first, used to validate the threshold score of MWO, was reviewed by OM for the presence or absence of dysplasia (OM+ and OM−, respectively). The second cohort was simultaneously studied by OM, MWO, and by flow cytometry (FC). Results: We studied 104 patients (65 males, median age 70 year [25–97] Among them, 77 were MWO− (76 OM− and 1 OM+) and 27 MWO+ (16 OM+ and 11 OM−). Using the cutoff of 0.160, MWO had a sensitivity and specificity of 94.1 and 87.4% respectively, negative predictive value 98.7%, and an accuracy of 88.5% for the detection of pathological (dysplastic?) monocytosis with an optimal cut-off of 0.16. The second cohort comprised 26 patients from the Hematology Day Care Unit. Correlation for monocyte count between the three methods (MWO, OM, and FC) was excellent: ICC = 0.8 (95%CI: 0.69–0.289). Five patients had an established diagnosis of CMML. In 4 of them (80%) MWO, OM and FC was concordant. In the remaining 21 patients, 12 (57%) were MWO+ of whom 7 (33%) had a FC suggesting CMML. Of note, median of MWO was higher in patients with CMML (MWO ≥ 0.787 vs. 0.201). Conclusions: MWO is an accurate method to differentiate pathologic from reactive monocytosis, potentially increasing the laboratory efficiency by reducing the number of smear reviews. Using a threshold >0.160, MWO was concordant with FC in 80% of cases with CMML. Larger studies are ongoing that will ascertain the utility of MWO in identifying pathological monocytosis.
AI IN FLOW CYTOMETRY
David Ng
University of Utah/ARUP Laboratories
This talk will focus on practical considerations in bringing machine learning to the clinical flow cytometry laboratory including development, validation, and maintenance of pipelines.
ACQUIRED HEMOPHILIA A: LABORATORY TESTING EXPERIENCE AT A REFERRAL CENTRE OVER 5 YEARS
Hamish Nicolson1,2, Rodrigo Onell1,2, Mohammad Bahmanyar1,2, Steven Wong1,2
1University of British Columbia Vancouver, BC, Canada, 2Department of Pathology, Saint Paul's Hospital Vancouver, BC, Canada
Introduction: Acquired hemophilia A (AHA) is a rare bleeding disorder caused by autoantibodies (inhibitors) directed against coagulation factor VIII (FVIII) [1]. The incidence is approximately 1 per million [2, 3]. Spontaneous bleeding is common and may be severe and life threatening [5], underscoring importance of prompt diagnosis. Because of its rarity, there is limited data pertaining to laboratory diagnosis of AHA. Methods: Saint Paul's Hospital (SPH) is the provincial referral center for special coagulation testing in British Columbia, Canada. Data was collected retrospectively from patient medical records. Diagnosis of AHA was made using a combination of clinical history, an isolated prolonged activated partial thromboplastin time (aPTT), aPTT mixing studies, decreased FVIII activity (one stage clot based method) and inhibitor detection using Bethesda method [6]. Results: Over a 5 year period (2018 and 2022) our laboratory received samples from 23 patients with an isolated prolonged aPTT that were diagnosed with AHA. Similar numbers of men and women were observed (48% female) with a median age of 76. At initial presentation, median hemoglobin was 98 g/L and median aPTT was 70 s (range 48 to 108 s) where aPTT was ≤50 s for 3 (13%) cases. Within 24 h of reporting first prolonged aPTT, interpretive comments for prolonged aPTT plus additional investigations (mixing study +/- Bethesda assay) were performed in 52% of cases, interpretative comments for prolonged aPTT only were issued in 26% cases and no interpretative comments, mixing studies, or other investigations were performed in 22% of cases. Ultimately, aPTT mixing study was performed in 91% of cases including a 1 h incubated mix in 81% of cases. Immediate mix showed no correction in 52% of cases, partial correction within 6–8 s of control in 38% of cases and correction within 5 s of control in 10% of cases. All cases showed some degree of prolongation after 1 h incubation. Mean prolongation was 21 s (range: 5 to 44 s) where 24% of cases showed prolongation <10 s. Median inhibitor and factor VIII levels were 43 Bethesda units (range: 1 to 1525) and 0.04% (range: <0.01 to 0.18), respectively. Median PTT at the time of Bethesda assay was 74 s (range 50 to >140). Five (22%) cases were originally identified during lupus anticoagulant testing. Conclusions: Laboratory testing is the cornerstone for diagnosis of AHA, yet timely identification remains a challenge. Laboratory data from this cases series highlights opportunities for improvement that we are hoping to implement provincially.
TOXIC MYELOPATHY: THE DARK SIDE OF THE HEMATOPOIETIC SYSTEM
Ligia Niero-Melo1, Ana Lucia Ippolito Carbonell2, Thomas de Souza Patto Marcondes1, Cristiano Claudino Oliveira3, Maria Aparecida Custodio Domingues4, Rafael Dezen Gaiolla1
1Hematology Department, Sao Paulo State University UNESP Botucatu, Brazil, 2HEMACORE–Hematology Center Sao Jose dos Campos, Brazil, 3Pathology Department, AC Camargo Cancer Center Sao Paulo, Brazil, 4Patology Department, Sao Paulo State University UNESP Botucatu, Brazil
APPROACH TO DETECTION OF ATYPICAL LYMPHOCYTES WITH DEEP LEARNING IN PERIPHERAL BLOOD SMEAR SCREENING CLINICAL APPLICATION POTENTIAL OF HEMATOLOGICAL MORPHOLOGY CLASSIFICATION AI MODEL
Hiroyuki Nozaka1, Sayaka Souma1, Shizuku Hirano1, Manabu Nakano1, Miyuki Fujioka1, Mihoko Kushibiki2, Shu Ogasawara2, Masahiro Ishiyama2, Kosuke Kamata3, Kazufumi Yamagata1,2
1Hirosaki University Graduate School of Health Sciences HIROSAKI, Japan, 2Hirosaki University Hospital HIROSAKI, Japan, 3Hirosaki University Graduate School of Medicine HIROSAKI, Japan
APPROACH TO DETECTION OF ABNORMAL LYMPHOCYTE WITH DEEP LEARNING IN PERIPHERAL BLOOD SMEAR SCREENING THE POTENTIAL OF AI TECHNOLOGY FOR ACUTE LYMPHOCYTIC LEUKEMIA IN HEMATOLOGICAL MORPHOLOGY ANALYSIS
Hiroyuki Nozaka1, Sayaka Souma1, Shizuku Hirano1, Manabu Nakano1, Miyuki Fujioka1, Mihoko Kushibiki2, Shu Ogasawara2, Masahiro Ishiyama2, Kosuke Kamata3, Kazufumi Yamagata1,2
1Hirosaki University Graduate School of Health Sciences Hirosaki, Japan, 2Hirosaki University Hospital Hirosaki, Japan, 3Hirosaki University Graduate School of Medicine Hirosaki, Japan
MOLECULAR INSIGHTS IN LYMPHOMA
Robert Ohgami
University of Utah/ARUP
Our understanding of lymphomas has deepened exponentially due to rapid advancements in molecular phenotyping. In particular, the accessibility and reproducibility of genomic profiling by next generation sequencing has allowed for hundreds of studies which support newer molecular classifications and prognostication systems for common and rare lymphoid neoplasms. Keeping up to date on relevant molecular advancements is challenging, but feasible. Here we will focus on specific areas which significantly overlap with practical current and near future application in lymphomas.
A CASE OF PERSISTENT POLYCLONAL B-CELL LYMPHOCYTOSIS
BM OLIVA1, C GARREFFA1, GM NICOLO'1, V LATELLA1, P IACOPINO2, B MODAFFERI1
1U.O.C. Laboratorio Analisi GOM REGGIO DI CALABRIA, Italy, 2Instituto Clinico "Prof. De Blasi" Reggio Di Calabria, Italy
TRENDS IN THE SEROPREVALENCE OF TRANSFUSION-TRANSMITTABLE INFECTIONS AND MINOR TRANSFUSION REACTIONS: A SINGLE INSTITUTIONAL 8-YEAR EXPERIENCE IN KENYA
Simon Onsongo
Aga Khan Hospital, Kisumu, Kisumu, Kenya
MOLECULAR GENETIC TESTING IN HEMOSTASIS AND THROMBOSIS (NOT FOCUS ON PLATELET DISORDERS)
Maha Othman
Queen's University, Canada
Inherited bleeding disorders are diagnosed primarily on the basis of hemostasis lab testing together with a bleeding phenotype which can vary in severity. However, a significant minority of patients with bleeding symptoms will remain without a definite diagnosis even after extensive hemostatic testing. These are referred to as bleeding disorders of unknown cause (BDUC). Molecular genetic testing aids diagnosis as it can confirm a phenotypic diagnosis, distinguish between disorders with similar bleeding phenotypes and provide important information in particular situations such as prenatal diagnosis and detection of the carrier states. Genome-wide approaches help identify novel genetic associations that may explain the cause of bleeding in the patients without established diagnoses. This talk will highlight the scope of genetic disorders of coagulation and the responsible genes, the purpose of genetic testing for coagulation disorders and available methods, the role of molecular genetic testing in common and rare disorders and finally the challenges with genetic testing for coagulation disorders and important considerations.
ESTABLISHING A MOLECULAR TESTING SERVICE WITH LIMITED RESOURCES
Swati Pai
Manipal Hospital Bangalore
Public health challenges including the SARS-CoV-2 pandemic have been instrumental in preparing low and middle income countries to set up molecular laboratories especially for PCR based assays.
These countries also carry a huge burden of hematological diseases like Chronic Myeloid Leukemia. There are various programs which offer free tyrosine kinase inhibitors to CML patients in the developing world, however, free or subsidised testing is not easliy available for evaluation of molecular response.
Despite financial and infrastructural constraints, resource limited countries must gear up to provide testing services for monitoring response to therapy for CML patients. This presentation shares our experience in setting up a PCR laboratory with bare minimum and at the same time continue to maintain all aspects of good laboratory practise.
PLASMA LEVELS OF DIRECT ORAL ANTICOAGULANTS ARE ASSOCIATED WITH LARGE ARTERY OCCLUSION IN PATIENTS WITH ACUTE ISCHEMIC STROKE
Suji Park1, Min-Sun Kwak1, Jae-Ryong Shim1, Dae-Hyun Kim2, Jin-Yeong Han1
1Department of Laboratory Medicine, Dong-A University College of Medicine Busan, Korea, 2Department of Neurology, Dong-A University College of Medicine Busan, Korea
Introduction: Direct oral anticoagulants (DOAC) medication in atrial fibrillation (AF) decreases risk of the development of ischemic stroke. However, larger thrombi might form under insufficient anticoagulation during DOAC therapy. The aim of the present study was to investigate whether plasma DOAC concentration at admission correlate with the presence of large cerebral artery occlusion (LAO) in acute ischemic stroke patients with AF taking DOAC. Methods: We enrolled all patients admitted with acute cerebral ischemia while taking rivaroxaban, apixaban or edoxaban for AF between March 2021 and May 2022. The site of arterial occlusion was evaluated by initial magnetic resonance angiography. Plasma levels of DOAC were measured using the calibrated Xa-activity and categorized into low (<100 ng/mL), or high (≥100 ng/mL). We analyzed plasma DOAC concentration in relation to occurrence of LAO using correlation and multivariable regression analyses. Results: Of the 38 patients with ischemic stroke on DOAC (median age = 76 years, interquartile range IQR = 69–79; median plasma DOAC concentration = 92.8, IQR = 29–171.2), acute LAO on admission was diagnosed in 14 patients and plasma DOAC levels were found to be low in 19 (50%) and high in 19 patients (50.0%). LAO were associated with lower plasma DOAC levels (low: 29 ng/mL, IQR = 29–93.3 vs. high: 162.8 ng/mL, IQR = 88.9–195.6; p = 0.001). Low DOAC plasma levels were an independent predictor of LAO (odds ratio, 7.33 [95% confidence interval (CI), 1.58–33.9]; p = 0.011). Plasma DOAC levels were associated with prothrombin time (Spearman rho = 0.548, p < 0.001) and activated partial thromboplastin time (Spearman rho = 0.489, p = 0.002). Conclusions: Lower DOAC plasma concentration was associated with increased risk of LAO in acute ischemic stroke patients with non-valvular atrial fibrillation taking DOAC.
NEONATAL SCREENING FOR HEMOGLOBINOPATHIES USING CAPILLARY ZONE ELECTROPHORESIS: COMPARISON WITH THE HIGH-PERFORMANCE LIQUID CHROMATOGRAPHY
Suji Park1, Jin-Yeong Han1, Hee Won Chueh2
1Department of Laboratory Medicine, Dong-A University College of Medicine Busan, South Korea, 2Department of Pediatrics, Dong-A University College of Medicine Busan, South Korea
Introduction: Current practice for laboratory investigation of hemoglobinopathies include automated complete blood count (CBC) and high-performance liquid chromatography (HPLC) or capillary electrophoresis (CE) for Hb (Hemoglobin)A2 and HbF measurement and detection of Hb variants. Capillary 3 OCTA(Sebia) is one of the popular tools for identifying hemoglobin variants. For neonatal cases, a dedicated reagent is required. However, several Institutions are conducting newborn hemoglobinopathies screening using Capillary 3 OCTA without the dedicated reagent, and there is no consensus for reference interval. The purposes of this study are to test and validate the Capillary 3 OCTA on EDTA samples and to establish a reference interval for neonatal HbF by Capillary 3 OCTA. Methods: Capillary 3 OCTA was evaluated for precision, carry-over and comparison. Also, 23 neonatal samples were separated and measured with Capillary 3 OCTA. The Capillary 3 OCTA requires HbA2 for measurement of HbA and HbF. Therefore, the newborn samples lacking HbA2 were progressed to an additional test, mixed with the normal control sample in a 1:1 ratio to provide HbA2. The reference interval of HbF was calculated by the value that processed without normal control. Results: With respect to the precision of Capillary 3 OCTA, the test results for low- and high- concentration control showed a coefficient of variation of less than 5%. HbF results for Capillary 3 OCTA and HPLC system Tosoh G11 showed a good correlation (R2 = 0.9984). There is a limit that reference interval for neonatal HbF has not been established in the Capillary 3 OCTA. The results demonstrated that the HbF mean value of 83.2% and SD 8.1%. The 95% confidence interval was 80.9% to 85.6%. Conclusion: The Capillary 3 OCTA demonstrated reliable analytical performance with good precision, carry-over and comparison results. In this study, we identified the Capillary 3 OCTA is reliable for screening test for hemoglobinopathy in newborn, especially useful in institutions that already had Capillary 3 OCTA for hemoglobinopathy.
A COMPARISON STUDY BETWEEN TWO HEMATOLOGY ANALYZERS: ATELLICA� HEMA 580 AND ADVIA� 2120I
Manuel Esteves Pereira3, Amrita Soni4, Kratika Gupta1, Nivedita Mitra1, Pratik Jariwala2
1Center for Innovation in Diagnostics, Siemens Healthcare Pvt Ltd, Bengaluru, India Bengaluru, India, 2Dr. Jariwala Laboratory & Diagnostics, Mumbai, India Mumbai, India, 3Siemens Healthcare Products GmbH, Marburg Germany Marburg, Germany, 4Siemens Healthcare Pvt Ltd, Mumbai, India Mumbai, India
DIGITAL ASSESSMENT OF PERIPHERAL BLOOD
Olga Pozdnyakova
Brigham and Women's Hospital, USA
Digitalization has become vital for many, if not all, clinical pathology operations spanning from a specimen collection to rendering a diagnosis. However, fully digital clinical pathology workflows are few and far between. This presentation will review the advantages and limitations of the current state of digital clinical hematology, with a specific focus on the novel technologies and AI-based algorithms that will enable full digitalization of peripheral blood smears. Digitalizaiton today leads to digital transformation tomorrow!
PRESENTATION ON BILL NICHOLS
Rajiv Pruthi
Mayo Clinic, Rochester
Dr William L. Nichols, MD was a hematologist at Mayo Clinic in Minnesota. His expertise was in clinical and laboratory evaluation and management of coagulation disorders particularly platelet disorders and von Willebrand disease. He had a national and international recognition as an expert in coagulation disorders and a unique ability to assimilate research findings into clinical practice and education; HIs ability to teach and simultaneously provide skilled clinical care was exemplary, he had a visionary leadership as chair of the Coagulation Diseases Group at Mayo Clinic and was very creative development of coagulation laboratory test panels to enhance care of patients with coagulation disorders. His firm commitment to the team based approach to patient care and his respect for each member of the team led to his being leading the International Hemophilia treatment centers (WFH) Mayo Clinic director. He mentored many younger colleagues in career growth. HIs academic accomplishments included leading the NHLBI sponsored effort on Diagnosis and Management of Von Willebrand disease. He is survived by his wife Sharon and children and grandchildren.
AUTOMATED MACHINE LEARNING & SYNTHETIC DATA APPLICATIONS IN MEDICINE
Hooman Rashidi
Cleveland Clinic
Several known obstacles in accessing medical data are directly tied to strict but understandably required regulatory restrictions within this space. HIPAA in the US and GDPR in the EU are in place to protect such patient privacy concerns and help prevent the abuse of sensitive data. Although these regulations are necessary, they also make it difficult for innovators and researchers to acquire and use such data in a timely manner to progress their quality studies and healthcare research.
Major advancements in machine learning have greatly moved forward the advent of synthetic data creation which will hopefully help overcome some of the aforementioned obstacles. The use of such synthetic data can drastically expedite certain research and quality studies within our healthcare arena. Synthetic data should not be confused with deidentified real data. As oppose to the deidentified real data that can be theoretically reidentified, synthetic data is entirely comprised of “new” data that does not represent any specific individual patient but rather their collective mathematical and statistical relationships. The final objective is a synthetic data that is able to mathematically and statistically approximate its real data counterpart and to test an idea for a given pilot study. The use of such data will not only dramatically expedite data access to the individual investigators but will markedly lower the entry barriers in healthcare research and innovation.
MOLECULAR DIAGNOSTIC UPDATE IN HEREDITARY HEMOLYTIC ANEMIAS
Anton Rets
University of Utah School of Medicine, ARUP Laboratories
Hereditary hemolytic anemia (HHA) is a heterogeneous group of disorders due to genetically caused defects in red blood cell membrane structure, enzymes, heme and globin synthesis, erythroid proliferation, and differentiation. Traditionally, the diagnostic process has been complex and included many tests from routine to highly specialized ones. A significant phenotypic overlap between different HHA types introduces even more complexity. The inclusion of molecular testing has significantly improved the diagnostic yield. As more molecular modalities become available for clinical use, it is imperative to understand their benefits and disadvantages pertaining to the HHA diagnostics. Re-evaluation of the traditional diagnostic workflow may also bring forth additional benefits. This presentation will focus on the current state of molecular testing for HHA and its place in the diagnostic workup.
UTILITY OF NEW ERYTHROCYTE INDICES IN THE ASSESSMENT OF ANEMIA OF CHRONIC DISEASES
Vicent Ribas Macias1,2, Anna Marull Arnall1,2, Leire Sãiz Sierra1,2, David Cruz Garcia3, Orlando Jimã‰Nez Romero1,2, Maite Serrando Querol1,2
1Laboratori Clinic Territorial ICS-IAS Girona, Spain, 2Group Neoma, Facultat De Medicina Girona, Spain, 3Institut Catal〠Oncologia Girona, Spain
Introduction: Iron deficiency anemia (IDA) and anemia of chronic diseases (ACD) are the two most prevalent anemia worldwide. On ACD, there is functional iron deficiency (ID) due to a key regulator, hepcidin. The presence of IDA in ACD patients can cause deleterious symptoms and must be supplemented. Since biochemical parameters are affected by inflammation, there is the need to find new indices to asses IDA in these patients. New erythrocyte indices are not influenced by this factor and are useful to diagnose ID status and monitor iron supplementation. Methods: We performed a cross-sectional study studying 124 anemic subjects. We studied differences among these anemic groups using Mann-Whitney and Kruskall-Wallis tests, considering a p < 0.05 to be statistically significant. Receiver operating characteristic analysis (ROC) curves and area under the curve (AUC) was calculated to obtain specific cut-offs for these parameters. Results: For Ret-He we propose a cut-off value of 30 pg to differentiate between ACD and ACD + IDA, with sensitivity of 88% and specificity of 75%, and an AUC of 0.899. For %Hypo He, we considered a cut-off value of 0, 35% with specificity of 72% and specificity of 75%, and an AUC of 0.798. For %MicroR we obtained a cut-off at 1.25% with specificity of 75% and specificity of 72%, and an AUC of 0.816. Discussion Ret-He showed the best performance and strong agreement was observed with other publications. For %Hypo He and %MicroR, we observed differences on cut- off values as we are studying ACD+IDA instead of just IDA or iron restricted erythropoiesis.
PLATELETS EXPRESS CONNEXIN 45 IN CO-LOCALIZATION WITH COXSACKIEVIRUS-ADENOVIRUS RECEPTORS WITHIN PLATELET AGGREGATES AND FILOPODIA
Elena Rimskaya1, Liudmila Buraychkovskaya1, Natalia Mironova1, Petr Chumachenko1, Maha Othman2,3,4
1National Medical Research Center of Cardiology named after academician E.I. Chazov Moscow, Russia, 2Department of Biomedical and Molecular Sciences, School of Medicine, Queen's University Kingston, ON, Canada, 3School of Baccalaureate Nursing, St Lawrence College Kingston, ON, Canada, 4Clinical Pathology Department, Faculty of Medicine, Mansoura University Mansoura, Egypt
THE FUTURE OF CONVENTIONAL FLOW CYTOMETRY
J Paul Robinson
Purdue University
Flow cytometry has been a critical tool in hematology for well over 40 years. In those 40 years, the hardware changed little from year to year, mostly in incremental steps. This established a long term very stable technology, that was produced by several companies creating an environment where manufacturers competed, but all produced quality instruments. In the world of clinical flow cytometry however, there was a slightly different pattern. Only a limited subset of manufacturers created clinical diagnostic instruments and they also matched these instruments with appropriate reagents. With the development of spectral cytometry however, the core clinical manufacturers have not yet produced spectral instruments. One spectral instrument manufacturer has gained approval for use in China and Europe, but it is unclear how this will develop in terms of an instrument-reagent combination. With spectral flow cytometry expanding rapidly, this opens up the question of what impact significant technology changes might have on clinical cytometry.
ROTATIONAL THROMBOELASTOMETRY (ROTEM)-BASED COAGULATION MANAGEMENT IN CARDIAC SURGERY
Isabel Rodriguez
Clinical Biochemistry Sevilla, Spain
ERYTHROCYTE PARAMETERS, FLAGGING, AND SCATTERPLOT PATTERNS IN SICKLE CELL DISEASE
Christine Rongey1, Lin Hong1, Fan Feng1, Sydney Silva1, Mehvish Ismael1, Albert Huisman2
1Abbott Santa Clara, CA, USA, 2University Medical Center Utrecht Netherlands
INTRODUCTION TO ALINITY H-SERIES SCATTERPLOTS FROM INTERESTING CASE STUDIES
Christine Rongey
Director of Scientific and Medical Affairs, Abbott
CLINICAL VALIDATION OF AN RT-PCR TEST FOR DETERMINATION OF THE ACKR1 DUFFY-NULL GENOTYPE IN PATIENTS WITH NEUTROPENIA
Cesar M. Rueda, Jennifer Korpik, Miya Lu, Tammy Ward, Ellie Fisk, Charles Klanke, Mary Reynaud, Theodosia Kalfa, Charles T. Quinn
Erythrocyte Diagnostic Laboratory, Cincinnati Children’s Hospital Medical Center Cincinnati, OH, USA
MAKING THE MOST OF OPERATIONAL INFORMATICS FOR YOUR LABORATORY
Jenna Rychert
ARUP Laboratories/University of Utah
Healthcare has become increasingly digital since the passage of the HITECH Act in 2009. As a result, there is a growing need to optimize healthcare IT to allow for the interoperable exchange of data. As a result, the Office of the National Coordinator for Health IT has implemented their Final Rule for the 21st Century Cures Act. This requires certified health IT systems to use modernized messaging standards for the safe and secure exchange of data within health information networks and also requires the use of terminology standards including LOINC, SNOMED, and UCUM for coding clinical and laboratory data. Given the critical importance of laboratory results in the delivery of healthcare, laboratorians must become familiar with these principles of interoperability. Their clinical laboratory expertise is needed to appropriately structure and code test results to safeguard against improper aggregation or misinterpretation by downstream users and systems.
THE ROLE FOR MOLECULAR DIAGNOSTIC TESTING IN HEMOGLOBIN DISORDERS
Daniel Sabath
University of Washington
MONITORING ALTERNATIVE ANTICOAGULANTS
Eric Salazar
UT Health San Antonio
The increasing use of anticoagulants other than traditional vitamin K antagonists has led to a growing interest in the clinical utility of laboratory monitoring to enhance safety and effectiveness. Particularly, while direct oral anticoagulants such (DOACs) such as factor Xa inhibitors (FXaIs) do not have a regulatory requirement for laboratory monitoring, the use of FXaI-specific anti-Xa concentrations has gained traction and has been advocated for several indications. The laboratory and clinical service can encounter several challenges in the decision to use specific monitoring assays for alternative anticoagulants, in their performance, and in their interpretation. This presentation will focus on clinical scenarios in which monitoring of alternative anticoagulants may be informative and, on the inherent challenges.
WHOLE SLIDE IMAGING SYSTEM IN HEMATOLOGY: A COMPARATIVE ANALYSIS OF TWO DIAGNOSTIC GROUPS, A QUALITY CONTROL YEARLY REVIEW
Marie A Salin, Ingrid Brezaniova
West Medica Produktions- und Handels- GmbH Wiener Neudorf, Austria
Introduction: Diagnostic in hematology is based on increasingly specific techniques of morphology analysis. The correct interpretation of the blood smears viewed under a microscope is crucial. Hematologists typically focus on red and white blood cells, so digital image techniques are valuable aids in their analysis. The differential counting of the cells provides invaluable information to pathologists for the diagnosis of many diseases when the manual counting of the cells is time-consuming, tiresome, and susceptible to error approach due to the tedious nature of this process. Methods: The objective of the present study was to compare the results obtained from the automated whole slide imaging system with the Vision Hema Clinical Application Module to the reference results reported by anonymous pathologists. The target values and diagnoses were determined by averaging the test results of peripheral blood samples from the same subjects, reported by independent participants. The comparison was made between the counts (%) of white blood cells, including neutrophils, eosinophils, basophils, monocytes, lymphocytes, blasts, promyelocytes, myelocytes, metamyelocytes, and plasma cells obtained from the automated whole slide imaging system and the reference values. Sensitivity and specificity were used to describe the accuracy of the examination. Additionally, the differential and/or lead diagnoses given by hematologists using the automated whole slide imaging system were compared to the reference diagnoses. The interpretation of diagnostically significant findings included an assessment of red blood cells' size, color, forms, and inclusions. Four cases, including those with cancer and parasitological findings, were evaluated by hematologists using ×50 and ×100 oil-immersion whole slide imaging scans. Results: The determination of the selected white blood cells was in the target range except for the lymphocytes in the three of four cases. The lead and/or differential diagnoses were correctly established in all cases. Conclusions: We proposed automatic identification and pre-classification of white blood cells, and identification of red blood cells by size, color, forms, and inclusions. The automated whole slide imaging system demonstrates the efficacy of the proposed method for differential and/or lead diagnosis. The results were compared with reference results reported by an involved anonymous pathologist in the respective round. It's a useful tool that increases its adoption among hematologists, pathologists, scientists, educators, and research initiatives.
HB HAMMERSMITH: LABORATORY CHARACTERIZATION OF AN UNUSUAL M-HEMOGLOBIN VARIANT
Arpan Samaddar, Aruna Rangan, Xi Zhang, Tavanna Porter, Michelle Savedra, Jennifer Herrick
Division of Hematopathology, Department of Laboratory Medicine and Pathology, Mayo Clinic Rochester, MN, USA
ABERRANT IMMUNOPHENOTYPIC EXPRESSION INPEDIATRIC ACUTE LEUKEMIA: A TERTIARY CARE INSTITUTION EXPERIENCE
Nazish Saqlain, Fatima Batool, Saima Farhan
The Children's Hospital, University of Child Health Sciences Lahore, Pakistan
Introduction: Pediatric acute leukemia accounts for 25.1% of all cancers in children. Aberrant immunophenotypes is the pattern of antigen expression on neoplastic cells different from the process of normal hematopoietic maturation due to their abnormal genetic program. Objective: The objective of this study was to determine the aberrant phenotype in pediatric acute leukemia. Material and methods: This is an on-going cross-sectional study carried at the Department of Hematology and Transfusion Medicine, University of Child Health Sciences and Children's Hospital, Lahore, commencing on 1 October 2022 after IRB approval. The cases studied till December 2022 were 290 patients diagnosed with acute leukemias. Informed consent was obtained from patient's parents/guardians. Peripheral blood and bone marrow sample in EDTA vial were used for flowcytometric analysis by using FACSCanto II flowcytometer. The data was collected on a self-designed Proforma and analyzed by using IBM-SPSS V-23. Result: Among 290 cases of pediatric acute leukemia, the range of age was between 1 and 16 years with male to female ratio of 1.4:1. Out of total cases, 178(61.3%) had their imunophenotypic profile done with the help of Flowcytometric analysis on bone marrow aspirate while 112(38.6%) cases were analyzed using peripheral blood. Acute Lymphoblastic Leukemia (ALL) constituted 221(76.2%) cases and 69(23.7%) were Acute Myeloid Leukemia (AML). Out of the total, 32(11%) cases showed aberrant immunophenotype with the mean age was 7.9 ± 4.3 (Mean ± SD), the mean RBCs was 3.79 ± 1.2 × 10⁶/μL (Mean ± SD), the mean Hb was 10.1 ± 3.2 g/dL, the mean WBCs was 8.65 ± 6.4 × 10³/μL and the mean platelets count was 277 ± 281 × 103/μL. The total aberrant antigens were 40(13.7%). The most common aberrant antigens were reported in B-ALL and the most common aberrant antigen was CD13 (62.5%). In AML the most common aberrant antigen was CD19 (55.6%) and in T-ALL the most common were CD117 and HLADR (26.6%). Conclusion: The most common aberrancy was seen in B-ALL cases followed by AML and then T-ALL. Aberrant immunophenotypic expression should be kept in mind while diagnosing the pediatric patients with acute leukemia as it may affect the prognosis of disease. Key words: Acute leukemia, ALL, AML, Imunophenotypic expression, aberrant markers, minimal residual disease.
COMPARISON OF SINGLE AND DOUBLE CENTRIFUGATION METHODS FOR PREPARATION OF PLATELET-RICH PLASMA
Nazish Saqlain1, Naghmana Mazher2, Tooba Fateen3, Asma Siddique1
1The Children's Hospital, University of Child Health Sciences Lahore, Pakistan, 2FJMU Lahore, Pakistan, 3AIMC Lahore, Pakistan
Introduction: The Platelet Rich Plasma (PRP) is derived from venous blood and as the name indicates it has high quantity of platelets and can be used in enhancing the concentration of growth factors. Objective: The objective of the study was to compare the platelet count, platelet concentration/yield, residual Red blood cells (RBCs) and White blood cells (WBCs) counts in platelet-rich plasma (PRP) samples prepared from the single- and the double-centrifugation protocols. Materials and Methods: It was a Cross-Sectional study, conducted at the Department of Hematology & Transfusion Medicine, The Children's Hospital and UCHS, Lahore from October 2021 to January 2022 including 50 voluntary, healthy individuals of age 20–45 years of both genders, after taking informed consent. Complete blood count analysis of all participants was done initially by drawing 3 mL blood in EDTA vial. From all the participants, 20 mL venous blood sample was taken in syringes containing tri-sodium citrate and then shifted to harvest tubes. Group I comprised of PRP samples prepared by single- centrifugation method. While Group II samples were prepared by Double-centrifugation method consisting of soft and hard spin. The platelet, RBC and WBC counts in prepared PRP samples were determined by using automated SYSMEX XP-100 hematology analyzer. Platelet yield or Platelet concentration (%) was calculated for samples using formula. The data analysis was done using SPSS version 23. The full article is under publication process in PJMS. Results: The mean PRP platelet count in Group I was 594.6±157.4 × 10³/μL whereas in Group II was 923.06± 127.58 × 10³/μL. In Group I, the mean platelet concentration/yield in PRP was 175.75% ± 55.08% while in Group II, it was 276.78% ± 112.7%. Significant difference was observed between the platelet counts and platelet concentration/yields from the PRP samples of two Groups (p < 0.01). Significant difference between the WBCs count was also observed (p < 0.01) with higher WBCs in Group I PRP. Residual RBCs were almost same among two groups. Conclusions: The double centrifugation protocol resulted in higher platelet quantity and yield with less contamination by red and white blood cells than did the single centrifugation protocol for PRP preparation. So, double centrifugation method is beneficial in preparation of autologous as well as allogenic PRP.
Key words: Platelet-rich plasma; Platelet concentration; Centrifugation; Blood.
NON TUBERCULOUS MENINGITIS INFECTION IN ACUTE MYELOID LEUKEMIA PATIENT
Dayu Satriani1, Yusuf Bahasoan2
1Indonesia Depok Indonesia, 2Indonesia Jakarta Indonesia
Introduction: Non-tuberculous mycobacterium (NTM) isan opportunistic pathogen for susceptible cases as in immunodeficiency state. Centers for Disease Control and Prevention (CDC) reported that NTM infection could be found in 10% of patients with Human Immunodeficiency Virus (HIV) presenting with symptoms resembling M. tuberculosis (MTB) to such an extent that NTM infection could be suspected in cases unresponsive to antituberculosis treatment. NTM infection may progress due to therapy inadequacy, and could disseminate mainly hematogenous to other organs such as central nervous system. CASE A 38-year-oldmale on admission withfever, suppurative cough, dyspnea, headache and altered consciousness. He had history of HIV infection on antiretroviral therapy(ART) since 2008, hepatitis B and C co-infections since 2017, and was diagnosed for acute myeloid leukemia (AML) in 2019. The patient subsequently diagnosed as AFB negative tuberculosis and being treated with anti tuberculosis regiment since April 2020. He fell in undernourished category with 14.5 kg/m2 body mass index, physical examinations showed right orbital mass, oral candidiasis, rhonchi, and liver enlargement. Histology of bone marrow biopsy was concluded for AML. NTM was detected based on PCR TB CSF analysis. The patient had elevated blasts peripheral percentage >20%. His CD 4+ cell count was 357 cells/μL, and the results of Gram staining and sputum culture obtained isolates of Klebsiella pneumonia and Pseudomonas aeruginosa. There was an increase of procalcitonin level (7.84 ng/mL) and on the HCV RNA examination virus was detected (7.08 Log IU/mL. Conclusion: A 38-year-old male suffered from immunodeficiency condition due to HIV-AIDS causing opportunistic NTM infection, accompanied by AML which also exacerbates immunodeficiency. Patients also suffered from Hospital acquired pneumonia(HAP) and had hepatitis B and C chronic co-infection.
Key words: NTM, HIV, AML, HAP, Hepatitis
HEMOPHAGOCYTIC SYNDROME SECONDARY TO ACUTE TOXOPLASMOSIS INFECTION
Leire Sãiz Sierra1, Paula Costa Climent1, Anna Marull Arnall1,2, David Cruz Garcia3, Francesc Xavier Queralt Moles1,2, Maite Serrando Querol1,2
1Laboratori Clinic Territorial ICS-IAS Girona, Spain, 2Group Neoma, Facultat De Medicina Girona, Spain, 3Institut Catal〠Oncologia Girona, Spain
Introduction: Toxoplasmosis is an infection caused by intracellular protozoan parasite Toxoplasma gondii (TG).It's typically asymptomatic in immunocompetent patients while in situations with compromised immune system is more likely to develop a severe primary infection including fever, confusion, headache, seizures, poor coordination within others. Transmission can be zoonotic, foodborne, congenital and in rare instances iatrogenic. Case report A 55-year-old male with hemoglobin SC disease presented with fluctuating fever, affectation of general state, dry cough and myalgias, two weeks after being discharged with a presumptive diagnosis of acute bronchitis. One month before, he went to Gambia and since then, the patient referred the symptoms started. Clinical examination revealed cataracts in eyes, bradyphrenia and reduced levels of consciousness with no signs of neck stiffness. Adenopathy's were not found. Abdominal computer tomography scan showed absence of spleen and magnetic resonance imaging scan was normal. Laboratory test results showed an hemolytic anemia together with a high percentage of erythroblasts, target cells, Howell-Jolly bodies and a non-negligible population of abnormal lymphocyte morphology (Hemoglobin 8.3 g/dL, Reticulocytes 132.7 × 10⁹/μL, Leucocytes 36.82 × 10³/μL, Erythroblasts 30%, IgG positive direct antiglobulin test, Lactate dehydrogenase 1764 U/L, Alanine aminotransferase 115 U/L, indirect bilirubin 1.11 mg/dL, haptoglobin 8.3 mg/dL, D-Dimer 10 248 ng/mL, Ferritin >2000 ng/mL, Reactive C Protein 0.92 mg/dL). Over the course of admission, his neurological status and eye disease continued to decline. Lumbar punction was performed with no alterations, bone marrow study was obtained with presence of some hemophagocytes and blood cultures were repeatedly negative. Malaria and trypanosomiasis were excluded with several thick blood smears as well as with molecular techniques. Differential diagnosis included Epstein-Barr virus, Cytomegalovirus, and HIV, HTLV D I/HTLV-II, VHS-1/VHS-2, Cryptococcus neoformans and TG. Serology testing for TG resulted positive for IgG and IgM with low avidity. Results were confirmed by PCR in blood and cerebrospinal fluid with positive and negative results respectively. The patient was finally diagnosed with Hemophagocytic syndrome secondary to acute toxoplasmosis infection with vitritis. Conclusions Blood smear may be not always a helpful diagnostic tool as in very reactive situations; lymphocyte morphology can lead to confusion between a hematological malignancy and reactive pathology. Acute toxoplasmosis can be manifested differently so it's important a broad differential diagnosis. In this case, clinical manifestation was mainly ocular and neurological. Appropriate testing with serological and molecular techniques is important for an appropriate diagnostic.
THROMBOSIS AND BLEEDING OUTCOMES WITH ANTI-XA ADJUSTED LOW MOLECULAR WEIGHT HEPARIN THROMBOPROPHYLAXIS IN PREGNANT WOMEN AT HIGH RISK OF VENOUS THROMBO-EMBOLISM
E Schapkaitz1, E Libhaber1, BF Jacobson1, HR Buller2
1University of Witwatersrand Johannesburg South Africa, 2University of Amsterdam Amsterdam Netherlands
Introduction: Venous thrombo-embolism (VTE) is an important cause of maternal mortality and thromboprophylaxis is recommended in in pregnant and postpartum women with a history of VTE. The pharmacodynamics of low molecular weight heparin are altered during pregnancy as a result of the increased volume of distribution and enhanced renal clearance. Anti-Xa monitoring has been suggested to guide dose adjustments with advancing gestation. Nonetheless, there is limited efficacy and safety data with regular anti-Xa monitoring. Aim To assess anti-Xa adjusted enoxaparin thromboprophylaxis in pregnant women at high risk of VTE and its association with thrombosis and bleeding outcomes Methods A cohort study was conducted at the combined cardiac obstetric clinic in Johannesburg, South Africa. The clinical records of consecutive pregnant women, who received enoxaparin thromboprophylaxis for the prevention of VTE between March 1, 2017 and September 1, 2022, were reviewed. Pregnancies, with a personal history of VTE, were managed with anti-Xa adjusted enoxaparin antepartum from a median [interquartile range] of 12 [14] weeks’ gestation and for 6 [0] weeks' postpartum. Peak anti-Xa levels, at a mean ± standard deviation of 3.3 ± 0.4 hours, were monitored at regular intervals to achieve an anti-Xa level of 0.3–0.5 units/mL. Pregnancy-related VTE was objectively confirmed. Major, clinically relevant non-major and minor bleeding were defined according to the International Society on Thrombosis and Hemostasis Scientific Subcommittee. The study was approved by the Wits Human Research Ethics Committee, Medical (M-220207). Results In this cohort of 59 pregnancies, with a mean age of 33 ± 5 years, the live birth rate was 86.2%. Serial peak anti-Xa levels were available in 88.1% of pregnancies. With pregnancy progression, 19.2% required a dose adjustment in the second trimester and 25.0% in the third trimester to achieve the target range. VTE occurred only antepartum in 3.4%, 95% confidence interval (CI) 0.4-11.7 of pregnancies. Bleeding events occurred in 8.5%, 95% CI 2.8–18.7 of pregnancies of which 5.1% were classified as postpartum major bleeding. On univariate logistic regression analysis, no independent predictors of bleeding were identified. Conclusion The rates of thrombosis and bleeding with anti-Xa adjusted enoxaparin thromboprophylaxis were consistent with earlier reports in pregnant women at high risk of VTE. A randomised controlled trial is indicated to determine the efficacy and safety of anti-Xa adjusted enoxaparin as compared to fixed low dose enoxaparin thromboprophylaxis.
AN ALTERNATE WAVELENGTH FOR FIBRINOGEN ACTIVITY REDUCES INTERFERENCE FROM ICTERUS ON THE CS-5100 AUTOMATED COAGULOMETER
Julie Schmidt, Anna Merrill, Sarah Martinez, Julie Kruger
Department of Pathology, University of Iowa Hospitals and Clinics Iowa City, IA, USA
Introduction: The CS-5100 instrument utilizes a wavelength of 405 nm to determine fibrinogen activity based on optical clot detection. This method works well in icteric samples with normal or high fibrinogen. However, in icteric samples with concomitant hypofibrinogenemia, the instrument cannot detect clot formation through the darker-colored plasma, meaning the fibrinogen result is unreportable until resolution of the hyperbilirubinemia and/or hypofibrinogenemia. Given that our laboratory frequently encounters icteric samples (~25 patients per month with total bilirubin >15 mg/dL), we evaluated the performance of a higher wavelength (575 nm) for optical clot detection in the CS-5100 fibrinogen assay. Methods: The original fibrinogen assay parameters were reproduced to create a modified fibrinogen assay with the only change made being the wavelength from 405 to 570 nm. The performance of this new assay was validated by performing precision and comparison studies on two Siemens CS-5100 analyzers. In addition, we evaluated whether the new assay (570 nm) could reference the calibration curve from the original fibrinogen assay (405 nm). Results: Within-run and between-run precision were satisfactory (CV 3%–7%). Comparisons were run between the two fibrinogen assays using non-icteric (n = 18, total bilirubin <2 mg/dL) and icteric samples (n = 16, total bilirubin 12–32 mg/dL, direct bilirubin 10–30 mg/dL) spanning a fibrinogen range of 32–870 mg/dL. Measured fibrinogen agreed within 15 mg/dL or 10% in all comparison samples. Five samples were analyzed using both calibration curves and results agreed within 10%, demonstrating that a single calibration curve could be used for both original and modified fibrinogen assays. To trigger the alternate assay, laboratory staff are instructed via middleware rules to visually inspect samples with either a ‘Slight coagulation' or ‘No coagulation' error generated by the CS-5100 during fibrinogen measurement. For icteric samples, the alternate fibrinogen assay is manually ordered. Since implementation of this assay almost 2 years ago, it has been utilized approximately 10 times per month. Conclusions: An alternate wavelength of 575 nm can be used to precisely and accurately determine the fibrinogen activity in icteric samples on the Siemens CS-5100 instrument. This modified method is especially useful in patients with concomitant hyperbilirubinemia (total bilirubin >15 mg/dL) and hypofibrinogenemia (fibrinogen <100 mg/dL).
ESTABLISHMENT OF REFERENCE INTERVALS FOR HEMOGLOBIN A, A2 AND F IN PAKISTANI CHILDREN USING AN INDIRECT DATA MINING APPROACH
Muhammad Shariq Shaikh, Sibtain Ahmed, Zeeshan Ansar, Shahnawaz Bayunus
Aga Khan University Karachi, Pakistan
Establishment of Reference Intervals for Hemoglobin A, A2 and F in Pakistani Children using an Indirect Data Mining Approach Authors: Muhammad Shariq Shaikh (1), Sibtain Ahmed (1), Zeeshan Ansar (1), Shahnawaz Bayunus (1) Department of Pathology & Laboratory Medicine, Aga Khan University Hospital Pakistan. INTRODUCTION: Reference intervals (RIs) are important medical decision-making tools that help physicians in differentiating healthy from sick individuals. These intervals vary in between gender and age groups. Hemoglobinopathies are prevalent in Pakistan. Quantification of hemoglobin variants is pivotal in screening out hemoglobin disorders. Establishment of RIs using a direct approach is difficult, specifically in children. We chose a data mining method (indirect method) for the determination of Hemoglobin (Hb) A, A2 and F RIs. METHOD: Hemoglobin A, A2 and F measurements performed for both inpatients and outpatients aged birth to 18 years between January 2013 and December 2020, were retrieved from laboratory management system of clinical laboratories at the Aga Khan Hospital. The study population was approximately representative of the entire geographical distribution of the country. Hemoglobin subtype were measured on Bio-Rad VariantTM II Turbo. Reference intervals were computed using an algorithm developed and validated by the German Society of Clinical Chemistry and Laboratory Medicine's Working Group on Guide Limits. Assuming that non-pathologic samples follow a Gaussian distribution (after Box-Cox transformation of the data), an elaborate statistical process was used to isolate distribution of physiological samples from the mixed dataset and used to calculate reference intervals. For the validation of our results, we compared our derived RIs with those from the Hemoglobinopathy Diagnosis Text Book. RESULTS: A total of 75 419 specimens were analyzed during the study period. After the exclusion of patients with multiple specimens obtained during the study period, RIs were calculated for 63 332 children with stratification into age groups. A comparison of our 2.5th and 97.5th percentile results with those of established RIs from Text Book on Hemoglobinopathies demonstrated good agreement in between different age groups. CONCLUSIONS: This study supports data mining as an alternate indirect approach for establishing hemoglobin variants specifically in resource-limited settings. The results obtained are specific to studied population, instrument and reagent used. These intervals therefore, will assist in better clinical decision-making based on hemoglobin variant results.
EVALUATION OF THE CLINICAL SUITABILITY OF MIND RAY BC-720 IN MEASURING ERYTHROCYTE SEDIMENTATION RATE
Guofang Shu, Zhi He, Mindjie Chen, Molong Li, Rong Ding
Zhongda Hospital Southeast University Nanjing China
Background: The erythrocyte sedimentation rate (ESR) is a nonspecific inflammation indicator used to observe disease dynamics. The traditional ESR measuring method Westergren is time-consuming. There's a built-in ESR testing function in a new hematology analyzer Mindray BC-720, and we evaluated the clinical suitability of this method in measuring ESR from patient samples from different departments. Methods: We collected 100 blood samples each from the department of rheumatic immunology, orthopedics, and hematology in 2022 at the Zhongda Hospital Southeast University. ESR was measured and compared by BC-720 and Westergren methods. The clinical efficiency was also analyzed using the Westergren results as the reference. Besides, we selected samples with hematocrit (HCT) <35% to evaluate the performance of ESR from BC-720 in patients with possible anemia. We also studied the correlation between ESR measured by BC-720 with the course of the disease by measuring ESR and other indicators of 4 patients continuously. Results: The ESR value measured by BC-720 correlated very well with the Westergren method in the department of rheumatic immunology (r = 0.9736), orthopedics (r = 0.9681), and hematology (r = 0.9739), and no significant difference was found among them. The clinical efficienciesof the BC-720 ESR were 94% (rheumatic immunology), 94% (orthopedics), and 96% (hematology), using Westergren results as the reference. In the patients with HCT <35 %, the BC-720 ESR also showed good correlations in all 3 departments (r >0.96). The BC-720 ESR significantly increased with the severity of the diseases for the 4 patients in this study. Conclusion: The ESR function of the BC-720 auto hematology analyzer is a simple, quick, and reliable method to measure ESR in patients from rheumatic immunology, orthopedics, and hematology departments.
MOLECULAR FINDINGS IN MYELOID NEOPLASMS CLASSIFICATION
Alexa Siddon
Yale University, USA
Advances in our understanding of the molecular pathogenesis of myeloid neoplasms have been a major theme in the updates to the classification of Acute Myeloid Leukemia, Myelodysplastic Syndromes, and Myeloprolferative Neoplasms. These updates have resulted in the International Concensus Classification (ICC) and the fifth edition of the World Health Organization Classification of Haemtolymphoid Tumours (WHO-HAEM5). This talk will focus on the recent updates to the classification systems with an emphasis on the molecular drivers of disease and how to integrate the molecular work-up into the diagnosis of myeloid neoplasms.
VWD DIAGNOSIS AND THE SIGNIFICANCE OF LOW VWF LEVELS
Robert Sidonio
Emory University, Atlanta
Low VWF typically refers to persons who have a VWF activity or antigen between 30% and 50% associated with pathological bleeding. Recently an international effort convened to better define this group and improve access to our hemophilia treatment centers. Although diagnostically challenging, even moreso is how to manage acute bleeding events and in preparation for surgery. This short lecture will focus on changes to the VWD guidelines and characterizing those with low VWF or mild VWD.
THE EFFECT OF THERAPY ON THE COAGULATION ACTIVITY OF MICROPARTICLES IN PATIENTS WITH POLYCYTHEMIA VERA
Natalia Silina, Olesia Matvienko, Natalia Korsakova, Olga Golovina, Olga Smirnova
Russian Research Institute of Hematology and Transfusiology Saint Petersburg Russia
ANALYSIS OF DIFFERENT ALGORITHMS IN LUPUS ANTICOAGULANT ASSAYS
Anna Silva, Rosana Penteado, Liliana Suganuma, Cristina Ito, Valdir Aranda, Andreza Santos, Nikolas Constantino, Afonso Cardoso, João Guerra
Hospital Albert Einstein São Paulo, Brazil
CORRELATION OF COAGULATION PARAMETERS WITH PROGNOSIS OF COVID-19
Olga Smirnova, Olesya Matvienko, Natalia Silina, Natalya Korsakova, Olga Golovina, Victorya Yudina
Russian Research Institute of Hematology and Transfusiology Saint-Petersburg, Russia
RATIOS IN VWD TESTING
Kristi Smock
University of Utah and ARUP Laboratories
Von Willebrand disease (VWD) is a common bleeding disorder of platelet adhesion with six currently recognized subtypes. Laboratory diagnosis consists of an initial test panel including antigen, activity and factor VIII measurements, sometimes followed by further specialized testing. VWF activity/antigen testing ratios help to differentiate type 1 and type 2 disease, which is important for selection of proper therapy. Recommended ratio cutoffs differ by guideline, ranging from 0.5 to 0.7, with 0.7 commonly recommended. The ratio cutoff used affects the sensitivity and specificity for type 2 diagnosis. Variability in VWD due to underlying mutations and patient factors, as well as variability in VWF tests, impact the accuracy of ratios for VWD subtyping. This presentation will discuss use of activity/antigen ratios in the diagnosis and subtyping of VWD with a focus on technical aspects of the tests.
HEX LA LUPUS ANTICOAGULANT TEST PERFORMANCE ANALYSIS ON OPTICAL ANALYZER
Melissa Stuart, Nahla Heikal, Rajiv Pruthi
Special Coagulation Laboratory Rochester, MN, USA
ANTI-PHOSPHATIDYLSERINE/PROTHROMBIN COMPLEX ANTIBODIES (APS/PT) INCREASE THE RISK FOR THROMBOSISBASED ON LUPUS ANTICOAGULANTPOSITIVITY
Yang Su, Yuncong Zhang, Han Guo, Wanwan Guo, Cheng Liu, Rui Qiao
Department of Laboratory Medicine, Peking University Third Hospital BeiJing, China
Background: Lupus anticoagulants (LA) increase the risk of thrombotic and obstetric events in patients with antiphospholipid syndrome than in those with other antiphospholipid antibodies. Anti-phosphatidylserine/prothrombin (aPS/PT) complex antibodies are thought to cause LA positivity. Therefore, we aimed to explore whether aPS/PT antibodies could prolong phospholipid(PL)-dependent clotting time and increase the risk of thrombosis or pregnancy complications based on LA positivity. Methods: We recruited 222 patients with positive LA and estimated their aPS/PT, anticardiolipin (aCL), anti-β2-glycoprotein I (aβ2GPI), and anti-β2GPI domain I (anti-D1) antibody (IgM and IgG) titersand PL-dependent clotting time [prothrombin time (PT), silica clotting time-screening (SCT-S), silica clotting time-confirmation (SCT-C), diluted Russell's viper venom time-confirmation (dRVVT-C), and diluted Russell's viper venom time-screening(dRVVT-S)]. Results: PT was longer in aPS/PT IgG-positive patients than in aPS/PT IgM-negative patients [12.1 (11.3, 14.4) s vs. 11.10 (10.6, 11.8) s; p < 0.001], while there was no significant difference between aPS/PT IgM-positive and IgM-negative patients [11.4 (10.9,12.4) s vs. 11.3 (10.7,11.9) s; P = 0.100]. Both SCT-S and dRVVT-S were prolonged in aPS/PT (IgG and IgM)-positive patients [IgG: 120.0 (75.0,158.0) s vs. 50.0 (40.0,70.0) s; IgM: 80.0 (57.8,125.8) s vs. 47.0 (38.0,67.3) s]compared to aPS/PT-negative patients [IgG: 48.0 (40.0, 62.0) s vs. 41.0 (36.0, 56.0) s; IgM: 46.0 (39.0, 52.0) s and 41.0 (36.0, 52.0) s]. The associations between aPS/PT IgG or IgM antibody titers and SCT-S or dRVVT-S were significant(P <0.001, P = 0.010, P <0.001, P = 0.002, respectively). SCT-C and dRVVT-C did not show any significant differences. The incidence of thrombosis in the aPS/PTIgG-positive group was much higher than that in the IgG-negative group (25.4% vs. 11.7%, χ2 = 6.331, P=0.012). Likewise, the incidence of thrombosis was higher in the anti-D1- and aPS/PT IgG-positive patients than in the negative controls(40% vs. 14.3%, χ2= 3.934, P = 0.047).Furthermore, the aPS/PT IgG-positive group showed the strongest association with thrombosis [OR 2.584, 95% CI (1.213, 5.505)]. Conclusion::The aPS/PT antibodies prolonged PL-dependent clotting time, especially SCT-Sand dRVVT-S. In addition, the aPS/PT IgG-positive subtype increased the risk of thrombosis in LA positivity.
CONSTRUCTION OF AN ARTIFICIAL NEURAL NETWORK MODEL BASED ON BLOOD CELL PARAMETERS FOR SCREENING MALIGNANT BLOOD DISEASES IN PERIPHERAL BLOOD
Dehua Sun 1, Yongjian He 1, Zhigang Mao 2, Chi Zhang 3, Dandan Liu 4, Jun He 4, Lu Li5, Jingxian Zhang 5, Yan Liu5, Ziyong Sun3
1Department of Clinical Laboratory, Nanfang Hospital Guangzhou China, 2Department of Clinical Laboratory, West China Hospital of Sichuan University Chengdu China, 3Department of Clinical Laboratory, Tongji Hospital, Tongji Medical College of Hust Wuhan China, 4Department of Clinical Laboratory, The First Affiliated Hospital of Soochow University Suzhou China, 5Department of Clinical Research & Medical Affairs, Shenzhen Mindray Bio-Medical Electronic Co., Ltd. Shenzhen China
Background: Diagnosis of malignant hematological diseases often involves complicated tests such as morphology, immunology, cytogenetics, and molecular biology, which are complex and time-consuming. However, timely early screening for malignant hematological diseases is essential for effective treatments. In this study, an artificial neural network screening model for malignant blood diseases was constructed by blood routine tests and blood cell morphology parameters, and the effectiveness of the model was verified.
Methods: The venous blood samples of 1185 patients were collected from four tertiary hospitals nationwide as the training set. The patients were divided into non-malignant and malignant hematological diseases (lymphoma, acute lymphoblastic leukemia, acute myeloid leukemia, myelodysplastic syndrome, or myeloproliferative neoplasms patients) according to the clinical diagnostic information. Hematological and blood cell morphology parameters were collected using Mindray hematology and morphology analyzers, and relevant parameters were selected using the Filter method to construct an artificial neural network (ANN) model for screening malignant hematological diseases. Afterward, a testing set (n = 508) was utilized to evaluate the performance of the model. The accuracy, sensitivity, and specificity of this model to identify malignant hematological diseases were analyzed using the clinical diagnosis as the reference.
CONSTRUCTION OF A DEEP LEARNING MODEL TO ESTIMATE THE CAUSE OF APTT PROLONGATION USING MULTI-WAVELENGTH CLOT WAVES
Takeshi Suzuki1, Tomoko Matsumoto2, Daiki Shimomura3, Masato Matsuda4, Yuka Tabuchi1, Hiroshi Kurono1, Keisuke Nishi1, Nobuo Arai1, Yoshiki Hoshiyama5, Mikio Kamioka3, Masato Moriyama6
1Sysmex Corporation Kobe, Japan, 2Department of Clinical Laboratory, Tenri Health Care University Tenri, Japan, 3Department of Laboratory Medicine, Tenri Hospital Tenri, Japan, 4Department of Clinical Laboratory, Fukushima Medical University Fukushima, Japan, 5Medical Laboratory Division, Niigata University Medical and Dental Hospital Niigata, Japan, 6Department of Medical Oncology, Niigata University Graduate School of Medicine and Dental Sciences Niigata, Japan
Background Activated partial thromboplastin time (APTT) is used as a screening test for blood coagulation mechanisms in routine clinical laboratory tests, and the reasons as to why it may be prolonged vary. Some coagulation analyzers can output not only the coagulation time but also various parameters by Clot Waveform Analysis (CWA), which analyzes the reaction processes of APTT over time. These are used as additional information for inferring the cause of APTT prolongation. Sysmex's coagulation analyzers are capable of multi-wavelength CWA and are used for detecting abnormalities during APTT measurements, as well as for auxiliary measurements of difficult-to-measure samples. Objective We constructed a model to estimate the cause of APTT prolongation by processing multi-wavelength CWA waveform information with a convolutional neural network and evaluated its performance. Methods We included 669 samples with prolonged APTT, and the cause of APTT prolongation was confirmed based on medications administered and clinical information. The breakdown of samples was as follows: 100, Heparin; 258, Direct Oral Anticoagulants (DOACs); 105, Warfarin; 82, Lupus Anticoagulant (LA) positive; and 124, specimens with either decreased factor VIII, inhibitor positive, or decreased factor IX (FVIII/FVIIIi/FIX). CWA was measured using fully the Automated Blood Coagulation Analyzer CN-6000 and Revoheme APTT SLA. The performance of APTT extension cause classifications using the constructed deep learning system was evaluated by 10-fold cross-validation. Results The results (sensitivity, specificity, AUC) of prolongation of APTT using this model were as follows: Heparin (92.0%, 95.3%, 0.970), DOACs (86.8%, 95.1%, 0.959), Warfarin (99.0%, 95.0%,0.989), LA (61.0%, 95.1%, 0.934), and FVIII/FVIIIi/FIX (83.9%, 95.0%, 0.974). Conclusion The model constructed in this study was able to detect the probable cause of APTT prolongation with a sensitivity of 60% or more and a specificity of 95% using only the CWA waveform information obtained from APTT measurements.
EVALUATION FOR CONVERGENCE OF THE TARGET ASSAY RANGE FOR FRESH BLOOD CALIBRATORS MEASURED BY LABORATORIES IN EXTERNAL QUALITY ASSURANCE SURVEY FOR RETICULOCYTE PERCENTAGE
Tomohiro Takeda1,2, Sayaka Mori1,3, Kazuto Tsuruda1,3,4, Katsunori Yanagihara3,5, Yutaka Nagai1,2,4, Kunihiko Takano1,6, Etsuko Ogawa1,7, Mai Yoshimura2, Yoko Yatabe8, Ryota Nakanishi9, kenji Yamade10, Kazumichi Matsumoto11, Hiroko Tanada12, Tohru Inaba1,13, Akiyoshi Takami3,14, Yutaka Yatomi15,16
1JSLH Standardization Sub-committee for Blood Cell Counting Tokyo, Japan, 2Kansai University of Health Sciences Osaka, Japan, 3Nagasaki University Hospital Nagasaki, Japan, 4JSLH Standardization committee Tokyo, Japan, 5Nagasakiken Medical Association Nagasaki, Japan, 6Beckman Coulter Tokyo, Japan, 7BD Biosciences Tokyo, Japan, 8Keio University Hospital Tokyo, Japan, 9Shiga University of Medical Science Hospital Shiga, Japan, 10Kinki University Hospital Osaka, Japan, 11University Hospital Kyoto Prefectural University of Medicine Kyoto, Japan, 12Osaka Medical College Hospital Osaka, Japan, 13Kyoto Prefectural University of Medicine Kyoto, Japan, 14Aichi Medical University Nagoya, Japan, 15Japanese Society for Laboratory Hematology Tokyo, Japan, 16The University of Tokyo Tokyo, Japan
Introduction: The internationally recognized flow cytometry reference method for reticulocyte percentage (RM-Retic) is established and used. It is important for practical use to confirm the convergence of the assay values for fresh blood calibrators measured by different laboratories. The Japanese Society of Laboratory Hematology (JSLH) executed assay value measurement in 12 laboratories to provide the target range for external quality assurance survey in Nagasaki prefecture. Methods: Fresh whole blood samples were collected from 2 healthy volunteers within blood bag containing CPDA solution, and EDTA-2K was added at a final concentration of 1.5 mg/mL. Aliquot volume (1.5 mL) of the samples were refrigerated and hand-delivered to each laboratory. The target assay ranges were determined by means of assay values measured by 13 flow cytometes (FACS CantoII 3, FACS Lyric 4, FACS Symphony 1 and Navios 5). The mean of 3 immunostaining tubes in 3 peripheral blood samples were used. The RM used the JSLH method which was validated by the CLSI H44 method. All examiners were trained using the RM procedure provided by JSLH. The samples were measured within 24 h after drawing. Target assay values were determined by means of assay values, and the target assay ranges as allowance interval (AI) was determined from %Bias. %Bias was calculated by Intra-individual biological variation (CVI) and between individual biological variation (CVG). The CVI and the CVG were used values in the biological variation database by the European federation of clinical chemistry and laboratory medicine (EFLM-BV). %Bias was calculated by 0.25 × (CVG2 +CVI2)1/2). The convergence of the target assay range as analytical variation (CVA) was compared with CVI. Results: The AIs of sample A for %reticulocyte were 1.52 (1.41–1.63). The AIs of sample B for them were 0.88 (0.82–0.95). The SD/CVA for %reticulocyte were 0.15/9.8% and 0.16/18.5%. All CVAs were over CVI (9.7%). The target assay ranges of sample A in each group of CantoII, Lyric, Symphony and Navios were 1.37–1.76, 1.65–1.65, 1.33–1.59 and 1.32–1.55. The ranges of sample B in them were 0.85–1.22, 1.11–1.11, 0.67–0.81 and 0.72–0.82. Conclusion: The convergence of the assay values for fresh blood calibrators measured by different laboratories were insufficient precision requirements of EFLM criteria of “desirable”. The AIs was determined by the mean of assay values and %Bias calculated CVI and CVG in the EFLM database.
CUP-LIKE BLASTS IN ACUTE MYELOID LEUKAEMIA: AN INSTITUTIONAL REVIEW
Shi Yong Tan, Fung Wan Tam, Chieh Hwee Ang, Sim Leng Tien
Singapore General Hospital Singapore, Singapore
Introduction: Blasts with cuplike nuclear morphology have been reported in cases of acute myeloid leukaemia (AML) without maturation. The presence of cup-like blasts has been shown to be associated with certain distinct molecular and immunophenotypic features. The purpose of this study is to identify the frequency of such cases and elucidate the relationship between the presence of cup-like blasts and various immunophenotypic and molecular findings. Methods: We reviewed peripheral blood and bone marrow slides of patients diagnosed with AML without maturation at Singapore General Hospital over the past 10 years. Criteria for a positive case includes presence of at least 10% cup-like blasts, with cuplike nuclear invaginations covering at least 25% of the nuclear area. Clinical, immunophenotypic, cytogenetic and molecular findings were analysed and compared with a control group comprising cases of AML without maturation who do not have cup-like blasts. Results: We identified 15 AML patients with cup-like blasts and they accounted for 16% of all cases of AML without maturation. Cases of AML with cup-like blasts were significantly associated with a higher frequency of FLT3-ITD mutations (85% vs. 25%, p = 0.003), NPM1 mutations (92% vs. 25%, p = 0.0005), both mutations (85% vs. 13%, p = 0.0001), the lack of CD34 expression (92% vs. 25%, p = 0.0005) and lack of HLA-DR expression (100% vs. 63%, p = 0.03). There was a significant difference in the presenting white blood cell counts between the study and control groups (p = 0.0002). No significant relationship was found between the study and control groups with regards to cytogenetic findings. There were also no significant differences in age, gender and bone marrow blast percentage between the two groups. The positive predictive value for identifying AML with cup-like blasts for FLT3-ITD, NPM1 and both mutations are 85%, 92% and 85%. The negative predictive value for identifying AML with cuplike blasts for FLT3-ITD, NPM1 and both mutations are 75%, 75% and 88%. Conclusion: Our study corroborates existing data that cases of AML with cup-like blasts are highly associated with the presence of FLT3-ITD and NPM1 mutations, along with other immunophenotypic features. Identification of such distinctive cuplike nuclear morphology may be helpful in the prioritization of downstream laboratory workup of such cases of AML.
TRITON-ACID-UREA POLYACRYLAMIDE GEL ELECTROPHORESIS CONFIRMED THE AUTOPHAGY-MEDIATED CLEARANCE OF FREE ALPHA GLOBIN IN METFORMIN-TREATED NUCLEATED RED BLOOD CELLS
Parisa Tandel1, Elham Jamali1,2, Akbar Hashemi Tayer3, Reza Ranjbaran1
1Diagnostic Laboratory Sciences and Technology Research Center, School of Paramedical Sciences, Shiraz University of Medical Sciences, Shiraz, Iran, 2Peyvand Pathobiology and Genetic Lab Complex, Shiraz, Iran, 3Research Center for Noncommunicable Diseases, Jahrom University of Medical Sciences, Jahrom, Iran
Introduction: The severity of the beta-thalassemia disease is mainly dependent on accumulation of the excess alpha-globin chains in red blood cell precursors which could impair erythroid cells. Mechanisms that reduce the accumulated alpha-globin chains could be beneficial to ameliorate the severity of symptoms in patients. Autophagy is an intracellular process for the removal of proteins and/or damaged organelles via lysosomes. mTOR pathway has been known as one of the key inhibitors of autophagy. Therefore, inhibiting the mTOR pathway could be a promising strategy to reduce the disease severity via autophagy-mediated clearance of alpha globin chains. Herein, we investigated the effect of metformin, an antidiabetic drug with mTOR inhibitory effects, on reduction of alpha-globin chains in nucleated red blood cells (NRBCs) isolated from beta-thalassemia major patients. Methods: NRBCs were isolated by Ficoll gradient centrifugation from blood samples collected from 17 beta-thalassemia major patients. NRBCs were cultured in RPMI 1640 complete medium and treated with different concentration of metformin for 4 days. Afterward, NRBCs were harvested and subjected to protein and RNA extraction. Changes in concentration of free alpha globin were measured by electrophoresis of proteins on Triton-Acid-Urea polyacrylamide gel. Furthermore, the expression level of autophagy-related genes (MAP1LC3B, ATG5, ATG7, and BECN1) were assessed by qRT-PCR. Results: Analysis of TAU gel electrophoresis results revealed that the concentration of free alpha-globin chains in NRBCs was significantly decreased by 9.5% ± 5.2%, 13.2% ± 8.6%, and 17.1% ± 10.5% after treatment with 0.4, 0.8, and 1 mM metformin. Besides, expression level of MAP1LC3B, ATG7 and BECN1 genes significantly increased in 1 mM metformin-treated NRBCs compared to untreated NRBCs (Fold changes: 8.2 ± 2.2, 77.1 ± 16.3, 137.5 ± 55.8, Respectively). The expression level of ATG5 gene also showed an increasing tendency which was not statistically significant (P value: 0.243). Conclusion: Findings suggest that metformin could be considered as a promising therapeutic agent for attenuating the disease severity in thalassemia patients due to its mTOR inhibitory-mediated autophagy activation effect.
COMPARISON OF A NEW ADAMTS-13 KINETIC ASSAY WITH FRET-VWF SUBSTRATE IN THE FLUORESCEIN SPECTRAL RANGE
Julie Tange, Melissa Stuart, Jansen Seheult, Nahla Heikal, Dong Chen, Rajiv Pruthi
Special Coagulation Laboratory, Mayo Clinic Rochester, MN, USA
Introduction: ADAMTS-13 cleaves ultra-large/high molecular weight von Willebrand factor (VWF) multimers (UL/HMWM) which accumulate in congenital or acquired deficiency of ADAMTS-13 and poses a risk for thrombotic thrombocytopenic purpura (TTP). The fluorescence resonance energy transfer (FRET)-VWF kinetic assay is critical for measurement of ADAMTS-13 activity in the diagnostic workup for TTP. We analyzed performance characteristics of a new ADAMTS-13 activity kit [ATS-13®ADAMTS13 Activity Assay 2.0 (Immucor, Waukesha, WI)] Ex492/Em518 compared to version 1.0 Ex345-350/Em440-450. Methods: ATS-13 2.0 was performed on the Perkin-Elmer Janus G3 liquid handling system and Agilent BioTek Synergy Neo2 microplate reader. Accuracy was performed on commercially available calibration materials and de-identified/archived plasma samples (n = 48) following IRB guidelines. Linearity was performed on four waste samples and the WHO first standard at a minimum of eight dilutions. Precision was established using three levels of pooled plasmas (assayed four times in duplicate, twice daily for five days). Limit of detection (LOD) and lower limit of quantification (LLOQ) was determined on kit diluent and low-level patient sample, each assayed 20 times per day for three days, on two different kit lots. Reference interval was based on 120 normal donor samples (60 male/60 female; ages 21–81 years). Analytical specificity assessed hemolysis, icterus, and lipemia (HIL) interference using HIL indices from the ACL TOP 750 preanalytical sample integrity check module (Werfen, Bedford, MA). Results: Quantitative accuracy showed an r2 = 0.951, slope = 1.019, and mean % bias of −1.0% (Passing-Bablock regression). Linearity studies averaged an r2 = 0.994 and slope = 0.989 with recovery within ±15% of assayed levels from 1.5% to 122.1% (122.1 IU/dL). Repeatability and within-laboratory CVs were 2.3% and 4.0% at ADAMTS-13 of 77.9%, 2.9% and 7.5% at ADAMTS-13 of 36.6% and 3.1% and 7.7% at ADAMTS-13 of 12.5%. LOD of 1.2% and LLOQ of 3.8% were established. The lower bound of the one-sided 95% parametric reference interval was 71.7%. Hemolysis did not exceed >25% loss of recovery up to H-index levels of 900 mg/dL. However, icterus and lipemia resulted in falsely decreased results at I-index and L-index levels >30 mg/dL and >4000 mAbs, respectively. Conclusions: Our data indicate that the performance characteristics of the ATS-13 2.0 assay are in accordance with International Council for Standardization in Hematology (ICSH) recommendations (PMID 32672897), and the assay can accurately and precisely measure ADAMTS-13 in the 5-10% activity range in our laboratory setting
BEREND HOUWEN AWARD: IMPLICATIONS OF GENOMIC AND EPIGENOMIC ABERRATIONS OF WILM'S TUMOR 1 (WT1) GENE ON PROGNOSTIC OUTCOMES IN ACUTE MYELOID LEUKAEMIA AMONG INDIAN POPULATION
Pranay Tanwar1, Harsh Goel1, Anita Chopra1, Amar Ranjan1, Sameer Bakhshi2, Maroof A Khan3
1Laboratory Oncology Unit, Dr. BRA-IRCH, AIIMS New Delhi, India, 2Department of Medical Oncology, Dr. BRA-IRCH, AIIMS New Delhi, India, 3Department of Biostatistics, AIIMS New Delhi, India
THE USE OF PAIRED MATCHED SAMPLES TO DETERMINE THE TRUE EFFECT OF HAEMOLYSIS INTERFERENCE ON ROUTINE COAGULATION TESTS ON THE SYSMEX CN-SERIES COAGULATION ANALYSER
George Tarpley1, Kevin Horner2, Annette Bowyer2, Steve Kitchen2
1Sysmex UK Ltd Milton Keynes, United Kingdom, 2Sheffield Teaching Hospital NHS FT Sheffield, United Kingdom
PERFORMANCE EVALUATION OF A NOVEL METHOD FOR THE MEASUREMENT OF ERYTHROCYTE SEDIMENTATION RATE (ESR) ON THE NEW HEMATOLOGY ANALYSER MIND RAY BC-780
Xavier Tejedor Ganduxé, Elena Rufo-Vicente, Alicia Martinez-Irribaren, Alba Leis-Sestaio, Cristian Morales-Indiano
Clinical Laboratory, Core-Hematology Department. Germans Trias i Pujol University Hospital Badalona Spain
PERFORMANCE EVALUATION OF A NOVEL HYBRID PLATELET COUNT METHOD FOR CORRECTION OF SPURIOUS PLATELET COUNTS ON THE NEW MIND RAY BC-780 HEMATOLOGY ANALYZER
Xavier Tejedor-Ganduxé, Elena Rufo-Vicente, Alicia Martinez-Irribaren, Alba Leis-Sestaio, Cristian Morales-Indiano
Clinical Laboratory, Core-Hematology Department. Germans Trias i Pujol University Hospital Badalona Spain
ASSESSING HYPERCOAGULABILITY AND VTE RISK USING THROMBOELASTOGRAPHY AND KHORANA SCORE IN WOMEN UNDERGOING CHEMOTHERAPY FOR BREAST AND GYNECOLOGICAL CANCERS
Yousra Tera1,2, Shreya Anil-Kumar1, Mazen Assar1,3, Maria Karizhenskaia1,3, Karina Fainchtein1, Yoon Jin Suh1,3, Anita Agrawal4, Mihaela Mates5, Maha Othman1,2,3
1Department of Biomedical and Molecular Sciences, School of Medicine, Queen's University Kingston, ON, Canada, 2Clinical Pathology Department, Faculty of Medicine, Mansoura University Mansoura, Egypt, 3School of Baccalaureate Nursing, St Lawrence College, Kingston, ON, Canada, 4Department of Obstetrics and Gynecology, Queen's University Kingston, ON, Canada, 5Department of Oncology, Queen's University Kingston, ON, Canada
ON-SITE VERSUS SEND-OUT ADAMTS13 ACTIVITY MEASUREMENT IN THE MANAGEMENT OF ACQUIRED THROMBOTIC THROMBOCYTOPENIC PURPURA: A COST-EFFECTIVENESS ANALYSIS
Pierre Toulon1, Axel Sudria1, Ines Harzallah2
1Pasteur University Hospital, Hematology Nice, France, 2Emile Müller Regional Hospital, Hematology Mulhouse, France
COMPLETE BLOOD COUNT AND RESEARCH PARAMETERS IN THE DISCRIMINATION OF MYELODYSPLASTIC SYNDROMES FROM OTHER CYTOPENIAS
Eloisa Urrechaga1, MÃ3nica Fernández2, Garazi Mugertza1, Cristina Ponga1, Imanol Naharro1
1Hospital Universitario Galdakao Usansolo Galdakao, Spain, 2Hospital Universitario Araba Vitoria, Spain
Background: Myelodysplastic syndromes (MDS) are a constellation of different diseases sharing anemia in the great majority of cases, and this cytopenia defines these pathologies and their most dramatic clinical manifestations. We assessed the utility of complete blood count (CBC) and research parameters from the analyzer BC 6800 Plus (Mindray Diagnostics) to discriminate MDS-related cytopenia. Methods: Three hundred and ten samples were selected from the routine workload. 120 samples from healthy individuals were used established the reference intervals of research parameters, 60 patients diagnosed of MDS, 130 samples with cytopenia due to other diseases (aplastic anemia, other hematological malignancies). The CBC parameters and research use-only parameters in the cytopenic groups were compared using analysis of variance, considering P <0.05 significant. For the post hoc comparisons of outcomes between each pair of groups Scheffé correction was applied. Receiver Operating Curves analysis (ROC) was used to established the performance of individual and combined parameters for the detection of MDS. Results: In the MDS group Mean cell volume (MCV), reticulocyte hemoglobin (CHr), percentage of macrocytic and hypochromic red cells (Mac%, Hypo%), red cell distribution width (RDW) and hemoglobin distribution width(HDW) had increased values compared to the cytopenic and normal patients, while platelets, red and white cell counts (RBC, WBC) and NeuX (related to the cytoplasmic complexity of neutrophils) were lower (p < 0.001). NeuX, Mac%, HDW and RDW had higher Area under curves (AUC) 0.915 (95% CI 0.855–0.952), 0.798 (0.714–0.878), 0.777 (0.689–0.868), 0.765 (0.677–0.855) respectively, best Youden index at cut offs <318, >9.8%, >20%, >17.2% respectively. Combining these tests AUC 0.935 (95% CI 0.875–0.972), sensitivity 84.3%, specificity 89.8%. Conclusion: CBC and research parameters gain insights to the differential diagnosis of MDS among cytopenias of other etiologies.
RELATIONSHIP BETWEEN JAK2 V617F MUTATION WITH HEMATOLOGIC AND COAGULATION PARAMETERS IN PH–NEGATIVE MYELOPROLIFERATIVE NEOPLASMS
Eloisa Urrechaga1, MÃ3nica Fernández2, Garazi Mugertza1, Cristina Ponga1, Imanol Naharro1
1Hospital Universitario Galdakao Usansolo Galdakao, Spain, 2Hospital Universitario Araba Vitoria, Spain
Background: V617F mutation of Janus kinase 2 (JAK2) gene is used in the diagnosis of Philadelphia-negative myelo-proliferative neoplasms (MPN) such as polycytemia vera (PV), primary myelofibrosis (PMF) and essential thrombocythemia (ET). Patients diagnosed with MPN often develop thrombotic events as an onset of symptoms or in evolution; the pathogenesis of thrombosis in MPN patients is complex but the presence of JAK2 mutation is an important risk factor. We aimed to investigate the prevalence of JAK2 V617F mutation in our MPN patients and its association with hematological and coagulation parameters. Methods: We retrospectively reviewed the records of 115 patients diagnosed with MPN, 27 PV, 28 PMF. 60 ET, based on the 2016 World Health Organization criteria, mean age 61 years (range 51-78). All the clinical and laboratory data were collected at the time of the diagnosis without any prior treatment, including complete blood counts (CBC), coagulation function and chromosome karyotype. CBC was analyzed with Sysmex XN counters. The parameters of coagulation included prothrombin time-International normalized ratio (PT-INR), activated partial thromboplastin time (APTT) and fibrinogen, were analyzed in Stago STA R Max3 analyzers. Allele specific real-time quantitative fluorescence PCR (AS-qPCR) was performed to detect JAK2V617F mutation. Student's t test and variance analysis (ANOVA) with post hoc Bonferroni test were applied to verify differences among groups; p values < 0.05 were considered statistically significant. Results: JAK2 V617F mutation was detected in 59.9% of the cohort, 74.0% of PV, 53.5% of PMF and 55.5% of ET cases. The entire cohort of MPN patients was divided into two groups according to mutation status. JAK2V617F mutation was associated with higher Hemoglobin (Hb), leukocyte (WBC) and platelet counts, p < 0.001. Hb mutant mean 182 (Standard deviation 11) wild type 152 (9) g/L WBC mutant 16.8* (1.3) wild type 11.6 (1.1) 109/L Platelets mutant 498 (41) wild type 599 (68) 109/L Significant difference of PT-INR between patients withJAK2V617F mutation and wild-type patients p < 0.001. At the time of the diagnosis PT-INR was higher in mutation positive patients compared to negative cases. PV 1.02 (0.48) versus 1.19 (0.11), p = 0.015 PMF 1.00 (0.85) versus 1.15 (0.11), p = 0.02 ET 1.05 (0.13) versus 1.15 (0.13), p = 0.025 The same trend was observed in Fibrinogen in PMF (290 ± 96 mg/dL vs. 419 ±69 mg/dL, p < 0.001) and ET patients (212 ± 55 mg/dL vs. 390 ± 88 mg/dL, p < 0.001). Conclusions: Thrombosis remain the most important complication in Ph–negative MPN patients that significantly affect prognosis and quality of life. Higher values in CBC parameters are associated to JAK2V617F mutation; abnormal coagulation parameters, such as PT-INR and fibrinogen, were also related to JAK2V617F mutation, it alters the coagulation function and might, at least in part, account for the increased vascular events risk associated with MPN. JAK2-V617F mutation is an important parameter in prognostic evaluation because increased risk of thrombotic complications must be considered in those patients.
IMMATURE PLATELETS AND DISEASE SEVERITY IN HOSPITALIZED PATIENTS WITH COVID-19
Eloisa Urrechaga1, MÃ3nica Fernández2, Monica Merino1, Garazi Mugertza1, Cristina Ponga1, Imanol Naharro1
1Hospital Galdakao Usansolo Galdakao, Spain, 2Hospital Universitario Araba Vitoria, Spain
Background: The clinical course of COVID-19 range from mild cold-like symptoms to severe illness with acute respiratory distress syndrome and organ failure. The latter is often associated with a higher inflammatory response and platelet hyperreactivity; those patients present a high incidence of venous and arterial thromboembolic events. Immature or reticulated platelets (IPF) are the platelets newly formed by megakaryocytes and released from the bone marrow into the bloodstream. IPF refers to the proportion of immature platelets among the total number of platelets, are hyperreactive and show prothrombotic activity associated with arterial thrombotic events. Mindray BC 6800 Plus analyzer reports IPF as a part of complete blood count; in the reticulocyte channel platelets are enumerated by optical method which uses fluorescent reagent containing cyanine derived dye. IPF fraction is calculated, ranging 0.6%–5.6 % in healthy individuals. Our aim was to assess whether the level of thrombopoiesis, measured by IPF, is associated with the disease severity in COVID-19 patients. Methods: In the period from 1 December 2020 to 30 November 2021 acohort of 419 well-characterized COVID-19-patients was recruited. Venous blood samples were drawn from each patient at time points during hospitalization: on admission to the hospital, 3 days afterwards and on subsequent time point during hospitalization. Categorical variables were described as percentage and for continuous variables median and interquartile range (IQ) values were calculated. COVID-19 severity outcomes were defined as general ward (mild), intensive care unit (ICU) admission (severe), or in-hospital death. chi-squared analysis was used to test COVID-19 severity outcome associations with categorical variables including baseline disease conditions. Kruskal-Wallis test was applied in order to detect statistical differences among groups P <0.05 was deemed to be statistically significant Results: In our cohort median age was 64 years (25–75 IQ, 37–85), 64 % males; 342 patients stayed in general wards while 77 (18.4%) were admitted to ICU; 23 patients died during hospitalization (5.5%). The patients with a mild course showed normal platelet count 286 × 109/L (IQ 168–388 × 109/L) and a short-term increase in median IPF above the upper reference range value, peak value 7.7%. Severe ill patients had median platelet count 90 × 109/L (IQ 44–141 × 109/L), p < 0.001, and the highest peak value for IPF 10.1% (IQ 8.8%–12.6%) from the third day of hospitalization, p < 0.001. The median IPF was higher in ICU patients compared to patients with mild or moderate disease 6.8% (IQR 4.7%–10.6%) versus 3.6% (IQ 2.7%–5.6%) respectively, p = 0.001. Comparison of IPF between survivors and deceased patients revealed a clear difference with significant higher values in deceased (median 9.2%, IQ 4.5%–12.3%) than recovered (5.4%, IQ 2.8%–7.6%) patients, p = 0.001. Elevated IPF at presentation was predictive of ICU admission (P <0.001). Conclusions: in severe COVID-19 the number of platelets decreases while the newly formed immature platelets increases. This increase in IPF was more pronounced in critically ill patients. Elevated initial and peak values of IPF could serve as prognostic biomarkers for COVID-19 progression to severe conditions.
PREDICTION OF THALASSEMIA CARRIERS USING COMPLETE BLOOD COUNT AND ARTIFICIAL INTELLIGENCE ALGORITHM MULTILAYER PERCEPTRON (MLP)
Eloisa Urrechaga1, Monica Fernandez2, Urko Aguirre1, Johannes Hoffmann3
1Hospital Universitario Galdakao Usansolo Galdakao, Spain, 2Hospital Universitario Araba Vitoria, Spain, 3H3L Consult Nuenen, Netherlands
ERYTHROCYTE DEFORMABILITY AND AGGREGATION AS A MARKER OF DIABETES COMPLICATION
Eleni Vagdatli1, Ourania Koukougkeli2, Georgia Variti1, Marianthi Issa1, Stergiani Kyriakidou1, Anna Diamantopoulou1
1Hippokration General Hospital Thessaloniki Greece, 2 P. Zafiropoulos SA Thessaloniki Greece
RED BLOOD CELL MOVING AVERAGE PARAMETERS FOR MONITORING THE INTER- AND WITHIN-LABORATORY PRECISION ON ALINITY HQ
Ludi van Dun2, Alistair Macartney1, Cheryl Barker1
1Norfolk and Norwich University Hospital Norwich, United Kingdom, 2Abbott Diagnostics Wiesbaden, Germany
Introduction: At the laboratories of Eastern Pathology Alliance, the hemocytometry is processed on 10 Alinity hq analyzers over three locations. Every Alinity hq analyzer has 2 dilution blocks resulting in a total of 20 channels that need to be controlled and aligned. For this, commercially available QC material, offered by the manufacturer, is measured twice daily. The error detection rate of this method is directly related to the frequency of QC analysis; this means that a large number of results could be affected by an analytical error before it is detected. Beside this, commercial QC material contains stabilized cells to increase the shelf-life, but these stabilized cells differ from fresh blood in terms of cell size, shape and deformability, and therefore may behave differently. The Alinity hq analyzers are equipped with an extensive moving average program. We investigated if moving average can be used as an additional tool to monitor the analytical quality of results. Methods: To observe the behavior of the moving average data at our three locations, each with a unique patient population, the moving average inclusion criteria for all Alinity hq analyzers were set according the following criteria: HGB 12.0–17.0 g/dL; RBC 3.80–5.50 × 10¹²/L; HCT 0–99%; MCV 70–110 fL; MCH 21.0–35.5 pg; MCHC 30.5–38.5 g/dL and RDW 0.00–15.0%CV. In total 120 batches with an average of 20 samples were collected over a period varying from 12 to 40 days. Moving average results were compared with the internal QC results (tri-level) over a period of 22 days. Results: Average and CV% for HGB was respectively 14.0 g/dL (13.9–14.1) and 0.9 CV% (0.8–1.3), for RBC 4.57 × 10¹²/L (4.50–4.62) and 1.0 CV% (0.8–1.5), for HCT 41.8% (40.6–42.5) and 1.1 (0.8–1.3), for RDW 12.8 CV% (12.5–13.0) and 0.8 CV% (0.5–1.8), for MCV 91.0 fL (89.8–92.2) and 0.8 CV% (0.6–1.0), for MCH 30.4 pg (29.9–30.9) and 0.7 CV% (0.6–1.1), and for MCHC 33.4 g/dL (32.2–34.4) and 0.5 CV% (0.4–1.0). CV% for the internal QC was in close relationship with the studied moving average parameters. Conclusion: We concluded that the moving average QC is a useful method for continuous monitoring of RBC parameters with added value to internal quality control.
WHITE BLOOD CELL MOVING AVERAGE PARAMETERS FOR MONITORING THE INTER- AND WITHIN-LABORATORY PRECISION ON ALINITY HQ
Ludi van Dun2, Alistair Macartney1, Cheryl Barker1
1Norfolk and Norwich University Hospital Norwich, United Kingdom, 2Abbott Diagnostics Wiesbaden, Germany
Introduction: At the laboratories of Eastern Pathology Alliance, the hemocytometry is processed on 10 Alinity hq analyzers over three locations. Every Alinity hq analyzer has 2 dilution blocks resulting in a total of 20 channels that need to be controlled and aligned. For this, commercially available QC material, offered by the manufacturer, is measured twice daily. The error detection rate of this method is directly related to the frequency of QC analysis; this means that a large number of results could be affected by an analytical error before it is detected. Beside this, commercial QC material contains stabilized cells to increase the shelf-life, but these stabilized cells differ from fresh blood in terms of cell size, shape and deformability, and therefore may behave differently. The Alinity hq analyzers are equipped with an extensive moving average program. We investigated if moving average can be used as an additional tool to monitor the analytical quality of results. Methods: To observe the behavior of the moving average data at our three locations, each with a unique patient population, the moving average inclusion criteria for all Alinity hq analyzers were set according the following criteria: WBC 4.00–12.2 × 10⁹/L; Neutrophil 37.0–78.0%; Lymphocyte 12.0–50.0%; Monocyte 0.00–14.5%; Eosinophil 0.00–8.60%; Basophil 0.00–1.50% and Immature Granulocyte 0.00–1.00%. In total 120 batches with an average of 20 samples were collected over a period varying from 12 to 40 days. Moving average results were compared with the internal QC results (tri-level) over a period of 22 days. Results: Average and CV% for WBC was respectively 7.3 × 10⁹/L (6.8–7.8) and 3.2 CV% (2.5–4.0), for Neutrophil 62.1% (60.4–64.3) and 1.9 CV% (1.4–2.4), for Lymphocyte 26.3% (24.2–27.7) and 4.4 CV% (3.2–5.3), for Monocyte 8.4% (8.3–8.5) and 2.7 CV% (2.0–3.5), for Eosinophil 2.2% (2.0–2.4) and 8.1 CV% (5.9–11.2), for Basophil 0.50% (0.39–0.56) and 9.0 CV% (6.5–12.3), and for Immature Granulocyte 0.06% (0.02–0.12) and 49.1 CV% (28.8–75.9). CV% for the internal QC was in close relationship with the studied moving average parameters. Conclusion: We concluded that the moving average QC is a useful method for continuous monitoring of WBC parameters with added value to internal quality control.
PLATELET MOVING AVERAGE PARAMETERS FOR MONITORING THE INTER- AND WITHIN-LABORATORY PRECISION ON ALINITY HQ
Ludi van Dun2, Alistair Macartney1, Cheryl Barker1
1Norfolk and Norwich University Hospital Norwich, United Kingdom, 2Abbott Diagnostics Wiesbaden, Germany
Introduction: At the laboratories of Eastern Pathology Alliance, the hemocytometry is processed on 10 Alinity hq analyzers over three locations. Every Alinity hq analyzer has 2 dilution blocks resulting in a total of 20 channels that need to be controlled and aligned. For this, commercially available QC material, offered by the manufacturer, is measured twice daily. The error detection rate of this method is directly related to the frequency of QC analysis; this means that a large number of results could be affected by an analytical error before it is detected. Beside this, commercial QC material contains stabilized cells to increase the shelf-life, but these stabilized cells differ from fresh blood in terms of cell size, shape and deformability, and therefore may behave differently. The Alinity hq analyzers are equipped with an extensive moving average program. We investigated if moving average can be used as an additional tool to monitor the analytical quality of results. Methods: To observe the behavior of the moving average data at our three locations, each with a unique patient population, the moving average inclusion criteria for all Alinity hq analyzers were set according the following criteria: PLT 115–400 × 109/L and MPV 6.0–11.0 fL. In total 120 batches with an average of 20 samples were collected over a period varying from 12 to 40 days. Moving average results were compared with the internal QC results (tri-level) over a period of 22 days. Results: Average and CV% for PLT was respectively 261 × 109/L (252–270) and 2.8 CV% (2.2–3.4) and MPV 8.1 (7.8–8.3) and 1.5 CV% (1.2–2.0). CV% for the internal QC for the PLT was with 2.8% at a level of 73 × 109/L; 1.9% at a level of 222 × 109/L and 2.1% at a level of 485 × 109/L in close relationship with the studied moving average PLT parameter. CV% for the MPV for the PLT of 73 × 109/L was 1.3 CV%; 0.8 CV% at a level of 222 × 109/L and 0.7 CV% at a level of 485 × 109/L. Conclusion: We concluded that the moving average QC is a useful method for continuous monitoring of PLT parameters with added value to internal quality control.
NEXT GENERATION SEQUENCING IN INHERITED BONE MARROW FAILURE SYNDROMES
Ganesh Kumar Viswanathan, Jasmita Dass, Rishi Dhawan, Mukul Aggarwal, Manoranjan Mahapatra
All India Institute of Medical Sciences (AIIMS) New Delhi, India
BASED ON THE PARAMETERS AND FLAG OF MIND RAY BC-6800, A LABORATORY DIAGNOSTIC MODEL OF HEMORRHAGIC FEVER WITH RENAL SYNDROME WAS ESTABLISHED
Changzheng Wang
Jingzhou Hospital Affiliated to Yangtze University Jingzhou China
AN UNUSUAL PRESENTATION OF HYPERVISCOSITY SYNDROME WITH MONOCLONAL IGM LAMBA
Samuel/SY Wang1, Christina Lai Lin Sum2, Ling Cao1,2,3,5, Robert Charles William Hawkins2, Kian Guan Eric Lim2, Kiat Hoe Ong1,2,3,4,5, Christian Gallardo1,3,5
1Department of Haematology, Tan Tock Seng Hospital Singapore, Singapore, 2Department of Laboratory Medicine, Tan Tock Seng Hospital Singapore, Singapore, 3Lee Kong Chian School of Medicine, Nanyang Technological University Singapore, Singapore, 4Molecular Diagnostic Laboratory, Tan Tock Seng Hospital Singapore, Singapore, 5Yong Lin School of Medicine, National University of Singapore Singapore, Singapore
AN ARTIFICIAL INTELLIGENCE-BASED TOOL FOR MORPHOLOGICAL ANALYSIS OF PERIPHERAL BLOOD CELLS IN PATIENTS WITH CHRONIC LYMPHOCYTIC LEUKEMIA
Yan Wang1,2, Hailing Liu1, Hui Wang1,2, Yujie Wu1,2, Hairong Qiu1,2, Chun Qiao1,2, Lei Cao1, Jianfu Zhang1,2, Jianyong Li1, Lei Fan1, Rong Wang1
1Department of Hematology, Jiangsu Province Hospital and Nanjing Medical University First Affiliated Hospital Nanjing, China, 2Key Laboratory of Hematology of Nanjing Medical University Nanjing, China
MOLECULAR CHARACTERIZATION OF MYELOID NEOPLASMS
Olga Weinberg
UT Southwestern Medical Center
This talk will focus on the latest classifications of myeloid neoplasms, genomic findings and the implications of these new classifications on treatment and patient outcomes. Myeloid neoplasms are a heterogeneous group of disorders that affect the blood and bone marrow, including acute myeloid leukemia and myelodysplastic syndromes. Recent advances in genetic technologies have enabled the identification of new subtypes of myeloid neoplasms, which are associated with different clinical presentations and outcomes. Implication of new classifications on diagnosis and treatment selection, as well as roles in identify patients that are at high risk for developing more aggressive forms of the disease and improve prognosis. The challenges and limitations of these new classifications and how we can work towards further improvements in the management of myeloid neoplasms will also be discussed.
IMMUNO-DIFFERENTIA
Brent Wood
Children's Hospital Los Angeles, USA
PRINCIPLES OF FLOW DETECTION OF MINIMAL/MEASURABLE RESIDUAL DISEASE
Brent Wood
Childrens Hospital Los Angeles
The detection of residual acute leukemia following therapy is the single most prognostic factor identified for the monitoring of patients with these disorders. In North America, flow cytometry is the most commonly used technology for the detection of residual acute leukemia, although next generation sequencing is rapidly being incorporated into clinical practice. However, the detection of small abnormal populations of residual leukemic cells is more technically and interpretatively demanding than diagnostic evaluations. In this talk, the principles of detection of minimal/measurable residual disease by flow cytometry will be discussed.
VISCOLEASTIC TESTING–PROS AND CONS (WEAKNESSES) OF THE TESTING, INCLUDE QUANTRA
Geoffrey Wool
University of Chicago, USA
FDA-approved viscoelastic testing (VET) methodologies have significantly changed in the last ten years, with the availability of cartridge-based VET. Some of these cartridge-based methodologies use harmonic resonance-based clot detection. While VET has always allowed for the evaluation of real-time clot formation, cartridge-based VET provides increased ease of use as well as greater portability and robustness of results in out-of-laboratory environments.
Here we review the use of VET in a variety of clinical contexts, including cardiac surgery, trauma, liver transplant, obstetrics, and hypercoagulable states such as COVID-19. As of now, high quality randomized trial evidence for new generation VET (TEG 6S, Hemosonics Quantra, ROTEM sigma) is limited. Nevertheless, the use of VET-guided transfusion algorithms appears to result in reduced blood usage without worsening of patient outcomes.
Future work comparing the new generation VET instruments and continuing to validate clinically important cut-offs will help move the field of point-of-care coagulation monitoring forward and increase the quality of transfusion management in bleeding patients.
KMT2A AMPLIFICATION IN B LYMPHOBLASTIC LEUKAEMIA
Catherine E Wren1, Patricia Rebeiro2, Elizabeth M Tegg1,3
1Institute of Clinical Pathology and Medical Research, New South Wales Health Pathology, Westmead Hospital Westmead, Australia, 2Blacktown Hospital, Western Sydney Local Health District Blacktown, Australia, 3University of Sydney, Westmead Medical School Westmead, Australia
Introduction: KMT2A gene rearrangements are known to occur in both myeloid and lymphoid leukaemia. KMT2A amplification is rarer and generally reported to occur in only 1% of cases of acute myeloid leukaemia (AML) and is rarely reported in B-lymphoblastic leukaemia (B-ALL). To our knowledge, we present only the second case report of KMT2A amplification with corresponding TP53 deletion in adult de novo CD10 negative B-ALL. Methods: We present a 69 year old male who presented to the emergency department with symptoms of melena, coffee ground vomit, syncope and confusion, on a background of 2 weeks of abdominal pain. A full blood count showed he was pancytopenic with 17% circulating blasts. Flow cytometry and rapid fluorescence in situ hybridization (FISH) testing for BCR::ABL1 gene fusion and KMT2A rearrangement were performed on the peripheral blood to establish the blast cell lineage and further classify the leukaemia. Further FISH testing was also performed for TP53 gene deletion. Results: Flow cytometry testing showed that the blasts were positive for CD45(dim),CD19, CD34, CD38, CD15(variable) and HLA-DR. They were negative for CD3, CD4,CD5, CD7, CD10, CD13, CD20, CD33, CD56, CD64, CD117. Additional markers showed the blasts to be positive for intracellular CD79a, CD22 and to be negative for MPO and intracellular CD3, confirming that the diagnosis was B-ALL. The FISH showed KMT2A amplification with >20 signals per cell. There was no evidence of BCR::ABL1 gene fusion; however, there were 3~4 copies of BCR and 3 copies of ABL1 suggesting aneuploidy for chromosomes 9 and 22. Review of images captured favoured that the KMT2A amplification was localised to intrachromosomal regions and supported the possibility of clonal evolution. Conclusions: Further review of the literature found only 6 papers reporting a total of 7 cases of KMT2A amplification in B-ALL with only 1 adult B-ALL case without a history of previous chemotherapy. In the literature KMT2A amplification has been reported in association with a TP53 gene deletion in AML, but this has also been reported in ALL. FISH for TP53 confirmed that our patient also had a TP53 gene deletion and that a doubling clone exhibiting TP53 deletion was present. Multiplex PCR was negative for TCF3::PBX1, ETV6::RUNX1, KMT2A::AFF1 and BCR::ABL1 gene fusions. Unfortunately no further array or sequencing was performed due to the patient withdrawing from treatment and therefore the presence of other driver mutations for B-ALL were not assessed. This is a fascinating case of KMT2A amplification with associated TP53 gene deletion and clonal evolution in adult de novo precursor B-ALL.
ARTIFICIAL INTELLIGENCE OF DIGITAL MORPHOLOGY ANALYZERS IMPROVES THE EFFICIENCY OF MANUAL LEUKOCYTE DIFFERENTIATION OF PERIPHERAL BLOOD
Ying Xing1, Xuekai Liu2, Juhua Dai3, Xiaoxing Ge5, Qingchen Wang1, Ziyu Hu6, Zhicheng Wu4, Xuehui Zeng7, Dan Xu8, Chenxue Qu1
1Peking University First Hospital Beijing China, 2Aerospace Center Hospital Beijing China, 3Peking University International Hospital Beijing China, 4Peking University Shenzhen Hospital Shenzhen China, 5Beijing Miyun District Hospital, No. 383 Yang Guang Street Beijing China, 6Beijing Nuclear Industry Hospital Beijing China, 7Shenzhen Traditional Chinese Medicine Hospital Shenzhen China, 8Huazhong University of Science and Technology Union Shenzhen Hospital Shenzhen China
Background: Morphological identification of peripheral leukocytes is a complex and time-consuming task, having exceptionally high requirements for personnel expertise. This study is to investigate the role of artificial intelligence (AI) in assisting the manual leukocyte differentiation of peripheral blood. Methods: A total of 102 blood samples that triggered the review rules of hematologyanalyzers were enrolled. The peripheral blood smears were prepared and analyzed by Mindray MC-100i digital morphology analyzers. Two hundred leukocytes were located, and their cell images were collected. Two senior technologists labeled all cells to form standard answers. Afterward, the digital morphology analyzer unitized AI to pre-classify all cells. Ten junior and intermediate technologists were selected to review the cells with the AI pre-classification, yielding the AI-assisted classifications. Then the cell images were shuffled and re-classified without AI. The accuracy, sensitivity, and specificity of the leukocyte differentiation with or without AI assistance were analyzed and compared. The time required for classification by each person was recorded. Results: For junior technologists, the accuracy of normal and abnormal leukocyte differentiation increased by 4.79% and 15.16% with the assistance of AI. And for intermediate technologists, the accuracy increased by 7.40% and 14.54% for normal and abnormal leukocyte differentiation, respectively. The sensitivity and specificity also significantly increased with the help of AI. In addition, the average time for each individual to classify each blood smear was shortened by 215 s with AI. Conclusion: AI can assist laboratory technologists in the morphological differentiation of leukocytes. In particular, it can improve the sensitivity of abnormal leukocyte differentiation and lower the risk of missing detection of abnormal WBCs.
DETECTION AND COMPARISON OF MEMORY T CELL RESPONSE IN PATIENTS WITH LIVER CIRRHOSIS AND HEALTHY HEATH CARE WORKERS AGAINST CHADOX1NCOV-19 VACCINE (COVISHIELD)
Geeta Yadav1, Himanshu Dandu2, Manish Kumar1, Amit Goel3, Harshita Katiyar3, Hardeep Singh Malhotra4, Bipin Puri5
1Department of Pathology, King George's Medical University Lucknow, 2Department of Internal Medicine, King George's Medical University Lucknow, 3Department of Gastroenterology, Sanjay Gandhi Postgraduate Institute of Medical Sciences Lucknow, 4Department of Neurology, King George's Medical University Lucknow, 5Department of Paediatric Surgery, King George's Medical University Lucknow
THE CSAN PRONTO/ATHELAS ONE HEMATOLOGY POINT-OF-CARE IS SUITABLE FOR EVALUATION OF WHITE BLOOD CELL AND NEUTROPHIL COUNTS IN THE OUTPATIENT SETTING
James Yakimec1, Monika Hudoba1,2
1Vancouver General Hospital Vancouver, BC, Canada, 2University of British Columbia Vancouver, BC, Canada
Introduction: Treatment with clozapine requires regular monitoring of the white blood cell and absolute neutrophil counts for optimal patient care. Clients often live in marginalized situations resulting in low compliance with monitoring. To alleviate the strain on the clients, there is a need for a point-of-care (POC) hematology device that provides rapid and reliable results both in general and in cytopenic samples and is suitable for outpatient setting. We evaluated the CSAN PRONTOTM device for WBC and ANC parameters at the ranges 1.1 to 21.3 × 10⁹/L and 0.4 to 15.8 × 10⁹/L respectively. Methods Three point-of-care devices CSAN PRONTOTM were compared with the Sysmex XN9000 in 46 routine venous samples and 3 levels of commercial quality controls, focusing on white blood cells (WBC) and absolute neutrophil count (ANC). Results The CSAN PRONTOTM was less precise compared to the acceptance criteria set for hematology instrument XN9000, with a CV% 3.0–3.7 for WBCs and 3.6–8.4 for ANCs. Correlation coefficient for WBC was r2>0.99 and ANC r2>0.98 for the entire range. Between instrument correlation was >0.99. Between run and within run precision of the instruments was well within manufacturer targets for both WBC and ANC (CV% <7.5% and <20% respectively). Linearity r2 for both parameter was >0.99 in range 1.0–25.0 × 10⁹/L except for positive ANC bias in monocytosis and eosinophilia. Sysmex suspected flags, marked thrombocytosis, high/low hemoglobin, icteric, lipemic samples showed no interference. Conclusions The CSAN PRONTOTM provides rapid and accurate WBC and ANC results, to aid clozapine treatment. The device is easy to operate and can measure both venous and capillary samples. Therefore, the CSAN PRONTOTM is well suited as POC for nurse practitioners and physicians in an outpatient setting.
FUNDAMENTAL INVESTIGATION OF NEUTROPHIL EXTRACELLULAR TRAPS (NETS) DETECTION IN PLATELET ABSORPTION CYTOGRAM USING ADVIA 2120I
Wataru Yamaguchi
Nihon Institute of Medical Science Saitama, Japan
PLT-H, A NOVEL ANTI-INTERFERENCE PLT COUNTING TECHNOLOGY COMBINING IMPEDANCE AND WBC DIFFERENTIAL CHANNELS
Yi Ye1, Gengwen Chen1, Zongjun Liu1, Donglan Yao1, Xiaosen Bian1, Yan Liu1, Keqian Xu2
1R&D, Shenzhen Mindray Bio-Medical Electronics Co. Shenzhen China, 2Xiangya School of Medicine, Central South University Changsha China
Introduction: Accurate platelet counting is crucial for disease diagnosis and treatment. The impedance PLT counting (PLT-I) approach could be interfered with small non-PLT particles in the blood. The fluorescent PLT count methods provide a more accurate but rather costly option. Thus, it is highly desirable to develop an anti-interference PLT counting method without increasing the cost. In this study, we introduced a hybrid PLT counting (PLT-H) strategy that combines the impedance and the conventional WBC differential (DIFF) channel in the Mindray BC-700 series hematology analyzer. We explored the principle behind PLT-H and evaluated the accuracy of this new technology. Methods: In our preliminary studies, we found that the common interferences affecting the PLT-I count were larger than 10 fL, which was then utilized as the borderline PLT size to measure the PLTs in the impedance channel. We selected blood samples with known interferences and measured the PLT count with both impedance and CD41/CD61 immunoplatelet (immunoPLT) reference methods, and then the PLT counts were compared by size to investigate the accuracy of PLT-I. We also explored the possibility to count PLTs larger than 10 fL in the DIFF channel. The morphology of PLTs treated with the hemolytic agents was observed with phase contrast and electron microscopies. And then the PLTs were measured and compared by size with both DIFF channel and immunoPLT. Finally, the accuracy of PLT-H was assessed by comparing it with the reference method in blood samples with interfering factors. Results: We found that there was no significant difference between PLT-I and immunoPLT for PLTs smaller than 10 fL in the interfering blood samples. After treatment with the hemolytic agent, PLTs preserved intact cellular structures, while RBCs were lysed into tiny particles smaller than 7.5 fL. The DIFF channel scatter plot showed a clearly defined region of PLTs, indicating PLTs could be counted in the DIFF channel. For PLTs larger than >10 fL, the PLTs counts from the DIFF channel showed a good correlation with immunoPLT. Furthermore, total PLTs measured with PLT-H in the BC-700 series hematology analyzer correlated well with the reference method (r = 0.9911) for blood samples with varying interfering factors. Conclusions: PLT-H provides a novel and accurate strategy by combining traditional PLT counting methods. It is not only an anti-interference PLT counting method but also economic-friendly since it did not add additional channels and reagents, which offers another option for hematology laboratories.
UNSTAINED WHITE BLOOD CELL CLASSIFICATION USING DEEP LEARNING
Hui Yu1,2, Frank Forster3, Adarsh Bhandary Panambur1,2, Anna Merino4, Andreas Maier1, Gaby Marquardt2
1Pattern Recognition Lab, Friedrich-Alexander-Universität Erlangen-Nürnberg Erlangen, Germany, 2Siemens Healthcare GmbH, Center for Innovation in Diagnostics Erlangen, Germany, 3Siemens AG Munich, Germany, 4Hospital Clinic de Barcelona Barcelona, Spain
NASCOLA PLATELET EQA
Nicole Zantek
University of Minnesota
External quality assessment (EQA), also known as proficiency testing, provides laboratories insight into the accuracy of their testing. Providing EQA material for platelet function testing creates unique challenges due to the need for fresh platelets. EQA providers have used multiple strategies to assess phases of platelet function testing. The North American Specialized Coagulation Laboratory Association (NASCOLA) in conjunction with ECAT Foundation offers post analytical surveys for platelet aggregation and dense granule testing. This session will discuss the knowledge learned from these platelet surveys.
DEVELOPMENT OF A NEURAL NETWORK HEMATOLOGY REVIEW MODEL BASED ON SCATTER PLOT FEATURES
Shihong Zhang1, Jing Lin2, Rong Ding3, Xiaohe Zheng1, Jin Du4, Xiaosen Bian4, Donglan Yao4, Yan Liu4, Guofang Shu3
1The First Affiliated Hospital, Sun Yat-sen University Guangzhou China, 2The First People's Hospital of Foshan Foshan China, 3Zhongda Hospital Southeast University Nanjing China, 4Department of Clinical Research & Medical Affairs, Shenzhen Mindray Bio-Medical Electronic Co., Ltd. Shenzhen China
Background. Every hematology testing laboratory should establish appropriate hematology criteria and minimize the review rate without compromising the quality of the blood tests. The International Consensus Group for Hematology Review developed guidelines for action following automated hematology analysis in 2005. However, widespread implementation has been challenging due to its high review rate. This study aims to use artificial intelligence algorithms to develop a neural network hematology review model based on scatter plot features for accurate screening of samples requiring manual review. Methods:. We collected 8743 test samples from routine laboratory work for AI algorithm development and optimization and another 5809 samples for algorithm validation (AI group). These samples were also estimated using the International Consensus Group for Hematology Review guidelines (consensus group). All samples were run on the BC-6800 Plus hematology analyzer and validated by blood smears on the MC-80 hematology cell morphology analyzer. The blood samples were classified as “positive” or “negative” based on the ISLH criteria for positive smears. The slide review rate, false negative (FN) rate, and false positive (FP) rate were analyzed. Results:. Of the 5809 samples collected for validation, 903 were positive (15.5%). The AI group showed a significantly lower FP rate (7.8%) and a significantly lower review rate (23.3%) than the consensus group (19.9% and 35.4%, respectively, P <0.01). The AI algorithm was developed based on the features extracted from the scatter plot, and it only recognizes blood samples with more significant abnormalities, leading to fewer FP samples. The FN rate was slightly higher for the AI group (3.1% vs. 1.2%, P <0.01). We did a detailed analysis of the FN samples, and no samples with blasts or promyelocytes were missed in either group. The FN samples missed by both groups include samples with low myelocytes and metamyelocytes (<5%) (consensus: 59 samples vs. AI: 151 samples) and low NRBCs (<3%) (consensus: 4 samples vs. AI: 19 samples). A 7 samples with 5-10% of myelocytes and metamyelocytes were missed by the AI but not the consensus group. None of the FN samples had any impact on medical decision-making. Conclusion:. The scatter plot feature-based neural network review model is more advantageous for screening abnormal samples. It did not miss any clinically critical abnormal cells (e.g., blasts), which significantly improves manual review efficiency while ensuring test quality. It is a valuable hematology review model for hematology laboratories with large sample sizes.
A NEW HEMATOLOGICAL PARAMETER FOR SEPSIS DIAGNOSIS IN THE EMERGENCY DEPARTMENT: A SINGLE-CENTER RETROSPECTIVE STUDY
Xiaohe Zheng1, Yating Zhao1, Zhenrong Yao1, Dong Wang1, Shiyao Pan2, Yushuai Ma2, Zena Huang3, Manman Ye1, Yan Liu2, Shihong Zhang1
1Department of Laboratory Medicine, The First Affiliated Hospital, Sun Yat-sen University Guangzhou China, 2Department of Clinical Research & Medical Affairs, Shenzhen Mindray Bio-Medical Electronic Co.Ltd. Shenzhen China, 3Yunkang School of Medicine and Health, Nanfang College Guangzhou China
Background: Sepsis is an organ dysfunction syndrome caused by a dysregulated host response to infection. Due to the lack of specific diagnostic indicators, sepsis seriously affects the early treatment and causes high mortality. The new-generation hematology analyzers could obtain the characteristic information of the peripheral blood cell volume, cell internal complexity, and nucleic acid content, and then automatically outputs the quantitative detection parameters of cell morphology, thereby reflecting the infection degree of the body. In this study, a parameter was developed based on the morphological parameters provided by the hematology analyzer to screen sepsis. Methods: The training set included 515 patients admitted to the Emergency Department of the First Affiliated Hospital of Sun Yat-sen University that met the study's eligibility criteria. The patients were divided into sepsis (136 patients) and non-sepsis group (379 patients) based on the sepsis 3.0 criteria and the patient condition on admission day. The morphological parameters of WBCs were collected and analyzed with the binary logistic regression analysis. A diagnostic hematological parameter of sepsis (HPS) was developed based on the training set and evaluated with a validation cohort of 231 patients. The diagnostic performance of HPS was analyzed with ROC curves and compared with C-reactive protein (CPR) and procalcitonin (PCT) in sepsis diagnosis. Results: In the training set, the age of the sepsis group patients was 64 years (61–67), and that of the non-sepsis group was 61 years (58–63), with no significant statistical difference (P > 0.05), indicating that the difference was balanced and comparable. Binary logistic regression analysis showed that Neu_Y (the fluorescent light of neutrophils) and Mon_XW (particle distribution width of monocytes in the side scattered light direction) were the two significant parameters, and the diagnostic parameter HPS was established based on them. HPS showed a high sepsis diagnostic value, with an area under the ROC (AUC) of 0.862, a sensitivity of 70.0%, and a specificity of 87.1%. It is superior to the routine clinical parameters CRP (AUC 0.689, sensitivity 54.4%, and specificity 73.9%) and PCT (AUC 0.829, sensitivity 70.6%, and specificity 79.9%). The positive predictive value of HPS for the sepsis diagnosis was 70.3% in the validation cohort, which was similar to that in the training cohort at 66.0%. Conclusion: The HPS model improved the diagnostic performance of sepsis to some extent and could be used for early and rapid diagnosis of sepsis in the Emergency Department.


