Biologic characterization of atypical chronic lymphocytic leukaemia
FUNDING INFORMATION
Qatar National Research Fund, Hamad Medical Corporation.
We would like to thank you for the opportunity to respond to the issues raised in Dr Sorigue et al letter and we would also like to thank Dr Sorigue and his colleagues for their interest in our recently published paper,1 their positive correspondence and for taking the time to express their valuable opinions.
Our recent article had concluded that LEF-1 expression is downregulated in cases of CLL with atypical immunophenotypic or morphologic findings compared to classic CLL.
Dr Sorigue and his team had raised several important and interesting points to be discussed.
We totally agree with Dr Sorigue on his view, regarding the presence of a proportion of cases classified as atypical CLL and had clearly shown a number of different biologic markers which would not fit into specific category of small B-cell lymphomas and would match cases of borderline LPD mentioned by Dr Sorigue2, 3 and his group.
Cases classified as atypical CLL in our cohort did not show any morphologic/histopathologic/cytogenetic features convincing for a specific type of low grade B-cell lymphomas other than CLL. All the cases included within this group had Cyclin D1 expression/rearrangement excluded by either immunohistochemistry, FISH or both which would exclude cyclin D1-positive MCL. SOX-11 was also performed in cases of aCLL which had a diagnostic tissue (BM/LN) and found to be negative.
In our centre, we are frequently challenged with a significant proportion of cases of atypical CLL, which exhibit a number of atypical cytologic or immunophenotypic features.
Based on the results of our recently published data,1 that clearly showed a significantly higher level of expression of LEF-1 in CLL with typical features compared to aCLL; chi-Square P < .0001.1 It is apparent that we share similar opinion goals with Dr Sorigue and his colleagues regarding the added value of including LEF-1 (in addition to the list suggested by Dr Sorigue) as an additional useful marker to differentiate between standard-phenotype CLL and atypical CLL/unclassifiable LPD.
A correlation between different clinical and pathologic features of typical CLL compared to atypical CLL (aCLL) are summarized in Table 1.
| CLL (n = 42) | Atypical CLL, CLL/PLL (n = 24) | P-Value | |
|---|---|---|---|
| Age | 61.17 ± 9.25 | 61.13 ± 11.70 | .986 |
| Gender | |||
| Male | 30 (73.2%) | 22 (91.7%) | .072 |
| Female | 11 (26.8%) | 2 (8.3%) | |
| Mean Matutes Score | 4.68 ± 0.47 | 3.26 ± 0.92 | <.0001 |
| CD200 | 29/31 (93.6%) | 14/17 (82.4%) | .225 |
| CD38 | 9/41 (22%) | 10/21(47.6%) | .038 |
| Trisomy 12 | 6/40 (15%) | 11/21(52%) | .002 |
| Del 13 q | 14/34 (41.1%) | 3/17 (17.7%) | .118 |
| LEF-1 positive expression by IHC | 21/22 (95.5%) | 6/13 (46.2%) | .007 |
| LEF-1 positive expression by FCM | 18/22 (81.8%) | 7/14 (50%) | .043 |
| LEF-1 positive expression by either IHC or FCM | 37/40 (92.5%) | 13/24 (54.2%) | .001 |
Note
- The percentage values computed (using non-missing values) includes together positive and partial for CD200, CD38, Del13 q.
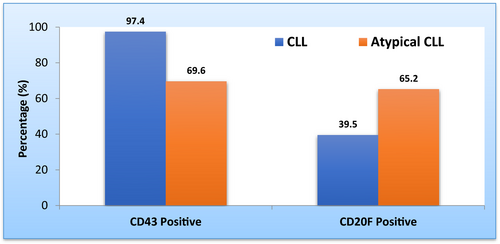
In our published study, we did not look for the difference in expression of CD20 and CD43 between CLL and atypical CLL. However, we performed the complementary analyses required by Dr Sourigue. The statistical analysis was performed using chi-square test indicated that patients with atypical CLL showed a significantly lower percentage of CD43 positivity compared to CLL group (69.6% vs 97.4%, P = .002). In contrast, CD20 expression by flow cytometry was significantly higher in patients with atypical CLL compared to CLL patients (65.2% vs 39.5%, P = .047). Furthermore, we used logistic regression method to quantify association between CD43 and CD20 expression by flow cytometry in CLL and atypical CLL. This statistical analysis revealed that CD43 expression was lower in atypical CLL (odds ratio 0.06, 95% CI 0.01, 0.53) whereas the intensity of expression of CD20 was found to be more than twofold higher in atypical CLL compared to CLL patients (odds ratio 2.87, 95% CI 1.0, 8.22) as shown in Table 2 and Figure (1). Unfortunately, our study did not include CD81 and ROR1 markers, so we could not comment on them. In conclusion, we ultimately agree with Dr Sorigue views,3 regarding the need to specifically characterize the diagnostic criteria of the redundant category of “atypical CLL/unclassifiable LPD” through finding a number of biologic markers that could be useful to formulate a well-standardized definition of this category in order to be included it as a separate entity in WHO diagnostic classification. Based on our previous, results about LEF-1 expression in CLL and aCLL1 and concurring with Dr Sourigue results we concluded that LEF-1, CD43, CD20 and trisomy 122, 4, 5 could be used as differentiating markers between classic CLL and a CLL/ border line LPD.
| Diagnosis | Chi-square value | Odds ratio (OR)a | 95% CI for OR | P-value | ||
|---|---|---|---|---|---|---|
| CLL | Atypical CLL | |||||
| CD43 | ||||||
| Positive | 38 (97.4%) | 16 (69.6%) | 10.1 | 0.06 | 0.01, 0.53 | .002 |
| Negative/Partial | 1 (2.6%) | 7 (30.4%) | ||||
| CD20F | ||||||
| Positive | 17 (39.5%) | 15 (65.2%) | 3.96 | 2.87 | 1.0, 8.22 | .047 |
| Negative/Partial | 26 (60.5%) | 8 (34.8%) | ||||
- a CLL group was considered as reference group while computing odds ratio values using Logistic regression method, CI, Confidence interval.

DATA AVAILABILITY STATEMENT
The data that support the findings of this study are available from the corresponding author upon reasonable request.
STATEMENT OF ETHICS
The study was approved by HMC ethics committee on human research (Medical Research Centre-MRC).
CONFLICT OF INTEREST
The authors have no conflict of interest to disclose.


