Recombinant full-length factor VIII (FVIII) and extended half-life FVIII products in prophylaxis – new insight provided by pharmacokinetic modelling
Summary
The pharmacokinetics (PK) of extended half-life factor VIII (FVIII) products might allow longer dosing intervals in prophylaxis, potentially affecting its efficacy. We used published population PK models of a recombinant full-length FVIII (rAHF-PFM) and a recombinant B-domain-deleted FVIII Fc fusion product (rFVIIIFc) to assess the time spent weekly with FVIII levels below 3 IU dL−1 or above 10 IU dL−1. These FVIII levels were chosen based on the observation that trough levels of 1 IU dL−1 may not be sufficient in all patients. This approach was applied to a simulated population of 1000 severe haemophilia A subjects with dosing regimens included in the prescribing information or evaluated in clinical trials. FVIII levels remained ≥3 IU dL−1 in 57% of patients treated with rAHF-PFM 30 IU kg−1 every 48 h compared with 41.1%, 18.3%, 0.9% and 0% of patients treated with rFVIIIFc 30 IU kg−1 every 72 h, 50 IU kg−1 every 96 h or 120 h and 65 IU kg−1 every 168 h respectively. Patients on rAHF-PFM 30 IU kg−1 every 48 h spent more time weekly with FVIII levels above 10 IU dL−1 than those on rFVIIIFc 50 IU kg−1 every 96 h or 120 h, and 65 IU kg−1 every 168 h. In conclusion, PK modelling indicates that choice and dosing intervals of standard and extended half-life FVIII products require careful evaluation of individual PK to allow more time at protective levels, especially in patients with active lifestyles.
Introduction
Prophylactic, regular and prolonged administration of clotting factor concentrates represents the mainstay of modern haemophilia management since it has been proven to be effective in preventing bleeding and thus development of haemophilic arthropathy 1-3. This premise is based on the observation that patients with mild/moderate haemophilia (i.e. with residual plasma coagulation factor levels ≥1%) bleed less frequently and show lower and/or delayed occurrence of arthropathy 4. Regular administration of factor concentrates every 2–3 days therefore aims to maintain a factor trough level of ≥1%. This level was probably selected for existing economics and treatment protocol burden (venous access and frequency of dosing) 5.
The aim of prophylaxis simply to reduce bleeding frequency in haemophilia has been progressively disputed and extended to include prevention of all spontaneous bleeding events. Animal models and epidemiological data show that every single bleed matters, being the potential cause of irreversible damage when it occurs in the brain or joints 6.
However, a trough level of 1% might be too low to prevent all bleeds, particularly in patients with active lifestyles or in those with already established joint damage. It has been shown that joint bleeds are absent in patients with endogenous factor VIII (FVIII) levels approaching 12%. Patients with low baseline FVIII levels (<3%) seem to have the highest risk for joint bleeds and those with clotting factor activity levels of 10% and higher seem to have a very low risk 4. Already in 1965 Ahlberg showed that in patients on prophylaxis with plasma trough levels above 3% arthropathy was rare and milder 7.
Factor VIII levels after intravenous infusion do not remain constant but peak immediately after infusion and rapidly decrease over time, according to the pharmacokinetics (PK) of the drug. In fact, activity-time profiles of FVIII products after a single dose can be characterized using a two-compartmental model and described by two phases: a relatively short, steeply sloping phase, where distribution is dominant, followed by a relatively longer, gently sloping phase, where elimination is dominant. Thus, patients spend a few hours at relatively high FVIII levels and more time at relatively low levels.
In line with this observation, patients who spent more time at low FVIII levels were found to be at higher risk of bleeding 8. Likewise, it was recently reported that more time spent at higher FVIII levels was associated with lower annual bleeding rates 9.
Accordingly, the individual PK response to FVIII concentrates plays an important role in protecting a patient from bleeding while varying greatly among patients 10, which calls into question weight-based dosing to predict the time spent above defined FVIII threshold levels. These findings prompted Collins and colleagues to state that knowledge of individual patients’ half-lives, in association with their bleeding pattern, might allow more cost-effective and better tailored regimens to be used 10.
To reduce the human and economic burden of generating individual PK information, population PK models provide a valuable approach to overcome these limitations. In fact, population pharmacokinetic (PopPK) models seek to identify the measurable factors that cause changes in the dose–concentration relationship and the extent of these changes, so that dosage can be appropriately modified 11. These PK models are developed using individual PK data from multiple patients/studies and should be validated for their predictability. In contrast to traditional pharmacokinetic evaluation, the population PK approach encompasses inter- and intraindividual variability and allows to identify demographic, pathophysiological, environmental or concomitant drug-related factors (covariates) that may influence the pharmacokinetic behaviour of a drug 11. Consequently, population PK models may help to guide the choice of prophylaxis regimens for each individual patient in routine clinical practice, based on covariates only.
New products with extended half-lives (EHL) that aim to increase patient convenience by reducing the number of infusions are becoming available 12. These products may allow less frequent dosing due to their distinct PK profiles. However, less frequent infusions may cause longer time periods at relatively low FVIII levels and thus compromise their efficacy in preventing bleeding when dosed in this manner.
To determine the effect of EHL-FVIII products on circulating FVIII levels, we compared the time spent below and above specific FVIII threshold levels in a theoretical population of 1000 model patients treated with a recombinant third-generation full-length DNA, plasma and albumin-free FVIII [antihaemophilic factor (recombinant) – rAHF-PFM] 13 and a recombinant B-domain-deleted FVIII Fc fusion product (rFVIIIFc) 14 by evaluating their PK profiles.
Materials and methods
We used as examples of standard and EHL-FVIII products respective PopPK models of rAHF-PFM and rFVIIIFc. The considered PopPK models are the only two published for FVIII. They have been built independently and separately and are characterized by different covariates. The structural PopPK models for rAHF-PFM 15 and rFVIIIFc 16 are two-compartmental models with the primary PK parameters being clearance (CL), volumes of distribution of the central and peripheral compartment (V1, V2), and intercompartmental clearance (Q). The model for rAHF-PFM uses body weight and age as covariates on clearance and body weight as covariate on V1 and V2. The model for rFVIIIFc uses von Willebrand factor (VWF):Ag as covariate on clearance and body weight and haematocrit as covariates on V1. Table 1 shows the reported fixed effects for both PopPK models with relationships to the corresponding covariates.
| Parameter | rAHF-PFM 16 | rFVIIIFc 15 |
|---|---|---|
| CL (mL h−1) | 193 · (bw/56)0.80 · [1 − 0.0045 · (age-22)] | 165 · (VWF/118)−0.343 |
| V1 (mL) | 2220 · (bw/56)0.95 | 3750 · (bw/73)0.382 · (hct/45)−0.419 |
| V2 (mL) | 730 · (bw/56)0.76 | 692 |
| Q (mL h−1) | 147 | 7.46 |
- PK, pharmacokinetics; age, age in years; bw, body weight in kg; hct, haematocrit in per cent; VWF, von Willebrand factor:Ag in U dL−1.
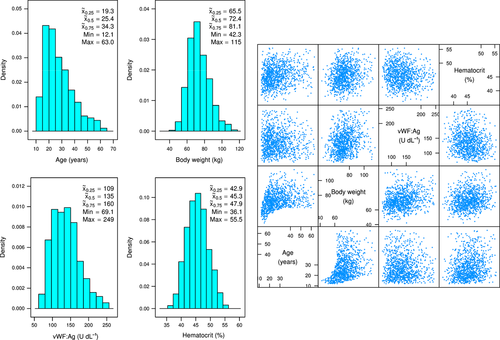
A theoretical population of severe haemophilia A subjects was specified regarding age, body weight, baseline VWF:Ag and haematocrit based on historical clinical data and expert knowledge using a truncated multivariate log-normal distribution. A random sample of 1000 subjects, each characterized by age, body weight, baseline VWF:Ag and haematocrit was generated from this theoretical population using R function rtmvnorm of R package tmvtnorm 17, as displayed in Fig. 1. The figure shows location, dispersion and the correlation structure of the four covariates in the 1,000 simulated subjects.

The PopPK models for rAHF-PFM and rFVIIIFc, parameterized in terms of macro constants 18, were applied to each of the 1000 simulated subjects for the different dosing scenarios in Table 2, for a treatment period of 1 year. We chose only dosing regimens that were previously tested in published clinical trials 19 and/or are currently present in the approved prescribing information 20, 21.
| FVIII product | Dose (IU kg−1) | Dosing intervals (h) |
|---|---|---|
| rAHF-PFM | 30 | Every second day (48) |
| rFVIIIFc | 30 | Every third day (72) |
| rFVIIIFc | 50 | Every fourth day (96) |
| rFVIIIFc | 50 | Every fifth day (120) |
| rFVIIIFc | 65 | Every seventh day (168) |
Concentrations after multiple doses were determined according to Byers and Sarver 22, assuming linear PK. Each subject-specific concentration–time curve following multiple doses of rAHF-PFM and rFVIIIFc was subsequently examined as to their yearly time below 3 IU dL−1 and yearly time above 10 IU dL−1, both obtained numerically by discretizing the time-axis over the range of 1 year in intervals of 0.01 h. The subject-specific weekly times below 3 IU dL−1 and weekly times above 10 IU dL−1 were subsequently obtained by multiplying the corresponding subject-specific yearly times by 7/365.25.
The optimal trough level during prophylaxis is still a matter of debate since it depends on several different patient specific variables (e.g. age, joint status, level of physical activity). Therefore, thresholds of 3 and 10 IU dL−1 were chosen in accordance with previously published evidence indicating that (i) a trough level of 1% (1 IU dL−1) may not be sufficient to prevent bleeds and chronic arthropathy in all patients 4, 7 and (ii) that patients with FVIII levels above 10% had a very low risk for joint bleeds 4. Recently it was proposed that prophylaxis should aim for a trough a level of 3% instead of 1% 5.
All analyses were performed with R version 3.0.2 (R Core Team, 2013) 23.
Results
Location, dispersion and the correlation structure of considered covariates (age, weight, haematocrit and VWF antigen) for the 1000 simulated patients are shown in Fig. 1. The simulated population had a median age of 25.4 years (min–max: 12.1–63.0 years), a median body weight of 72.4 kg (min–max: 42.3–115 kg), a median haematocrit of 45.3% (min–max: 36.1–55.5%) and a median VWF:Ag of 135 U dL−1 (min–max: 69.1–249 U dL−1).
The geometric means among the 1000 theoretical subjects regarding incremental recovery, clearance and mean residence time based on these PopPK models were 2.47 (IU dL−1)/(IU kg−1), 3.18 mL h−1 per kg and 16.15 h with rAHF and 1.93 (IU dL−1)/(IU kg−1), 2.18 mL h−1 per kg and 27.91 h with rFVIIIFc which are in line the reported geometric means of these parameters presented in Mahlangu et al. 19 estimated based on N = 28 subjects.
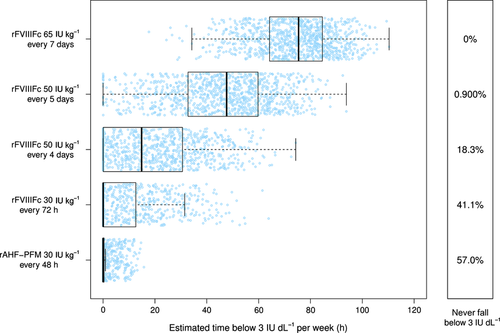
Evaluation of the PK profiles of the 1000 simulated patients showed that 30 IU kg−1 of rFVIIIFc administered every third day provided FVIII levels that did not drop below 3 IU dL−1 in 41.1% of patients compared with 57.0% of patients treated with rAHF-PFM 30 IU kg−1 every second day. With rFVIIIFc 50 IU kg−1 administered every 4 and 5 days, and 65 IU Kg−1 every 7 days, only 18.3%, 0.90% and 0% of patients, respectively, had FVIII levels which did not drop below 3 IU dL−1. The expected median time spent weekly below 3 IU dL−1 FVIII in the remaining patients was longer for those treated with rFVIIIFc at all dosing regimens than for those treated with rAHF-PFM (Table 3 and Fig. 2). Moreover, the interquartile ranges (IQRs), which represent the distributions of the expected individual times spent below 3 IU dL−1, were wider with rFVIIIFc than with rAHF-PFM, which may indicate a larger variability in PK response (Table 3 and Fig. 2).
| Product and dosing | Median | Limits of the middle 50% of the data (IQR limits)a | Range of the middle 50% of the data (IQR)a | Limits of the middle 95% of the datab | Range of the middle 95% of the datab |
|---|---|---|---|---|---|
| Hours spent weekly with FVIII levels below 3% | |||||
| rAHF-PFM 30 IU kg−1 every 48 h | 0 | 0–0.36 | 0.36 | 0–10.7 | 10.7 |
| rFVIIIFc 30 IU kg−1 every 72 h | 0.05 | 0–12.6 | 12.6 | 0–41.0 | 41.0 |
| rFVIIIFc 50 IU kg−1 every 4 days | 14.9 | 0.07–30.6 | 30.53 | 0–54.8 | 54.8 |
| rFVIIIFc 50 IU kg−1 every 5 days | 47.7 | 32.8–59.8 | 27.0 | 3.68–78.6 | 74.92 |
| rFVIIIFc 65 IU kg−1 every 7 days | 75.4 | 64.2–84.6 | 20.4 | 42.5–98.8 | 56.3 |
| Hours spent weekly with FVIII levels above 10% | |||||
| rAHF-PFM 30 IU kg−1 every 48 h | 98.9 | 95.0–104 | 9.0 | 89.0–118 | 29.0 |
| rFVIIIFc 30 IU kg−1 every 72 h | 99.3 | 88.1–113 | 24.9 | 70.9–141 | 70.1 |
| rFVIIIFc 50 IU kg−1 every 4 days | 94.2 | 84.3–106 | 21.7 | 69.0–130 | 61.0 |
| rFVIIIFc 50 IU kg−1 every 5 days | 74.6 | 67.0–83.8 | 16.8 | 54.9–102 | 47.1 |
| rFVIIIFc 65 IU kg−1 every 7 days | 59.1 | 53.2–66.1 | 12.9 | 44.0–80.0 | 36.0 |
- a Middle 50% of data [interquartile range (IQR)]: 25th–75th percentile.
- b Middle 95% of data: 2.5th–97.5th percentile.

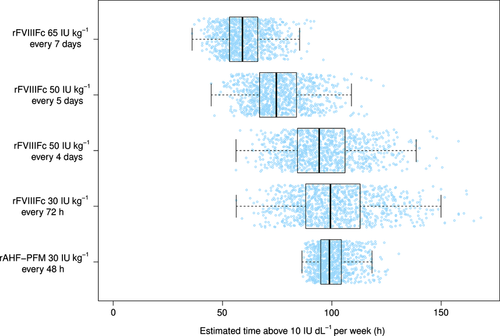
Patients on rFVIIIFc at any dosing regimen exhibited more variability in the expected time spent weekly above 10 IU dL−1 compared with rAHF-PFM (30 IU kg−1 every 48 h) (Table 3 and Fig. 3). Weekly time spent above 10 IU dL−1 was shorter with rFVIIIFc 50 IU Kg−1 every fourth and fifth day, and 65 IU Kg−1 every seventh day than with rAHF-PFM 30 IU Kg−1 every second day. Patients treated with rFVIIIFc 30 IU Kg−1 every third day showed a similar expected median time spent weekly with FVIII levels above 10 IU dL−1 (Table 3 and Fig. 3).

Discussion
Prophylaxis in patients with haemophilia is aimed to prevent bleeding episodes and haemarthroses that can lead to crippling haemophilic arthropathy. Evidence from in vitro, animal, and clinical studies clearly indicates that very few haemarthroses into the same joint – an ABJR of 2 to 3 – may cause irreversible, progressive structural changes in the joint that adversely impacts physical functioning 6. However, targeting patients to a FVIII trough level of 1% may be insufficient in all patients to prevent the majority of bleeding episodes. In fact, a trough level of 1% was shown by clinical trials to be insufficient to protect all patients from all spontaneous bleeding events 19, 24-26. There is probably no lowest one-size-fits-all trough level during prophylaxis because it depends on several different patient specific variables (e.g. joint status, level of physical activity). This hypothesis is further supported by an analysis of prospective clinical trials showing a correlation between bleeding occurrence and time elapsed after infusion 8. These findings suggest that patients with severe haemophilia treated prophylactically could benefit from more time spent at higher FVIII levels, even though further clinical evidence is required. FVIII trough levels are an important component, but not the only relevant variable, that contributes to the bleeding phenotype: peaks, areas under the curve, adherence, joint health, lifestyle, activity levels and probably many others can influence bleeding tendency. Clinical trials on different factor VIII products carried out so far have shown similar capability of bleeding prevention as measured by annualized bleeding rate, but they dealt with different populations, different population sizes and different criteria in annualizing bleeding rate, etc. The introduction of EHL-FVIII products to treat patients with haemophilia will allow longer intervals between infusions, yet also should induce treating physicians to consider how long the patient will be at low FVIII levels before the next administration.
We conducted a study to determine the time spent with FVIII levels below 3 IU dL−1 or above 10 IU dL−1 in 1000 simulated patients. These levels were chosen according to the observations in patients with mild haemophilia showing that those with endogenous FVIII levels below 3% were at high risk of bleeding and consequently of arthropathy, while those with levels above 10% had a significantly lower risk 4. Moreover, Ahlberg looking at the Swedish cohort of patients on prophylaxis suggested that a FVIII trough level of about 3% would be enough to lower the incidence of arthropathy in most cases 7. The dosing regimens we evaluated were the same tested in published clinical trials and/or currently present in the approved prescribing information) 19-21. Our results indicate that – although median values were similar – more patients treated with rFVIIIFc 30 IU kg−1 given at 1.5-fold longer intervals (72 h) can be expected to spent more time weekly with FVIII levels below 3 IU dL−1 and less time above 10 IU dL−1 than patients receiving the same dose of a standard rFVIII every 48 h, due to the higher variability in the individual results. Patients treated with higher doses of a rFVIIIFc (50 IU Kg−1) at longer intervals (96, 120 and 168 h) are expected to spent even more time weekly with FVIII levels below 3 IU dL−1 and less time weekly above 10 IU dL−1. Moreover, variability in PK responses found with rFVIIIFc may indicate a high variability in the expected individual time spent by patients at specific FVIII levels.
These findings suggest that EHL-FVIII products can be administered less frequently; however, patients treated prophylactically with these products at intervals of 72 h or longer may benefit from relatively high FVIII levels for less time weekly than with standard rFVIII products administered every 48 h. Perhaps those patients who still bleed on standard prophylaxis aimed to maintain FVIII levels above 1% could benefit from higher trough levels, which may be achieved with EHL products administered at the same (shorter) time intervals of standard FVIII products. Clinical trials are required to investigate whether this hypothesis holds and if such an approach is able to increase the percentage of patients with low or zero bleeding count.
This is the first indication of the influence of PK of standard and extended half-life FVIII products on time spent at different FVIII threshold levels during prophylaxis. Although our evaluation was based on modelling and not on direct observation, we used real data from clinical observations and published population PK models. A corresponding clinical trial using an AB/BA cross-over design would require a very large sample size, which is difficult to achieve, and an extremely demanding protocol for the patients. The strength of this study lies in its rigorous methodology taking interindividual differences of the covariates into account.
In conclusion, our study suggests that prophylaxis with EHL-FVIII products administered at longer intervals to be more convenient in terms of overall number of injections can potentially expose some patients to longer time with relatively low FVIII levels. This could be less effective in protecting patients from bleeding, at least at the dosing regimens used in clinical trials published to date. The success of prophylaxis is strongly associated to the ability of patients to comply with the demanding schedule of infusions. The modelling used in this study considered all patients compliant to the regimens evaluated. This can represent a weakness in extrapolating the results to a real-world situation. In fact, it still needs to be shown, if longer intervals between infusions will have a positive effect on adherence and compliance.
Hence, an accurate choice of products and prophylaxis regimens (dose and intervals) are necessary to provide an individualized therapy tailored to individual PK responses and individual characteristics, such as bleeding phenotype, adherence, physical activity and joint status.
Acknowledgement
The Authors thank Karima Benamara (Baxter Innovations GmbH, Vienna, Austria) for her help in reviewing the language. A. Gringeri contributed to the concept and design of the study, interpretation of the analyses and co-wrote the manuscript. M. Wolfsegger contributed to the concept and design of the study, performed the modelling and theoretical patient generation and performed the analysis and contributed to the interpretation of the results. K. Steinitz contributed to concept and design of the study, interpretation of the analyses and co-wrote the manuscript. A. J. Reininger contributed to the concept and design of the study, interpretation of the analyses and critically revised the manuscript.
Disclosures
All Authors are employees of Baxter Innovations GmbH, Vienna, Austria.


