How many food items must be consumed to meet the recommended dietary protein intake for older Japanese adults?
In humans, muscle mass and strength begin to decline after the age of 30.1 We previously reported a dose–response relationship between protein intake and muscle mass through a systematic review and meta-analysis that examined the effects of protein intake on lean body mass.2 The Dietary Reference Intake for Japanese (2020) set the recommended dietary allowance (RDA: covers the needs of 97.5% of the population) for protein intake for older adults aged ≥65 years at 60 g/day for males and 50 g/day for females. The 2012 National Health and Nutrition Survey in Japan (NHNS-J) reported that approximately 20% of middle-aged and older adults had a protein intake of less than 1.0 g/kg body weight/day.3 A systematic review published in 2021 reported that dietary diversity is a useful measure of dietary adequacy.4 Dietary diversity has been associated with better physical performance in older Japanese adults.5 However, to the best of our knowledge, there is no reported cut-off of the number of food items needed to meet the RDA for protein intake for older adults. The purpose of this study was to clarify these relationships regarding Japanese adults aged ≥65 years.
We used data pertaining to 143 older adults (78 males and 65 females) aged 65–88 years who participated in the Kyoto–Kameoka Study in Japan and kept a dietary record (DR) for seven consecutive days, from May to June 2012.6 The research staff taught the participants how to keep a DR using a record sheet that was completed at the orientation session. The registered dietitians instructed the participants to keep a record of all the food and beverages that they consumed. We provided each participant with a blank DR sheet, a digital scale (TANITA, Tokyo, Japan), and educational handouts to record food intake. The number of food items was calculated based on the number of foods consumed from 18 food groups. Included in the count were cereals, potatoes and starches, pulses, nuts and seeds, vegetables, fruits, mushrooms, algae, fish, mollusks and crustaceans, meat, eggs, milk and milk products, and fats and oils. Excluded in the count were sugars and sweeteners, confectionaries, beverages, seasonings and spices, and prepared foods. These were the same criteria as followed in the NHNS-J 2013.7
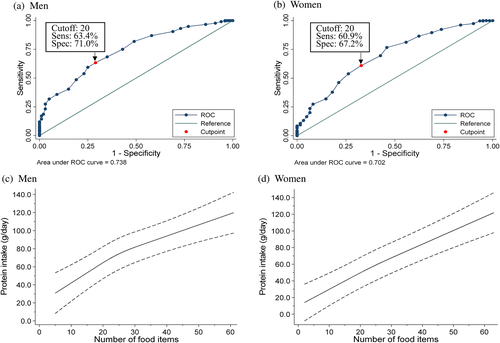
The participants' mean (standard deviation) age, body mass index (BMI), energy intake, protein intake, and number of food items consumed were 73.2 (5.3) years, 22.8 (3.2) kg/m2, 1943 (301) kcal/day, 73.6 (12.7) g/day, and 23.1 (7.3) items, respectively. Based on the seven-day DRs (1001 days' worth of data), the proportion of males and females who did not meet the RDA for protein intake was 18.1% and 13.4%, respectively. To determine the number of food items needed to meet the RDA for protein intake, we calculated the area under the receiver operating characteristic curves, which was 0.738 (95% CI: 0.686–0.789) for males and 0.702 (95% CI: 0.631–0.774) for females (Fig. 1a, b). The cut-off number of food items required to meet the RDA for protein intake was 20 for both males and females. Multivariate adaptive regression splines analysis showed that increasing the number of food items by one was associated with a protein intake increase of 2.2 g (95% CI: 1.5–2.9) in males and of 2.4 g (95% CI: 1.5–3.2) in females (Fig. 1c, d).

Our results suggest that consuming 20 food items per day allows both males and females to meet the RDA for protein intake. The Dietary Guidelines proposed by the Ministry of Health and Welfare of Japan in 1985 recommended a daily intake of 30 food items per day to ensure balanced nutrient intake, but this recommendation was removed in the 2000 revision owing to insufficient evidence. The American Heart Association has also shown that dietary diversity is not an effective strategy for obesity prevention, as dietary variety can be associated with weight gain and obesity in adults.8 However, in older adults suffering from unintentional weight loss, rather than obesity,9 dietary diversity may increase body weight and ensure sufficient protein intake.4 Therefore, considering that muscle protein synthesis is higher when protein is consumed in a balanced manner, by having three meals a day,1 consumption of approximately seven food items per meal may be useful in preventing or alleviating sarcopenia and frailty in older adults.
However, the methodology of this study was limited in several ways. First, the DRs may have been affected by seasonal dietary intake changes.6 Nevertheless, dietary data from our study participants may not have a serious bias because the NHNS-J 2013 showed that the mean number of food items consumed was 23.7 and 22.9 in older adults aged 60–69 and those aged ≥70 years, respectively.7 Second, we did not consider the amount of food consumed when calculating the number of foods items. A previous study excluded foods for which less than the minimum amount was consumed when calculating the number of foods items.10 The association between food diversity and health outcomes in older adults requires further research.4
This study was conducted according to the guidelines laid down in the 1964 Declaration of Helsinki and all procedures involving research study participants were approved by the Research Ethics Committee of Kyoto Prefectural University of Medicine (RBMR-E-363), the National Institutes of Biomedical Innovation, Health and Nutrition (NIBIOHN-76-2), and Kyoto University of Advanced Science (No. 20-1).
Acknowledgements
We would like to express our appreciation to all participants of this study and to all individuals involved in data collection. We acknowledge several administrative staff of Kameoka City and Kyoto Prefecture. We would like to thank the Kyoto–Kameoka Study Group, who contributed their resources to the development of this study. We would like to thank Editage (www.editage.jp) for English-language editing.
Disclosure statement
The authors declare no conflict of interest.
Author contributions
All authors made substantial contributions to the design or conception of the study, the acquisition, analysis or interpretation of data for the study, wrote the first draft or critically reviewed it, and approved the final version to be published.
Open Research
Data Availability Statement
All data sharing and collaboration requests should be directed to the corresponding author DW ([email protected]), TY ([email protected]), and AI ([email protected]).


