Soil Acidification Destabilizes Terrestrial Ecosystems via Decoupling Soil Microbiome
Funding: This work was supported by the Gansu Provincial Science and Technology Planning Project (grant no. 24ZD13FA004); the Second Tibetan Plateau Scientific Expedition and Research (STEP) Program (grant no. 2019QZKK0305); the National Key R&D Program of China (grant no. 2017YFA0604803); the National Natural Science Foundation of China (grant no. 31971466); and the Youth Innovation Promotion Association of Chinese Academy of Sciences (grant no. 2023449).
Yulong Duan and Junbiao Zhang Co-first authors and equally contributed to the manuscript.
ABSTRACT
Soil microbiome is essential for terrestrial ecosystem preservation. β-diversity information on the former, although dynamic due to its sensitivity to environmental conditions driven by climate change, is limited. Our knowledge becomes poorer for microbiomes subjected to environmental gradients, especially for those across multiple ecosystems—information important for biological conservation management. In this study, using next generation sequencing and machine learning at samples from 207 locations among 4300 km of transects that spanned among six typical terrestrial ecosystems of China, we established the divergent distance-decay relationships between bacterial and eukaryotic communities in response to soil pH (pH as proxy of climate and edaphic conditions). The findings, pH-decrease results in lower β-diversity (convergent tendency) among the bacterial communities opposite to the eukaryotic ones (low pH—high β-diversity (divergent tendency)). Meanwhile, competition between bacteria and eukaryotes intensifies at lower pH while the predominant genera and communities are re-structured. Under these circumstances, potential soil acidification due to climate change or other factors could alter soil bacteria and eukaryotes into decoupling directions influencing ecosystems' stability. Thus, soil pH is a pivotal environmental variable that not only describes, but also controls, soil microbiome dynamics at a large scale under ongoing global changes; hence, a cornerstone variable for the biodiversity conservation of China's nature protected areas and not only.
1 Introduction
Underground biodiversity plays a vital role in maintaining ecological balance and stability in ecosystems by promoting sufficient nutrition to support the food chain, contributing to carbon sequestration, and not only (Mace et al. 2012). However, anthropogenic activities and climate change disrupt the living environment, distressing numerous organisms, threatening populations' survival, posing a great threat to biodiversity (Holzmann et al. 2023; Urban 2015). Specific example, the disturbance in biodiversity in the tropics as a result of the rapid disappearance of large tropical rainforests and mangrove areas. This limits carbon capture potential and sequestration capacity of the organisms habiting in such ecosystems, exacerbating climate warming (De Vos et al. 2015; Gatti et al. 2021; Pimm and Raven 2017). Soil microorganisms play vital roles in key processes and functions in terrestrial ecosystems (Bahram et al. 2018; Bradford et al. 2019; de Graaff et al. 2010; Mangan et al. 2010; Urbanová et al. 2015). Their diversity can directly reflect soil quality and state (Banerjee and van der Heijden 2023; Bünemann et al. 2018), as well as terrestrial ecosystems' multifunctionality (Delgado-Baquerizo et al. 2016). Yet, it appears that conservation biologists rarely include soil microorganisms in conservation practices, and assessments normally focus on comparisons between communities of macro-organisms such as animals and plants.
First, to assess how best to conserve biodiversity across spatial scales, the relationship between local monitoring data and regional biodiversity dynamics need to be understood; second, the variation of the mechanisms sustaining diversity from local to regional spatial scales (McClain et al. 2012) must be investigated. β-diversity, can well depict, at process-level, the biodiversity dynamics and its impact in ecosystems (Mori et al. 2018); this approach has rarely been used for practical conservation purposes (He et al. 2020). In this respect, conservation biologists incorporate β-diversity into biodiversity assessment of biological habitats (Bush et al. 2016; He et al. 2020; Socolar et al. 2016; Yao et al. 2023). For example, past studies indicate that abiotic and biotic factors jointly determine the β-diversity of various microbial groups; yet the major underlying factors shaping diversity differ between bacteria and fungi (Bahram et al. 2018; Tedersoo et al. 2014). Concerning abiotic factors, soil microbiomes show consistent and predictable responses to abiotic stress associated with global change factors (GCFs) (Knight et al. 2024). For example, climate warming diminishes soil microbial diversity and disrupts biogeochemical cycling processes (Wu et al. 2022); nitrogen deposition decreases both microbial biomass and taxonomic richness (Yang et al. 2022); drought conditions not only reduce microbial abundance but also alter biodiversity-multifunctionality relationships in terrestrial systems (Hu et al. 2021). A key mechanistic insight from these studies reveals that GCFs predominantly influence soil microbiome through pH modification, with different GCFs demonstrating additive effects when co-occurring (Zhou et al. 2020). Such loss of soil microbial diversity weakens the soil's multifunctionality and capacity to mitigate climate change and its impacts (Delgado-Baquerizo et al. 2016; Li et al. 2024). A consensus is that soil microbial diversity and composition correlate significantly with soil pH at multiple scales, local (Rousk et al. 2010a) or regional (Hollister et al. 2010), and/or even between continents (Chu et al. 2010; Fierer and Jackson 2006; Lauber et al. 2009). Soil pH is of paramount importance in shaping bacterial diversity whereas fungi are more influenced by climate conditions (Aslani et al. 2022; Bahram et al. 2018; Delgado-Baquerizo et al. 2018; Tedersoo et al. 2014). At present, soil acidification is one of the world's most serious environmental problems and questions like, “how would the β-diversity of soil bacteria and eukaryotes alter with a decrease in soil pH?”—“what could the implications for biodiversity conservation and stability in terrestrial ecosystems be?” become more and more relevant. Regarding biotic factors, soil fungal communities and their diversity patterns tend to be associated with plant diversity and not soil bacterial diversity (Barberán et al. 2015; Yang et al. 2017). Nevertheless, the relative importance of these two sets of factors (abiotic and biotic factors) for shaping soil bacterial and fungal community composition is not yet clear. In this respect, discrepancies and inconsistent conclusions arise from studies focusing at different spatiotemporal scales (i.e., local or regional, and intercontinentally) and different ecosystems (Zeng et al. 2019). Hence, so far, information on the patterns of soil microbial diversity distribution and their underlying drivers remains limited (Fierer and Jackson 2006; Lozupone and Knight 2007).
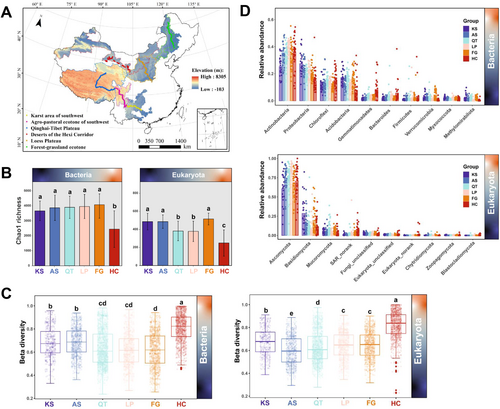
China is a country with very rich biodiversity and a global hotspot for biodiversity conservation. Currently, in China there is a total of 2672 protected areas (PAs), covering 1.80 million km2, accounting for 18.8% of the total area of the country's natural ecosystems. PAs state are used as proxy to assist in quantifying biodiversity loss (Zhao et al. 2024). China's PAs are high in number and type, and they are spatially clustered based on the significant differences among provinces. At present, the PAs geographic distribution features clustering in the western part of China and scattering at the eastern part along the Hu Line (Heihe-Tengchong Line) with most usually located in distinct climate zones (Zhao et al. 2024). Nevertheless, the β-diversity of soil microorganisms and the drivers dictating the regressions of the distribution in these regions remain unknown. Understanding these factors will assist in the formulation of China's future biodiversity conservation strategies. Thus, in this study, to understand these factors further: (i) we established four transects with a total length of 4300 km, split through six distinct terrestrial ecosystems of China (n = 207 sampling sites) (Figure 1A); (ii) we explored the biogeographic patterns of the soil bacterial and eukaryotic communities in the six ecosystems and quantified the respective contribution of multiple spatial and environmental variables (i.e., geographic distance, climate conditions, and soil variables) influencing β-diversity of the bacterial and eukaryotic communities. Soil pH is generally considered to be the most critical environment factor for the β-diversity of bacteria and eukaryotes. Meanwhile, there are differences in physiological adaptation (i.e., cell structure and metabolic pathways) between bacteria and eukaryotes, resulting in different adaptations to acidic environments. Based on the above, we tried to test the hypothesis whether, soil acidification could accelerate the divergent trend of β-diversity of soil bacteria and eukaryotes. Understanding the above could assist both current and future environmental groups, and not only, to conceptualize relevant proposals for biodiversity but also conservation strategies applicable in natural reserves.
2 Materials and Methods
2.1 Study Area and Soil Sampling
The Hu-Line proposed by the famous geographer Hu Huanyong in 1935 is an imaginary line that divides China into two equal parts (Yan et al. 2023). In this study, six typical terrestrial ecosystems of China which are located on the east and west sides of the Hu-Line were the areas of our scientific focus: (i) the karst area of southwestern China (KS), (ii) the agro–pastoral ecotone of southwestern China (AS), (iii) the Qinghai-Tibet Plateau (QT), (iv) the Loess Plateau (LP), (v) the forest–grassland ecotone (FG), and (vi) the deserts of Hexi Corridors (HC), all accounting for a total area of approximately 2.61 × 10⁶ km2 (Figure 1A). These areas have a mean annual temperature (MAT) that widely varies, from −22.9°C to 28.6°C, a mean annual precipitation (MAP) that ranges by almost 40-fold (from 44.9 to 1815 mm), and an elevation spanning from 27 m to 8305 m (above sea level). Regarding the six regions investigated, these have a total length of ~4300 km.
Four transects along environmental gradients that combined precipitation, temperature, and elevation (Figure 1A) were also established—dots represent sampling locations, while the lines they form correspond to the transects studied. These transects represent the main climate types in China: subtropical monsoon climate (all of KS and part of AS), plateau mountain climate (parts of AS and all of QT), temperate continental monsoon climate (all of LP, FG, and HC). From east to west, various vegetation types appear on the basis of climate and soil types. KS and AS, with their vast areas of yellow-brown, red, and cinnamon soils, are dominated by subtropical evergreen, deciduous broad-leaved forests and alpine meadows. QT, having a vast area of black felty soils and chernozem, is dominated by alpine grassland. LP, with large tracts of brown calcic, aeolian sandy, and loessal soils, is dominated by temperate grassland, sandy semi-shrub grassland, and warm temperate deciduous broad-leaved forest. FG, consisting of boggy and meadow soil, dark-brown and aeolian sandy soils, is dominated by warm temperate deciduous broad-leaved forest. Finally, HC, with its widespread Calcic-Orthic Aridosols, is dominated by desert grassland vegetation.
Soil sampling was carried out initially between June and July 2019 and then in July 2020. For tracking the MAP gradient of 207 sites in total (specifically 23 sites for KS, and likewise 31 for AS, 47 for QT, 33 for LP, 35 for FG, and 38 for HC) approximately 20–25 km along the four transects was chosen (Figure 1A). At each sampling point, surface litter was removed within a 10 × 10 m plot, and five 1 × 1 m quadrats along its diagonal line were established. Within one quadrat, three replicate soil samples were abstracted from a depth of 0–20 cm (topsoil) along the diagonal line across the plot. Samples from each of the five quadrats were homogenized (mixing 15 samples) to yield a single composite soil sample per site. Each composite sample was individually packed in a sterilized polyethylene bag and transported quickly to our laboratory; samples were stored in portable car refrigerators. At the lab, each composite soil sample was divided into two subsamples: one was stored at 4°C for soil properties analysis, for which all samples were sieved and air-dried. The other subsample was stored at −80°C for molecular analysis (DNA extraction and molecular techniques). All the pertinent variables and location information of our study's soil samples can be found in Table S1.
2.2 Climatic Factors and Soil Physicochemical Properties
Data for the two climatic variables, MAP and MAT, as average values from a 20-year period (from 2000 to 2020) were obtained Chinese Meteorological Database (http://data.cma.cn/). Soil pH was measured using an E20-FiveEasy pH meter (Mettler Toledo, Giessen, Germany), and EC (electrical conductivity) using an indicator of the soil's soluble salt content (measurements were recorded by an electric conductometer). Both soil measurements were made using a soil–water suspension (5:1, v/v mixture of deionized water and fresh soil) that had been shaken prior for 30 min. Both SOC (soil organic carbon) and TN (total nitrogen in soil) were quantified via a carbon–hydrogen–nitrogen elemental analyzer (2400 II CHN Elemental Analyzer; Perkin Elmer, Boston, MA, USA). Climatic factors and soil properties are summarized in Tables S1 and S2, respectively.
2.3 Soil DNA Extraction and MiSeq High-Throughput Sequencing
Soil total DNA was extracted using the Fast DNA SPIN Kit for Soil (MP Biomedicals, Solon, OH, USA) according to the manufacturer's instructions. The integrity of DNA was determined by electrophoresis in 1.0% agarose gel, and DNA quality was evaluated using a NanoDrop ND-2000 spectrophotometer (Thermo Scientific Inc., Waltham, MA, USA).
The bacterial 16S rRNA gene V3–V4 hypervariable region and eukaryota 18S rRNA gene V5–V7 hypervariable region were respectively amplified using the universal primer pairs of 338F, 806R (Xu et al. 2016) and SSU0817F, 1196R (Rousk et al. 2010a). The PCR reaction volume (20 μL) contained 4 μL of 5× reaction buffer, 4 μL of 2.5 mM dNTPs, 0.8 μL of each F, R primer (5 μM), 1 μL of template DNA (ca. 10 ng) and 0.4 μL of Fast Pfu DNA Polymerase (TransGen Biotech, Beijing, China); ultrapure H2O was used to make up the final volume. The PCR conditions for bacteria were as follows: initial denaturation at 95°C for 3 min, followed by 27 cycles of 95°C for 30 s, 55°C for 30 s, and 72°C for 45 s, with a final extension at 72°C for 10 min. The PCR conditions for eukaryota were as follows: initial denaturation at 95°C for 3 min, followed by 35 cycles at 95°C for 30 s, 55°C for 30 s, and 72°C for 45 s, with a final extension at 72°C for 10 min.
Purified PCR products were pooled in an equimolar solution and sent to the Majorbio Co. Ltd. (in Shanghai, China) for paired-end sequencing on the MiSeq PE300 platform (Illumina, San Diego, CA, USA). All the sequencing data associated with this study have been deposited at the NCBI Sequence Read Archive (https://www.ncbi.nlm.nih.gov/sra), under bioproject accession numbers PRJNA676003 and PRJNA765153.
2.4 Bioinformatics Processing
Raw FASTQ files were de-multiplexed and quality-filtered using the fastp tool (v.0.20.0) (Chen et al. 2018). Briefly, sequencing reads were quality-trimmed with a threshold of an average quality score higher than 20 over 50 bp moving-window sizes and a minimum length of 50 bp. Paired-end reads with at least 10 bp overlap and < 0.2 mismatch ratio were merged using FLASH software (v.1.2.7) (Magoč and Salzberg 2011). Chimeric sequences were checked and removed using the UCHIME algorithm from the USEARCH package (v.11) (Edgar et al. 2011). The ensuing high-quality sequences were aligned according to the SILVA alignment (https://www.arb-silva.de/) (Quast et al. 2012), and then clustered into operational taxonomic units (OTUs) at a 97% similarity by UPARSE (v.7.1) (Edgar 2013). To minimize the impact of sequencing errors, singletons (OTUs with only one sequence) were eliminated in the entire data set (Dickie 2010), then a randomly selected subset of 24,036 bacterial sequences and 27,600 eukaryotic sequences from each sample was used to normalize sequencing across samples. Observed OTUs rarefaction curves were calculated using the function “vegdist” from the R (v.4.3.2) package “vegan”. With a total richness of 23,785 and 2121 OTUs in the bacterial and eukaryotic data respectively, rarefaction curves almost approached sufficient saturation in sequencing (Figure S1). These obtained OTUs were used for the α-diversity analysis, which consisted of abundance-based coverage (ACE) and Chao1 richness estimators and both Shannon and Simpson diversity indices, all calculated using MOTHUR (v.1.30.2) (Schloss et al. 2009). Taxonomically, the 16S or 18S rRNA gene sequences were respectively identified using the RDP Classifier (http://rdp.cme.msu.edu/) searched against the SILVA (v.138) database (https://www.arb-silva.de/), at a 70% confidence level. For both 16S and 18S rRNA, sequences originating from Chloroplasts and Mitochondria were excluded from the analysis.
Normalized OTUs abundance data were used to investigate beta diversity between samples using (i) Bray-Curtis, (ii) weighted UniFrac (i.e., weighted beta diversity metrics), (iii) unweighted UniFrac, and (iv) Jaccard, considering only presence/absence (i.e., unweighted beta diversity metrics). All four metrics have known strengths and weaknesses for phylosymbiosis analyses; leveraging these differences can help identify drivers of community divergence—especially the importance of ancient (more significant using UniFrac) versus nascent (more significant using star phylogeny) microbial clades, and the of presence/absence (more significant using unweighted metrics) versus relative abundance (more significant using weighted metrics) of specific microbial species (Donohue et al. 2022). Bray-Curtis and Jaccard distance matrices were calculated using the function “vegdist” from the R (v.4.3.2) package “vegan” while weighted and unweighted UniFrac distance matrices were generated with “phyloseq” package in R (v.4.3.2). We observed that Jaccard distance, weighted and unweighted UniFrac distance of bacteria and eukaryotes had similar trends with Bray-Curtis's distance (Figure 1C, Figure S2). Consequently, for downstream investigation, we focused on Bray-Curtis's distance as it considers species abundance (Gardiner et al. 2024). Finally, the difference in microbial community composition among the six typical terrestrial ecosystems was visualized by nonmetric multidimensional scaling (NMDS) with OTU data matrix independently for bacteria and eukaryotes.
2.5 Statistical Analysis
One-way ANOVA was used to compare the difference in Chao 1 richness between any two of the six eco-regions. One-way ANOVA was followed by Tukey's HSD (honest significant difference) post hoc test implemented in R (v.4.3.2) (www.r-project.org) using the “agricolae” package (https://CRAN.R-project.org/package=agricolae) to examine the differences in the relative abundance between the dominant phyla of the bacterial and eukaryotic groups. All hereby results are depicted as bar plots at phyla level. Wilcoxon's rank-sum test was used to assess the Bray-Curtis, Jaccard, weighted, and unweighted UniFrac distance of the OTU-level relative abundances of the soil microbiome (beta-diversity) among different regions, whose p was first corrected using the Benjamini–Hochberg method; its corresponding figure was drawn using the “ggplot2” package (https://CRAN.R-project.org/package=ggplot2) in R (v.4.3.2).
Variation partitioning analysis (VPA) was performed to determine the relative contribution of geographic distance, regional climatic conditions, and local edaphic factors shaping the bacterial or eukaryotic community composition. A distance-decomposition model and principal coordinates of neighbor matrices (PCNM) method were applied to the geographic coordinates of the samples to separate them into spatial variables (Ramette and Tiedje 2007). VPA was also carried out in R (v.4.3.2), using the “vegan” package (https://CRAN.R-project.org/package=vegan). The distance-decay relationship (DDR) of both bacterial and eukaryotic communities was calculated by the slopes of ordinary least-squares regressions to assess their similarity (Bray-Curtis's distance) related to geographic and environmental distance (Euclidean distance) (Zhu et al. 2024). The difference in DDR slope between two datasets was calculated using the “diffslope” function in the “simba” package in R (v.4.3.2).
Random forest model was employed to predict the importance of environmental factors to the β-diversity (scores of the first NMDS axis) of soil bacterial or eukaryotic communities across all six terrestrial ecosystems (Dewi and Chen 2019; Xu et al. 2021). The importance of these environmental factors was estimated using the percentage increase in the mean-square error (MSE%). A higher value in MSE% increase indicates more important predictors. These analyses were conducted using the “RandomForest” package in R (v.4.3.2) (Liaw and Wiener 2002). The package “A3” in R (v.4.3.2) was used to evaluate the significance of the models and cross-validated R2 values. The package “rfPermute” in R (v.4.3.2) (https://CRAN.R-project.org/package=rfPermute) was used to determine the importance of each predictor to the variables' response (Archer 2016).
Partial least-squares path modeling (PLS-PM) was employed to explore the direct, indirect, and interactive effects of all measured variables on the soil bacterial and eukaryotic richness and composition with the “plspm” package (https://CRAN.R-project.org/package=plspm) in R (v.4.3.2). The model had been fixed up to make all indicators unidimensional. To build the model, longitude, latitude, and altitude were defined as the latent variable spatial variables; MAT and MAP were defined as the latent variable climate; SOC, TN, and soil C:N ratio were defined as latent variable soil resource. We included the Chao1 index as the richness and the first axis from NMDS to represent the variation in soil bacterial and eukaryotic community composition in the PLS-PM.
Co-occurrence networks of bacterial-eukaryotic were constructed using the “psych” and “igraph” packages in R (v.4.3.2). Bacterial and eukaryotic genera that occurred in at least 50% of the samples were merged into an abundance table. Subsequently, co-occurrence networks were determined by selecting genera with significant correlations (Spearman's r > 0.6 or r < − 0.6 and p < 0.01) (Chen et al. 2024; Guo et al. 2022; Mao et al. 2024; Zhang et al. 2021b). Network topological properties and visualization were analyzed using Gephi (v.0.10) (http://gephi.github.io/) (Bastian et al. 2009). For the nodes in the network, their within-module connectivity (Zi) and among-module connectivity (Pi) were calculated using the package “ggClusterNet” in R (v.4.3.2). The nodes with Zi > 2.5 and Pi > 0.62 were categorized as network hubs, Zi > 2.5 and Pi ≤ 0.62 were module hubs, Zi ≤ 2.5 and Pi > 0.62 were connectors, and Zi < 2.5 and Pi < 0.62 were peripherals (Sun et al. 2022). Hubs and connectors of the network were regarded as potential keystone species (Yu et al. 2024). The difference between groups was analyzed based on the relative abundance of keystone genera. Kruskal-Wallis H test was used to compare multiple groups, and Wilcoxon rank-sum test was used to compare two groups. Differences of 0.01 < p < 0.05 (*); 0.001 < p ≤ 0.01 (**); p < 0.001 (***) were respectively considered as: statistically significant, highly significant, and extremely significant. Meanwhile, 1000 Erdős–Rényi random networks were constructed as null models, which had the identical node counts and edge densities to the empirical networks with uniform edge probability distribution (generated in the “igraph” package in R (v.4.3.2)).
3 Results and Discussion
3.1 Topsoil Microbial Diversity and Community Composition in Chinese Terrestrial Ecosystems
For bacteria, a total of 10,378,615 valid sequences and 23,785 OTUs were obtained from all samples. Meanwhile, for eukaryota, a total of 10,062,343 valid sequences and 2121 OTUs were obtained. The α-diversity (Chao1 richness) of the bacterial and the eukaryotic communities from the six terrestrial ecosystems is presented in Figure 1B. Among them, the Chao1 richness of the soil bacteria community ranged from 394.21 (HC group) to 5759.02 (FG group), with an overall mean (± SD) and median of 3637.18 ± 1040.99 and 3790.87 respectively (Table S3). For eukaryota, the Chao1 richness among the six areas ranged from 20.00 to 656.44, for which the mean and median were 405.68 ± 138.67 and 433.43, respectively (Table S4). The ACE and Shannon indices for the diversity of bacteria and eukaryota are shown in Figures S3 and S4 and summarized in Tables S3 and S4 respectively. The β-diversity indices of the bacterial and eukaryotic communities from the six China's typical terrestrial ecosystems showed a distinct DDR (Figure 1C). The mean value of the β-diversity index of the soil bacterial community ranged between 0.617 (FG group) and 0.811 (HC group). For eukaryota, their β-diversity index ranged from 0.596 (AS group) to 0.823 (HC group).
In our study, for bacteria, all sequences were assigned to 53 phyla; of these, the 10 most dominant across all six typical terrestrial ecosystems were Actinobacteria (25.34%–39.53%), Proteobacteria (14.65%–27.45%), Chloroflexi (10.57%–15.28%), Acidobacteria (7.81%–17.16%), Gemmatimonadetes (1.57%–8.27%), Bacteroidetes (1.66%–5.74%), Firmicutes (0.90%–3.29%), Verrucomicrobia (0.61%–4.34%), Myxococcota (1.15%–2.18%), and Methylomirabilota (0.24%–2.22%), together accounting for ~95% of all bacterial sequences (Figure 1D, Table S5). The predominant four of the above are commonly widespread all over the Earth, proving their ability to colonize a wide variety of habitats (Delgado-Baquerizo et al. 2018), that is, permafrost (Jansson and Taş 2014), arid lands (Zeng et al. 2019), semi-arid grasslands (Wang et al. 2018), alpine meadows (Shen et al. 2019), tropical and temperate forest ecosystems (Tu et al. 2020), and even lake sediments (Xiong et al. 2012). Members of these bacterial phyla feature hyper-complexity in both morphology and metabolism; this enables them to adapt well to various habitats. Meanwhile, all eukaryotic sequences could be assigned to 33 phyla; Ascomycota (60.74%–81.61%), Basidiomycota (9.27%–28.63%), and Mucoromycota (2.73%–8.99%) were the most dominant across all six typical terrestrial ecosystems, accounting for 90% of all eukaryotic sequences identified (Figure 1D, Table S6). Ascomycota and Basidiomycota were two of the dominant eukaryotic phyla present in all six typical terrestrial ecosystems—both also widely spread in numerous ecosystems (Tedersoo et al. 2014).
3.2 Soil pH Is the Most Critical Driver for the β-Diversity of Bacteria and Eukaryotes at the Topsoil of Typical Chinese Terrestrial Ecosystems
Geographic distance and environmental variables are widely recognized as two fundamental drivers shaping soil microbial biogeographic patterns (Bahram et al. 2018; Fierer and Jackson 2006; Zhang et al. 2017). In stark contrast, there is still a debate regarding the relative contribution of geographic distance versus environmental variables to the differences between soil microbial communities (Wang et al. 2015; Xiong et al. 2012). Studies have shown that geographic distance can strongly influence soil microbial community composition (Martiny et al. 2011); in the case of the bacterial and eukaryotic communities specifically, similarities as opposed to geographic distance affect DDR. To understand further the relationship between soil microbial community composition and geographic distance in each of the six typical terrestrial ecosystems of China, a bivariate linear regression was fitted to their Bray-Curtis dissimilarity as a function of geographic distance. Overall, the distance-decay plots of soil bacterial and eukaryotic communities exhibited a similar tendency. The similarity of the bacterial and eukaryotic communities for the six different terrestrial ecosystems significantly (p < 0.001) decreased along with the increase in geographical distance (Figure 2). The slopes of DDR, estimated by the ordinary least-squares regressions, varied across the different terrestrial ecosystems (Figure S5). Specifically, for bacteria and eukaryota, the slopes of DDR were significantly higher under the FG group than under other groups, while the slopes of the HC group were significantly lower. Moreover, the overall slope of the bacterial DDR was significantly higher than the eukaryotic one, indicating that geographical distance had a significant impact on the composition of bacterial communities.
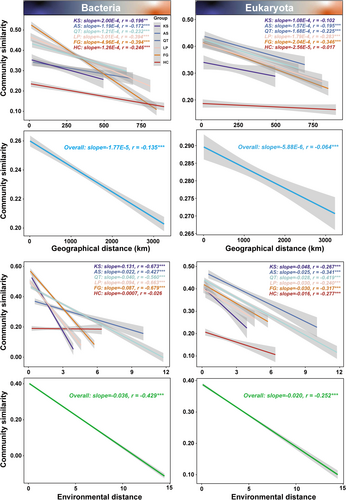
Environmental variables, mainly climatic conditions and soil properties, are among the most crucial drivers affecting the distribution of soil microbial communities on a global basis (Chu et al. 2020). Habitat-associated heterogeneity has been identified as a universal driver of biodiversity as heterogeneous environments have additional resources, refuges, and niches (Thomsen et al. 2022). Similar to the results of the DDR based on geographical distance, the similarity of the bacterial and eukaryotic communities for the six different terrestrial ecosystems significantly (p < 0.001) decreased along with the increase in environmental distance (Figure 2). The slopes of DDR, estimated by the ordinary least-squares regressions, varied across different terrestrial ecosystems (Figure S5). Specifically, for both bacteria and eukaryota, the slopes of DDR were significantly higher under the KS group than under other groups, while the slopes of the HC group were significantly lower. Clearly, both bacterial and eukaryotic communities from the KS group were the most sensitive to changes in the external environment. On the contrary, bacterial and eukaryotic communities from the HC group were the most tolerant and likely those with the highest adapting ability to environmental shifts. Moreover, the overall slope of bacterial DDR was significantly higher than that of the eukaryotic one, indicating that environmental distance had a significant impact on the composition of bacterial communities. Overall, the results from this study suggest that the geographic distance and the environmental variables have a significant effect upon the soil microbial community composition; observations consistent across all six typical terrestrial ecosystems of China. Furthermore, the findings also show asynchronous changes in the dissimilarity of soil microbial communities as a function of environmental factors among these terrestrial ecosystems (Figure 2, Figure S5). Such asynchrony in soil microbial communities helps stabilize terrestrial ecosystem functions (Wagg et al. 2021).
VPA was applied to quantify the relative contribution of the geographic distance and the environmental variables to soil bacterial and/or eukaryotic community composition across the samples representing China's six typical terrestrial ecosystems (Figure 3A, Figure S6). For both bacteria and eukaryotes, just a small proportion of their community-level variation could be associated with the variables hereby examined, especially for the eukaryota taxa for which a high proportion of variation was left unexplained. This substantial unexplained fraction in the microbial β-diversity includes unmeasured environmental variables (Jiao et al. 2020) as well as stochastic processes related to growth, death, colonization, and extinction (Chen et al. 2019). The highly unexplained variation in soil microbial β-diversity can be partially attributed to the large variability present in the species' co-occurrence patterns and the topological features in the microbial networks across different spatial scales (Jiao et al. 2022).
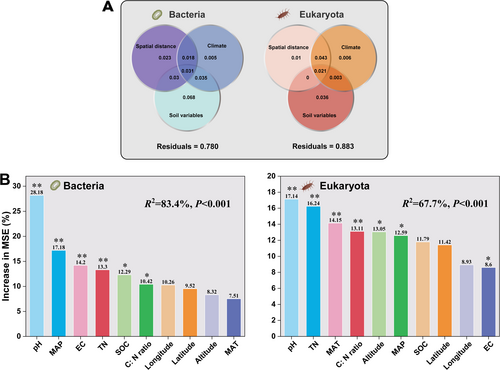
Random forest models indicate that the β-diversity of soil bacteria and eukaryota is driven by environmental factors. Among them, soil pH, MAP, EC, and TN (p < 0.001) were the most important predictors of the β-diversity of the soil bacterial community; other ecological factors such as SOC and soil C:N ratio were also important but to a lower degree (Figure 3B, Figure S7). With regards to eukaryota, soil pH, TN, MAT, and soil C:N ratio (p < 0.001) were the most important predictors of the β-diversity of the soil eukaryotic community (Figure 3B, Figure S8). Clearly, soil pH was the most important predictor for both soil bacteria and eukaryota community β-diversity across all six typical Chinese terrestrial ecosystems. The fundamental role of soil pH in shaping bacterial community composition has been previously demonstrated at both different scales and ecosystems (Chu et al. 2020; Griffiths et al. 2016; Jiao and Lu 2020; Lauber et al. 2009; Ni et al. 2021). Environmental factors, such as climate characteristics (i.e., MAP and MAT) and typical soil variables (i.e., pH and EC) (Figure 3B) are widely accepted as the most important predictors of the soil fungal richness and community composition (Tedersoo et al. 2014).
3.3 β-Diversity of Bacteria and Eukaryotes Shows a Divergent Trend to Similar Environmental Factors Across the Six Typical Terrestrial Ecosystems in China
The PLS-PM analysis showed that multiple variables dictate the richness (α-diversity) and composition (β-diversity) of the soil bacterial and eukaryotic communities via a combination of direct and indirect mechanisms (Figure 4A). For bacteria, spatial and climatic variables have a positive direct effect on soil bacterial richness, while resources in soil (SOC, TN, and soil C:N ratio) and pH have a negative direct effect. Meanwhile, soil pH and spatial variables have a positive direct effect on soil bacterial community composition, while soil resources and bacterial richness have a negative direct effect (Figure 4A, Table S7). Regarding eukaryota, only soil resources have a positive direct effect on soil eukaryotic richness, while spatial variables and soil pH have a negative one. Meanwhile, soil resources and eukaryotic richness have a positive direct effect on the soil eukaryotic community composition, while soil pH has a negative one (Figure 4A, Table S8).
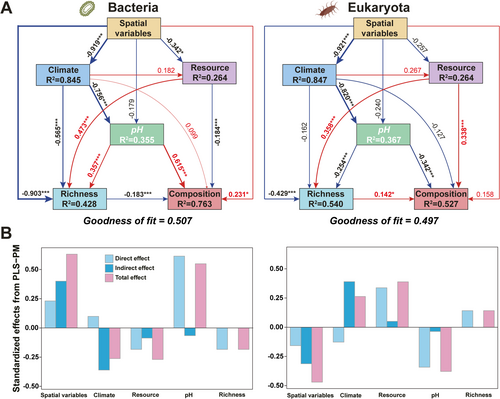
Soil pH ranked as the most important variable for both soil bacterial (direct effect = 0.62) and the eukaryotic (direct effect = −0.34) community composition (Figure 4B; Tables S7 and S8). Spatial (direct effect = 0.23) and climatic (direct effect = 0.10) variables positively correlated with the bacterial community composition; on the contrary, soil resources (direct effect = −0.18) and soil richness (direct effect = −0.18) correlated negatively with the latter. Conversely, spatial (direct effect = −0.16) and climatic (direct effect = −0.13) variables negatively correlated with eukaryotic community composition, whereas soil resources (direct effect = 0.34) and soil richness (direct effect = 0.14) were positively correlated. Interestingly, resources in soils, spatial, and climatic variables also have opposite direct effects on the β-diversity of bacteria and eukaryotes. Clearly, bacteria and eukaryotes exhibit a strong antagonistic relationship in terrestrial ecosystems. This phenomenon can be explained by niche differentiation driven by the adverse response to multiple environmental factors and strong taxa competition. Niche differentiation is caused by the affinity of bacteria and fungi for certain habitat features; this results in strong competition for carbon sources and energy, as well as for organic compounds and nutrients (He et al. 2023; Hu et al. 2022). The same applies for when such organisms inhabit the same soil habitats (Nazir et al. 2017). Globally, bacteria and fungi exhibit niche differentiation associated with contrasting diversity responses to precipitation and soil pH (Bahram et al. 2018). Bacteria-fungi interactions are ubiquitous in the soil microenvironment; the former play an important role in driving complex ecosystem processes such as nutrient cycling (decomposition of litter, rhizodeposits, and soil organic matter). Formation of soil increases with soil fertility, suppresses plant diseases, supports plant productivity, and enhances the resilience of ecosystems (Coban et al. 2022; Wang and Kuzyakov 2024a). Universally, bacteria and fungi share one or more common substrates, and metabolic competition between them may induce bacteria-fungi antagonism, especially in environments with scarce nutrient sources. This enables the development of survival strategies of bacteria and fungi (Bardgett and van der Putten 2014; Becker et al. 2012; Li et al. 2020; Maynard et al. 2019, 2017; Mille-Lindblom et al. 2006). A recent innovative research demonstrated that soil fungal richness mediates the balance in soil bacteria assembly processes, with stochastic assembly processes decreasing along with an increase in fungal richness (Jiao et al. 2022). Similarly, α-diversity of soil bacteria and eukaryotes in the typical terrestrial ecosystems of China were strongly shaped by multiple abiotic factors such as resources, spatial variables, climatic variables, and soil pH (Figure 4A), findings consistent with those from previous studies (Aslani et al. 2022; Bahram et al. 2018; Chu et al. 2010; Delgado-Baquerizo et al. 2018; Fierer and Jackson 2006; Hollister et al. 2010; Lauber et al. 2009; Rousk et al. 2010a; Tedersoo et al. 2014). Meanwhile, the results showed that the α-diversity (richness) of bacteria (direct effect = −0.183) and eukaryotes (direct effect = 0.142) also have an opposite direct effect on the β-diversity for those two groups (Figure 4B; Tables S7 and S8).
Admittedly, the impact of multiple abiotic factors is better explained by the β-diversity of soil microorganisms rather than the α-diversity (Zhou et al. 2020). However, abiotic factors and α-diversity of soil microorganisms can still be regarded as predictors for the β-diversity trends, especially when studying the dynamic impact of the changing climate on soil microorganisms.
3.4 Monitoring Soil pH and Its Drivers Assist in Predicting β-Diversity of Soil Bacteria and Eukaryotes in Terrestrial Ecosystems
As previously mentioned, soil pH is the most critical driver for soil bacterial and eukaryotic community composition in terrestrial ecosystems (Figures 3 and 4). Indeed, as a fundamental parameter of soil chemical properties, soil pH controls biogeochemical processes, microbial communities, and nutrient forms of any belowground ecosystem (Jin et al. 2022). Changes in soil pH alter soil biogeochemical processes by affecting soil microbes, such as altering SOC accumulation (Malik et al. 2018) and decomposition (i.e., regulate priming effect) (Wang and Kuzyakov 2024b), and/or influencing the expression of N cycling process-related functional genes (i.e., nirS and nirK, amoA-AOA and amoA-AOB) (Zhong et al. 2023); thus, it has a cascading effect upon numerous functions taking place in terrestrial ecosystems (Griffiths et al. 2016; Hong et al. 2018; Malik et al. 2018; Stevens et al. 2004; Wang and Kuzyakov 2024b; Zhong et al. 2023). Understanding the underlying mechanisms of soil pH dynamics is helpful for the prediction of future trends in soil microbial β-diversity, especially for bacteria and eukaryotes, microorganisms that are considered the most diverse and widely distributed in terrestrial ecosystems. It is generally believed that soil pH is directly determined by the concentrations of hydrogen ion (H+) and hydroxide ion (OH−) in the soil. As the key ions of soil solution, H+ and OH− have significant influence on soil conductivity (EC). The random forest model indicated that soil pH was primarily affected by EC, followed by MAP, SOC, TN, MAT, and soil C:N ratio (p < 0.01) across the terrestrial ecosystem samples (Figure 5A). Globally, numerous studies have shown that soil pH is primarily affected by climatic conditions, such as MAP and MAT (Slessarev et al. 2016). Moreover, land, when subjected to anthropogenic activities, particularly afforestation, can significantly alter the soil hydrological and biogeochemical environment, shifting the leaching rate of Ca2+ and ultimately affecting soil pH (Berthrong et al. 2009; Hong et al. 2018; Jin et al. 2022; Malik et al. 2018). Our results emphasize the role of EC on soil pH. EC specifically has been an indicator for the soil's soluble salt content, such as Na+, Ca2+, Mg2+, and K+, reflecting its background properties, representing even the impact from climate change (e.g., drought) and/or human activity (e.g., irrigation and fertilization).
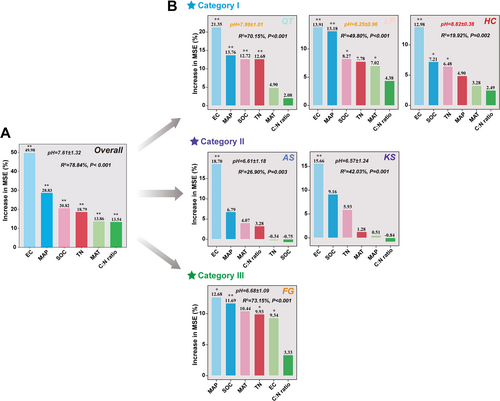
Random forest model revealed that soil pH of different regions is influenced by different group(s) of environmental factors (Figure 5B). Based on the relative contributions of environmental factors affecting soil pH, we divided the above six regions into three categories. Category I, which includes the three regions of QT, LP, and HC, all of which have a mean soil pH above 7.5, alkaline soil affected not only by soil EC but also by other environmental factors; Category II, which includes the two regions of AS and KS, all of which have a mean soil pH of 6.5 to 7.0, neutral to slightly acidic soil affected only by soil EC; Category III, which only includes the FG region, with a mean soil pH of 6.5–7.0 similar to Category II, but is primarily affected by MAP followed by other environmental factors, such as SOC, MAT, and TN (Figure 5B, Table S2). Presently, soils are at a buffering transition from base cations (Ca2+, Mg2+, and K+) to non-base cations (Mn2+ and Al3+) due to nitrogen deposition-induced soil acidification (Tian and Niu 2015). Particularly in China, soil acidification occurs irreversibly in a wide range of terrestrial systems. Specifically, in cropland primarily due to fertilizer intensification (Guo et al. 2010), in forests and grasslands due to atmospheric acid deposition (Zhang et al. 2021a, 2022). Considering the future trends in global soil acidification, the divergent trend of β-diversity between soil bacteria and eukaryotes may get enhanced, namely, soil bacterial β-diversity may decrease while eukaryotic β-diversity could increase.
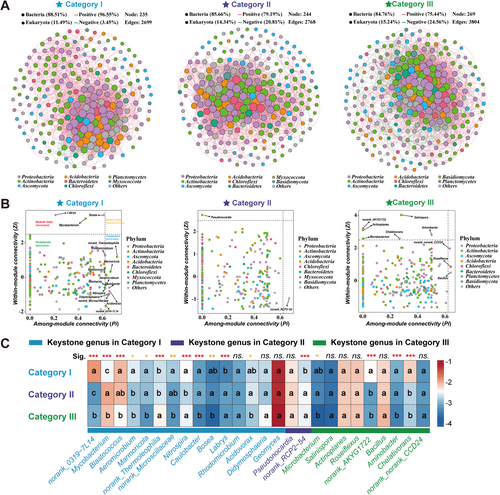
To explore the changes in soil bacterial-eukaryotic interactions as soil becomes subjected to acidification, co-occurrence networks were constructed using samples from different pH soil groups (based on the Spearman correlation coefficients of the OTUs (|r| > 0.6, p < 0.01)) (Figure 6). The network obtained displayed scale-free characteristics (Figure S9) suggesting that the network structure was nonrandom. The measured modularity, average clustering coefficient, and average path length all exceeded those of their respective Erdös–Rényi random networks, pointing out that the network had “small-world” properties (Table S9). Our results showed that bacterial-eukaryotic network patterns shifted clearly across three soil groups with different bacterial and eukaryotic roles in the networks during soil acidification (Figure 6A, Figure S10, Table S9). Specifically, bacterial taxa had higher network connectivity (i.e., network degree) than eukaryotic taxa (Figure S10D–F). In comparison, bacterial network connectivity increased from 23.71 (Category I) to 24.63 (Category II) and 28.01 (Category III), while eukaryotic network connectivity increased from 2.07 (Category I) to 2.19 (Category II) and 4.68 (Category III) (Figure S10D–F). Moreover, the proportion of negative network edges (mainly representing bacteria-bacteria intra-kingdom correlations) markedly increased from 3.45% (Category I) to 20.81% (Category II) and 24.56% (Category III) (Figure 6A, Figure S10G). The results showed that positive correlations between bacteria and eukaryotes decreased from 96.55% (Category I) to 79.19% (Category II) and 75.44% (Category III) (Figure 6A, Table S10). Subsequently, to identify keystone phylotypes in the three soil pH groups, network nodes (Genus) could be represented by four categories (network hubs, module hubs, connectors, and peripherals) based on Pi and Zi values (Figure 6B, Table S10). Accordingly (Pi and Zi), 3 module hubs (Bosea, Labrys, and Mycobacterium) and 12 connectors were observed in Category I; only 1 module hub (Pseudonocardia) and 1 connector (norank_RCP2-54) were observed in Category II, while 6 module hubs (Actinoplanes, Microbacterium, Salinispora, Aminobacter, Chelativorans, and norank_AKYG1722) and 3 connectors (norank_norank_CCD24, Bacillus, and Roseiflexus) were observed in Category III (Figure 6B, Table S10). All these nodes represented the keystone genera that played vital roles in shaping the soil microbial network structure. Finally, the relative abundance of these keystone genera among three soil pH groups (Figure 6C, Table S11) suggested that bacterial-eukaryotic competition intensifies with soil acidification, and that the keystone genera alter based on pH trends.
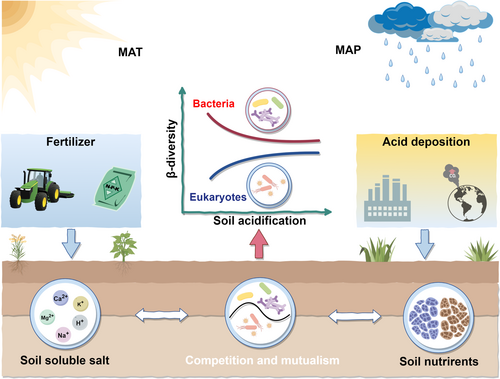
The underlying mechanism for these phenomena is that the changes in soil pH regulate soil microbial growth and competition (fungi and especially bacteria have their optimal pH range) (Rousk et al. 2010b; Wang and Kuzyakov 2024a). Soil acidification has the potential to profoundly alter bacterial-fungal competition for energy and natural resources (mainly carbon source) (Holyoak et al. 1996; Jones et al. 2019; Malik et al. 2018). Soil acidification raises the fungal competitiveness in acidic soils; this is because fungi have a higher osmotic stress tolerance ability than bacteria (Griffiths et al. 1998). Such competition helps fungi to occupy complex niches in acidic soils easier than bacteria, thus increasing their fungal β-diversity (Jiao et al. 2022). Conversely, bacteria improve their phosphorus requirements by secreting phosphatases and organic acids in acidic soils. This homogenization of survival strategies leads to a convergence of bacterial community composition, thus decreasing their β-diversity through environmental filtering (Rousk et al. 2010b). This is mainly attributed to pH optima. Specifically, exoenzymes production for most soil bacteria reaches optimum at neutral to alkaline pH, whereas fungal exoenzymes appear at the highest rate at acidic pH (Griffiths et al. 1998; Holyoak et al. 1996; Wang and Kuzyakov 2024a). Additionally, there is evidence showing that soil acidification adversely impacts bacterial communities and reduces the capacity of the soils to challenge fungal pathogens (Li et al. 2023). Finally, the high functional redundancy of bacteria and the functional specificity of eukaryotes may partly explain the different patterns of β-diversity in acidified soil (Hu et al. 2024).
Consequently, the decoupling of bacterial-eukaryotic β-diversity trajectories triggers cascading ecological consequences, such as impaired nutrient cycling efficiency due to disrupted decomposer-predator interactions (Bardgett and van der Putten 2014), structural soil degradation from reduced bacterial extracellular polymer substance (EPS) production and fungal hyphal network erosion (Lehmann et al. 2017), an increase in carbon release, weak soil carbon storage function, and climate change exacerbation (Averill et al. 2014), weak bacterial-eukaryotic synergies, and a reduction in the resilience and resistance of ecosystems, making them more susceptible to climate change influence and invasive species (Delgado-Baquerizo et al. 2016; Wagg et al. 2014). Therefore, it is anticipated that the decoupling of the β-diversity of soil bacteria and eukaryotes could have negative effects on biodiversity conservation and terrestrial ecosystem stability. This will contribute to a predictive understanding of the interplay between the soil state and the microbial community, which are both critical for accurately predicting the ecological consequences of ongoing global environmental changes.
4 Conclusions
This study demonstrates the benefit of using soil microorganisms' β-diversity in assessing terrestrial ecosystem state to assist in biodiversity conservation of PAs. The importance of predicting trends of soil microbial β-diversity in PAs via monitoring soil pH and its drivers was highlighted; pH was proven to be a key variable for understanding microbial dynamics in soils. A conceptual model depicting the soil microbial β-diversity trend in terrestrial ecosystems under dynamic conditions driven by soil acidification was also presented (Figure 7). Acidification of soils is a phenomenon amplified due to climate change and/or the continuous intensification of anthropogenic activities at the ecosystems, a state that could lead to a divergent trend of β-diversity of both soil bacteria and eukaryotes. As an effect, this work confirms that a decrease in β-diversity of soil bacteria and an increase for eukaryotes should be anticipated—an effect driven by enhanced competition between bacteria and eukaryotes, with the latter benefited by lower pH. Generally, a pH drop in terrestrial ecosystems shifts the predominant genera of the community structure, leading to the decoupling of bacteria and eukaryotes, having a negative effect on biodiversity conservation and/or terrestrial ecosystem stability.
Author Contributions
Yulong Duan: conceptualization, formal analysis, investigation, methodology, writing – original draft, writing – review and editing. Junbiao Zhang: data curation, formal analysis, methodology, software, validation, visualization. Evangelos Petropoulos: formal analysis, supervision, writing – review and editing. Jianhua Zhao: data curation, formal analysis, supervision, validation, visualization. Rongliang Jia: writing – review and editing. Fasi Wu: writing – review and editing. Yun Chen: investigation. Lilong Wang: investigation. Xuyang Wang: funding acquisition, investigation. Yulin Li: writing – review and editing. Yuqiang Li: funding acquisition, investigation, project administration, writing – original draft, writing – review and editing.
Acknowledgements
This research was supported by the Gansu Provincial Science and Technology Planning Project (grant no. 24ZD13FA004); the Second Tibetan Plateau Scientific Expedition and Research (STEP) Program (grant no. 2019QZKK0305); the National Key R&D Program of China (grant no. 2017YFA0604803); the National Natural Science Foundation of China (grant no. 31971466); and the Youth Innovation Promotion Association of Chinese Academy of Sciences (grant no. 2023449).
Conflicts of Interest
The authors declare no conflicts of interest.
Linked Article
See also the Commentary regarding this article by Kai Feng and Ye Deng https://doi.org/10.1111/gcb.70208.
Open Research
Data Availability Statement
All the sequencing data associated with this study have been deposited at the NCBI Sequence Read Archive (https://www.ncbi.nlm.nih.gov/sra) (accession number: PRJNA676003 and PRJNA765153). Temperature (MAT) and precipitation (MAP) are available in figshare (https://doi.org/10.6084/m9.figshare.28656650). Soil physicochemical properties are available in figshare (https://doi.org/10.6084/m9.figshare.28656674).


