Correction to “A new empirical framework to quantify the hydraulic effects of soil and atmospheric drivers on plant water status”
Mencuccini, M., Anderegg, W. R. L., Binks, O., Knipfer, T., Konings, A. G., Novick, K., Poyatos, R., & Martínez-Vilalta, J. (2024). A new empirical framework to quantify the hydraulic effects of soil and atmospheric drivers on plant water status. Global Change Biology, 30(3), e17222. https://doi.org/10.1111/gcb.17222
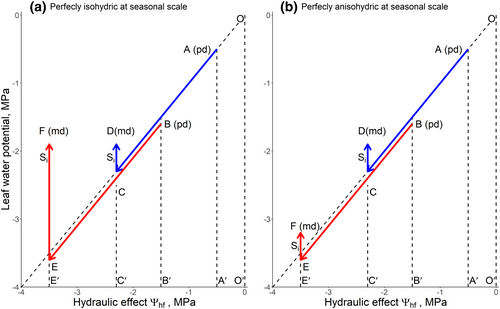
Figure 1 Conceptual diagram of the relationships between leaf water potential Ψleaf, measured at either predawn (pd) or midday (md) and the combined hydraulic effects caused by Ψsoil plus VPD (Ψhf). For both panels, blue line, springtime day, close-to-zero Ψpd; red line, summertime day, negative Ψpd. At springtime, the effect of Ψsoil (assumed equal to Ψpd) equals and the effect of VPD equals . At summertime, the effect of Ψsoil equals , and the effect of VPD equals , respectively. In both days, the observed Ψmd is less negative than the total hydraulic effect predicted based by Ψhf (compare D with C and F with E). The vertical segments with give the regulation Si against VPD, while -ΔΨ = Ψmd-Ψpd is the regulation against VPD that the plant did not do. Left-hand panel, a perfectly isohydric plant (at the seasonal time scale) in which Ψmd remains constant through the season despite changes in the two drivers (compare Ψleaf at D with F); right-hand panel, a perfectly anisohydric plant in which stringency of regulation remains constant despite changes in the two drivers (compare with ). Note that the hydraulic effect caused by VPD for the two plants depends on plant-specific values of and therefore likely to change between the two idealized cases, but this is not represented in the figure. Beside the two cases presented here, other scenarios are possible, depending on the balance between regulation against VPD and Ψpd.
We apologize for this error.


