Widespread drought-induced tree mortality at dry range edges indicates that climate stress exceeds species' compensating mechanisms
Abstract
Drought-induced tree mortality is projected to increase due to climate change, which will have manifold ecological and societal impacts including the potential to weaken or reverse the terrestrial carbon sink. Predictions of tree mortality remain limited, in large part because within-species variations in ecophysiology due to plasticity or adaptation and ecosystem adjustments could buffer mortality in dry locations. Here, we conduct a meta-analysis of 50 studies spanning >100 woody plant species globally to quantify how populations within species vary in vulnerability to drought mortality and whether functional traits or climate mediate mortality patterns. We find that mortality predominantly occurs in drier populations and this pattern is more pronounced in species with xylem that can tolerate highly negative water potentials, typically considered to be an adaptive trait for dry regions, and species that experience higher variability in water stress. Our results indicate that climate stress has exceeded physiological and ecosystem-level tolerance or compensating mechanisms by triggering extensive mortality at dry range edges and provides a foundation for future mortality projections in empirical distribution and mechanistic vegetation models.
1 INTRODUCTION
Human-caused climate change is expected to fundamentally alter Earth's forest ecosystems, degrade biodiversity, and disrupt ecosystem functioning, including the trillions of dollars in forest ecosystem services provided to humanity each year (Costanza et al., 1997; Field et al., 2014; Urban, 2015). Climate change has driven widespread shifts in tree species' geographic ranges across multiple biomes (Chen, Hill, Ohlemüller, Roy, & Thomas, 2011; Colwell, Brehm, Cardelús, Gilman, & Longino, 2008; Esquivel-Muelbert et al., 2019; Kelly & Goulden, 2008; Lenoir, Gégout, Marquet, De Ruffray, & Brisse, 2008) and climate extremes, such as severe drought, are projected to be an important driver of range shifts (Easterling et al., 2000; Zimmermann et al., 2009). Indeed, major drought-induced tree mortality episodes have been observed on every vegetated continent in the past several decades linked to climate warming (Allen, Breshears, & McDowell, 2015; Allen et al., 2010; Phillips et al., 2009). Drought-induced tree mortality has extensive ecological and societal impacts, including the potential to flip the terrestrial carbon sink to a carbon source, thereby accelerating climate change (Adams et al., 2010; Anderegg, Kane, & Anderegg, 2013).
Prediction of drought-induced tree mortality is still quite limited and is thus a major uncertainty in coupled climate–carbon cycle projections (Anderegg et al., 2013; Hartmann et al., 2018; McDowell et al., 2011). While an improved mechanistic understanding and trait-based approaches have shed light on which species in a community might be more vulnerable to mortality (Anderegg et al., 2016; Esquivel-Muelbert et al., 2019; Greenwood et al., 2017; Hartmann et al., 2018; Trugman et al., 2018), we remain unable to answer a fundamental question: Which populations within a species will be most vulnerable to drought and other climate extremes? Two broad and conflicting patterns have been documented empirically (Allen et al., 2010; Camarero, Gazol, Sangüesa-Barreda, Oliva, & Vicente-Serrano, 2015). In some species, drought-induced mortality has been observed at the driest populations or driest edges of their geographic ranges (Carnicer et al., 2011; Fettig, Mortenson, Bulaon, & Foulk, 2019; Worrall et al., 2008), indicating that potential compensating mechanisms of physiological adaptation and plasticity along with ecosystem-level reductions in density and leaf area did not compensate for harsh climatic conditions. This mortality may be due to drier populations crossing beyond the species' “fundamental niche” and existing outside where the species can physiologically survive, either temporarily (representing die-off with recovery) or permanently (representing local extirpation/geographic range contraction). In other species, drought impacts have been more severe at “drought naïve” populations in the range core or wetter populations that do not often experience drought (Isaac-Renton et al., 2018; Lloret & Kitzberger, 2018; Zuleta, Duque, Cardenas, Muller-Landau, & Davies, 2017), hinting that these non-drought adapted or acclimated populations may be more vulnerable to extreme water deficits due to some combination of physiological vulnerability and “structural overshoots” at the ecosystem level (Jump et al., 2017). In these scenarios, compensating mechanisms such as within-species drought response trait variation, for instance more embolism resistant xylem in drier populations (Anderegg, 2015; López et al., 2013), and/or lower ecosystem-level tree density or leaf area, may have allowed drier populations to suffer less mortality than wetter populations during the same drought. In this case, mortality does not represent a shift in the fundamental niche.
Illuminating which populations are most vulnerable to drought and the associated scope of local adaptation and plasticity is foundational for forecasting range shifts via both empirical methods, such as species distribution models, and more mechanistic methods, such as ecosystem and dynamic vegetation models (Dawson, Jackson, House, Prentice, & Mace, 2011; Scheiter, Langan, & Higgins, 2013). Predicting range shifts will be crucial for forecasts of climate change's effects on biodiversity, species extinctions, ecosystem resilience, and the terrestrial carbon sink (Dawson et al., 2011; Esquivel-Muelbert et al., 2019; Urban, 2015). With a few exceptions (e.g., Scheiter et al., 2013), most models and forecasts tend to ignore intraspecific variation (Anderegg, 2015; Dawson et al., 2011) and thus implicitly assume that drier populations will be most vulnerable to mortality as climate change pushes those populations across a climatic range constraint. This is a major assumption that has not been tested. Indeed, relatively large intraspecific functional trait variation, arising from an unknown combination of local adaptation and plasticity, has been documented in many species (Anderegg, 2015; Anderegg, Konings, et al., 2018; Messier, McGill, & Lechowicz, 2010), which could greatly buffer species from climate impacts. This intraspecific variation also differs substantially among species groups, with gymnosperms showing less within-species variation in certain functional traits likely due to anatomical constraints (Anderegg, 2015; Anderegg, Konings, et al., 2018; Johnson, McCulloh, Woodruff, & Meinzer, 2012). Thus, given the prevalence of intraspecific trait variation and the centrality in modeling mortality (Greenwood et al., 2017; López et al., 2013), there is an urgent need to quantify and assess the broad patterns of where drought-induced mortality occurs within species' ranges.
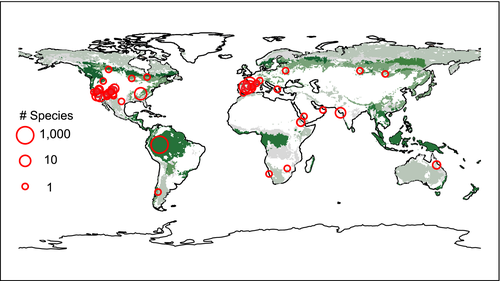
Here, we conducted a meta-analysis of mortality patterns in 50 studies that span >100 woody plant species and global forest biomes (Table S1) and combine this mortality dataset with gridded climate data products and multiple plant functional trait databases. We compiled information on species' clade (angiosperm or gymnosperm), leaf habit (deciduous or evergreen), wood anatomy (conifer, ring porous, or diffuse porous), wood density (WD), specific leaf area (SLA), maximum light-saturated photosynthetic rate (Amax), rooting depth (RD), specific hydraulic conductivity (Ks), water potential at 50% and 88% loss of stem hydraulic conductivity (Ψ50, Ψ88), minimum measured water potential (Ψmin), and hydraulic safety margin (HSM: Ψmin − Ψ50 or Ψ88). These functional traits capture important axes of species' resource acquisition (Amax, SLA, WD, Ks) and drought tolerance (RD, Ψ50, Ψ88, Ψmin, HSM) strategies (see Section 2). To understand if organismal physiology and/or ecosystem adjustments can adequately buffer dry populations from mortality, we asked: (a) are populations at dry range edges or in the core of species' ranges more vulnerable to drought-induced tree mortality, (b) what species attributes and functional traits mediate these mortality patterns, and (c) what climate metrics influence population-level mortality patterns?
2 MATERIALS AND METHODS
2.1 Study selection
We sought to identify peer-reviewed studies that quantified drought-induced tree mortality across a climate gradient that spanned from wetter to drier populations. We set the following a priori study selection criteria. Studies had to: (a) determine that drought was a major driver of the examined tree mortality, (b) report a mortality rate (typically at the species-level) or mortality risk metric at multiple locations across a climate gradient, (c) report mortality that was not primarily biotically driven (although biotic agents could play a contributing role—see below), and (d) avoid any co-occurring disturbance or other mortality driver (e.g., fire, harvest manipulation) that might bias mortality patterns.
We performed an extensive two-pronged literature search. First, we compiled and examined all references in tables and citations from major synthesis papers of drought-induced tree mortality and population dynamics across species' ranges in the past decade (Abeli, Gentili, Mondoni, Orsenigo, & Rossi, 2014; Allen et al., 2010, 2015; Anderegg et al., 2016; Greenwood et al., 2017; Jump, Mátyás, & Peñuelas, 2009). Second, we performed detailed searches on Web of Science and Google Scholar using various combinations of search terms of “drought,” “tree mortality,” “die-off,” “dieback,” “landscape,” “spatial pattern,” “elevation,” and “range.”
Ultimately, we identified 182 potentially useful studies and read them for our criteria. A total of 50 studies comprising >100 species (100 individual species and a community-level study with 828 woody species—see below) met our selection criteria (Table S1). Within studies that presented mortality data for multiple species, we included only species that were native species and composed >10% of the ecological community to ensure an adequate number of individuals censused to provide an accurate mortality estimate. In several species (N = 8 species), biotic agents were identified as playing a contributing role to the drought-induced mortality. We demarcated these species with a binary flag that allowed us to test that our results were robust with and without these species (see Section 2.5). In one case (Purves, 2009), drought was identified as an important mortality driver in the region by subsequent studies (Peters, Iverson, & Matthews, 2015; Zhang, Niinemets, Sheffield, & Lichstein, 2018) and we examined results with and without this study to ensure that our findings were robust (see Section 2.5).
In our selection criteria and identification of studies, we took great care to avoid two potential confounding factors: (a) that mortality patterns could be due to regional differences in drought severity or (b) that mortality patterns could be due to changes in species composition across the gradient. To avoid the first, we primarily analyzed studies that reported mortality across small-scale climate gradients where the regional drought signal is likely to be quite similar. The vast majority of studies reported mortality patterns in a small region across an elevation or topographic (e.g., north-facing vs. south-facing slopes) gradient that provides well-documented variation on temperature and water availability within the same broad hydroclimate stress. To avoid the second factor, we examined studies where species-specific mortality rates across the climate gradient were presented, thereby entirely avoiding the impact of species composition changes, or a small number (N = 2 studies) that reported community-level mortality rates but explicitly tested and ruled out the effect of species composition differences driving mortality rates. To ensure these multispecies studies did not bias our findings, we conducted analyses with and without these studies (see below).
2.2 Mortality data and metrics

When studies presented mortality data from multiple regions or comparisons, we calculated the mortality ratio for each respective region and averaged the ratios to get a species-level estimate. Five studies presented mortality data analyzed via multiple climate gradients—such as both elevation and topographic patterns in mortality within the same species—and we synthesized these multiple climate gradients into a single metric by calculating the mortality ratios separately and averaging the ratios to yield a species-level estimate within each study.
2.3 Trait data
We selected 10 functional traits that capture important components of species' rates of resource acquisition and drought stress tolerance, which likely trade-off against each other (MacArthur, 1972; Reich, 2014). These functional traits have been widely used in the drought literature to assess mortality risk factors and ecosystem resilience to drought (Anderegg, Berner, et al., 2018; Anderegg et al., 2016; Greenwood et al., 2017). While they may not be directly linked to mortality, traits that reflect high rates of resource acquisition (high Amax, high SLA, low WD, and high Ks) may be risk factors for elevated mortality rates due to their associated trade-off against drought tolerance. Concerning drought tolerance traits that are likely more directly linked to mortality, species with more embolism-resistant xylem (more negative Ψ50, Ψ88, Ψmin), deeper roots (higher RD), and less risky hydraulic strategies (larger HSM) may be less vulnerable to mortality, although the effects at wetter and drier populations will likely be mediated by the degree to which the drought exceeds the fundamental niche at these populations and potential compensating mechanisms.
We compiled trait data for the tree species in our mortality database, which enabled capturing first-order effects of how functional traits might mediate mortality patterns. We used the Global Wood Density Database (Zanne et al., 2009) to compile WD data for species and the TRY database for root depth data. We used the dataset presented in ref. (Maire et al., 2015) to compile species' traits of light-saturated maximum photosynthetic rate and specific leaf area. We used the Xylem Functional Traits database (Gleason et al., 2015) to compile the water potential at 50% and 88% loss of hydraulic conductivity and hydraulic safety margin from each of those, defined as the minimum water potential experienced minus Ψ50 or Ψ88, for each species. Full or partial trait data were available for 91% of individual species (see Table S2 for individual trait coverage); no trait data was used for the two community-level mortality studies due to lack of species-level mortality rates and insufficient trait and species abundance data to derive a community-level trait mean. Due to a lack of studies that contain paired mortality and trait data, we were only able to use species-level average traits for this analysis. From the above datasets and web searches, we identified the clade, leaf habit, and wood anatomy for each species as well.
2.4 Climate data and metrics
We used the global gridded climate data of the Climatic Research Unit (CRU TS4.02) for monthly temperature and precipitation at 0.5° × 0.5° resolution (Harris, Jones, Osborn, & Lister, 2014). We also used gridded monthly precipitation data from Global Precipitation Climatology Center (GPCC v2.2; Schneider et al., 2014), potential evapotranspiration (PET) calculated via the Penman–Monteith method (Sheffield, Wood, & Roderick, 2012), soil moisture from 0 to 100 cm (Xia et al., 2012), and climatic water deficit (CWD; Abatzoglou, Dobrowski, Parks, & Hegewisch, 2018). These datasets cover a wide array of relevant hydroclimate variables, have been widely used in broad-scale forest drought-related studies in previous research (Anderegg et al., 2015, 2016), and provide a rigorous and internally consistent estimate of the mean and interannual variation of climate across studies/sites.
For climate metrics, we extracted annual values for each variable over a 1948–2008 climatology period for each study and species based on the published or estimated latitude/longitude coordinates. We note that we were not able to extract climate data for core and dry edge populations separately because relatively few studies provided the geographic coordinates required, and thus this climate data was extracted for each individual study. We then calculated the mean, standard deviation, and coefficient of variation of each variable, leading to 12 climate metrics (4 variables [temperature, two precipitation datasets, and PET] × 3 statistics) for each study and species. To estimate an average water budget for each species, we further calculated mean annual P-PET, using both precipitation datasets, mean soil moisture, and mean CWD. For each of temperature, precipitation, and PET, we also assessed whether the trend in mean or ratio of the standard deviations between the first 30 years and the second 30 years of the period, which assesses where increasing variability in climate may be occurring, was important. None of the trend in mean or standard deviation ratio variables was significant in the univariate analyses and thus these variables were not included in further analyses. Finally, to assess the accuracy of using gridded climate datasets for this analysis, we included two additional variables of MAT and MAP reported by studies themselves (available in N = 30 studies) and compared these two variables to the same variables estimated from gridded data. These study-reported metrics performed no better than gridded climate data and thus for consistency we performed further analyses with 16 climate metrics (12 above plus two P-PET metrics, soil moisture, and CWD) from gridded data.
2.5 Analyses and statistics
All statistical analyses were performed in the R computing environment (R Core Team, 2012). Meta-analysis of effect sizes for all species and subgroups of species (clade, leaf habit, wood anatomy) was performed using the rma function of the metafor package (Viechtbauer, 2010). Following common meta-analysis practices, because standard errors or variances were unavailable in the vast majority of our studies, we weighted studies by their sample sizes, quantified as Ha surveyed for mortality. We observed that there was an 800,000,000-fold variation in Ha surveyed (range 0.04–3,000,000+ Ha) across studies, because our sample included a combination of plot-based studies, forest inventory-based studies, and remote-sensing (mostly airborne remote-sensing; Table S1). Notably, however, these methods certainly differ in their accuracy in detecting and attributing mortality, with remote-sensing studies covering much broader spatial domains but also having lower accuracy in mortality determination, typically capturing standing dead trees, than field-based studies, which had a mean and median length of measurement period of 11 and 8 years respectively. Thus, we weighted each species by the square-root of the log of (Ha surveyed + 1) for each species, which resulted in an approximately 60-fold difference in weighting between the lowest- and highest-weighted studies (Figure S1). We tested to ensure that the single community-level study (Zuleta et al., 2017) did not bias the findings, which is highly unlikely because it provides only a single data-point of community-level mortality, by running all analyses with and without that study. Importantly, we performed all analyses with and without weighting and all of our results were robust to both scenarios.
Publication bias is an important consideration and challenge in any meta-analysis, but we do not believe it is a major issue here for several reasons. First, the vast majority of our studies included was descriptive in nature and included a broad suite of findings and analyses, which decreases the likelihood of a single null-result remaining unpublished. Second, all of our potential outcomes for mortality patterns—higher mortality at range edges, higher mortality at range cores, or equal mortality across populations—are mechanistically plausible and scientifically important patterns and thus would not drive any strong publication bias. Finally, we also examined a funnel plot (which plots study treatment effect against study precision) of our studies and did not observe any bias or systematic heterogeneity that would indicate a risk of publication bias.
We undertook several sensitivity analyses of our primary findings. We meta-analyzed our mortality patterns when considering (a) weighted versus unweighted by study quality (area measured for mortality; see above), (b) including study type (plot, inventory, or remote-sensing) as a moderating factor, (c) including or excluding studies where biotic agents were mentioned as a contributing factor in mortality, and (d) including or excluding studies where there may have been a slight risk of confounding factors of either (i) differential drought severity across the plots or (ii) a role of species composition in influencing mortality rate. We note that our study design was based on avoiding these two factors, but even after care in selecting studies, we felt that five studies may still have had a slight risk of these factors and thus analyzed our main findings with and without these studies. In all cases analyzed above, our primary result of increased mortality at range edges was robust (Figure S2).
We performed univariate analyses of the mortality metric against standardized trait metrics and standardized climate variables using mixed effects models via the lme4 package (Bates, Maechler, & Bolker, 2011) with study as a random effect and weighting studies as detailed above. We performed a multiple hypothesis-testing correction for each group of models using Sidak correction (Zar, 1984) method and present the corrected p values in the text.
Model selection on climate predictors of mortality patterns was performed using the dredge function in the MuMln package (Barton, 2009). Because variable importance estimates can be biased by collinear predictor variables, we first used a matrix of pairwise correlations and removed any variable with high correlations (R > .5) with other predictor variables. Each pairwise correlation was performed and the variable with the lower correlation with the dependent variable was removed. We further verified this with variance inflation factors (VIF) and confirmed that the removed variables had the highest VIF, typically VIF >2. The model selection technique of “all possible models” (i.e., all permutations of predictor variables—after removing collinear predictors) was used with all predictor variables standardized to z score prior to implementation, which allows rigorous estimation of variable importance via AIC weights and comparison among variable coefficients. Model selection was not done for trait analyses due to a limited set of species (16%) for which all traits were available. Statistical assumptions of linear models were verified by examining residual and quantile plots of the models. All maps were generated using the raster (Hijmans & van Etten, 2014) and rworldmap (South, 2011) package.
3 RESULTS
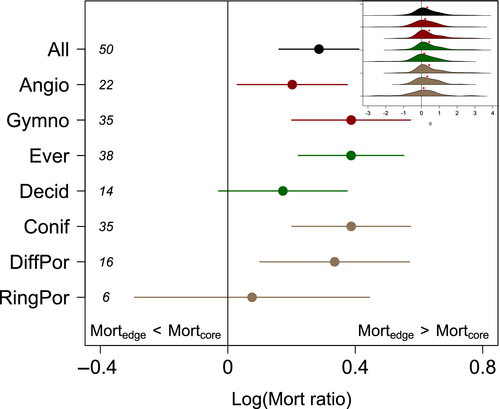
Considering all studies and species (Figure 1), dry range edges experienced increased drought-induced mortality relative to range cores (Figure 2; p < .0001). Populations at dry range edges, typically identified in studies as low elevations, south aspects, or areas with lower MAP, experienced on average 33% more mortality (95% CI: 17%–51%) in a given drought than populations at the range core. This pattern was robust to various assumptions about weighting and inclusion/exclusion of studies, such as excluding studies where biotic agents were identified as playing a role (Figure S2). Higher range edge mortality was significant in both clades (pgymno < .0001, pangio = .02) and evergreen (p < .0001), but not deciduous leaf habits (p = .09). Higher range edge mortality was more prominent in gymnosperm and evergreen species (Figure 2), although they were not statistically significantly different from angiosperm and deciduous species (p = .19 and .11, respectively).
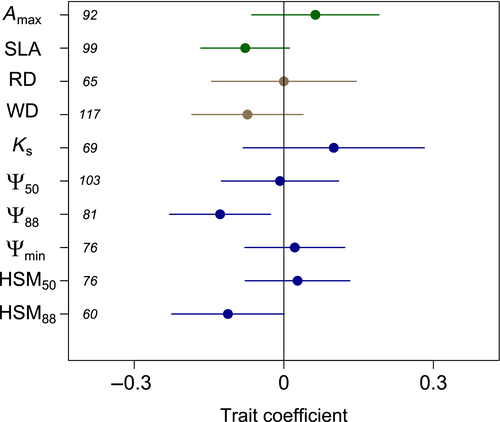
We found that one plant hydraulic functional trait was significantly associated with mortality patterns. Specifically, higher range- edge mortality was more prominent in species with more negative Ψ88 (Figure 3; p = .01). No other plant functional traits, including WD, SLA, Amax, rooting depth, or other hydraulic traits, were significantly associated with relative mortality risk (Figure 3; p > .05).
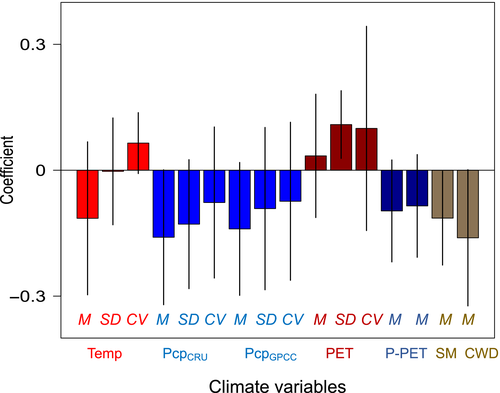
Among climate predictors of mortality patterns, higher mortality at range edges was most prominent in sites with high interannual variation in PET (Figure 4; p = .01). Along with interannual variation in PET, mean CWD and interannual variation in temperature and precipitation were the most important variables retained in multivariate model selection analyses (Table S3). Taken together, these results suggest that mortality at dry range edges is more a function of those sites' high climate variability than harsh mean climate, per se, indicating that populations forced to cope with highly unpredictable water availability are most vulnerable to extremes.
4 DISCUSSION
Multiple convergent lines of evidence indicate that plasticity, local adaptation, and ecosystem adjustments have been unable to buffer dry populations to severe droughts in most species. Elevated dry population mortality is most prevalent in gymnosperm species and evergreen species, groups expected to exhibit relatively lower degrees of plasticity in many traits due to anatomical constraints (Johnson et al., 2012), and species with higher drought tolerance (more negative Ψ88). These species may be already existing at the driest places where their physiology permits, where the realized niche is closest to the fundamental niche, and thus have a limited range for adaptation or acclimation to tolerate still drier conditions.
The importance of climate variability in mediating mortality patterns, where more variable sites experienced higher dry edge mortality, further underscores this conclusion. High interannual variability might lead plants to shift structural allocation in order to remain competitive in wet years, such as increased allocation to leaf area, which would increase stress and mortality during extreme drought, an extension of the concept of “structural overshoot” (Jump et al., 2017; Trugman et al., 2019). These results emphasize that understanding the timescales over which trees “optimize” and respond to environmental variability, for example in adjusting allocation patterns or hydraulic/anatomical traits, may be quite important for modeling the vulnerability of forests to climate-induced mortality events.
Our preliminary trait analysis indicates that more drought-adapted species may be more prone to range edge die-offs. The hydraulic trait Ψ88 is a relevant trait for drought-induced mortality because while mortality mechanisms are complex, loss of hydraulic transport is considered to be the dominant pathway through which trees die from drought (Anderegg et al., 2012; Hartmann et al., 2018) and water potentials that cross Ψ88 have been suggested as an approximate threshold for drought-induced mortality in a number of angiosperm species (Urli et al., 2013; Venturas et al., 2018), although significant uncertainty about mortality thresholds remains in most species. While other studies have highlighted the importance of the closely related Ψ50 trait (both arise from the hydraulic vulnerability curve) in cross-species patterns of mortality (Anderegg et al., 2016), which is likely better suited to capture cross-species differences in drought tolerance and vulnerability (Maherali, Pockman, & Jackson, 2004), the importance of Ψ88 in our analysis here may possibly be due to its potential to capture absolute mortality thresholds within a species. We hypothesize that the lack of significant patterns in other standard drought tolerance traits (e.g., RD, HSM) may be due to data limitations in the number of species with trait data, measurement technique or curve-fitting differences in quantifying traits, or the use of species-level average trait values rather than local, in situ trait values, which are inherent uncertainties in our meta-analysis approach. Our results here are broadly consistent, however, with the critical role of the hydraulic vulnerability curve in mediating both spatial and cross-species patterns in drought-induced mortality (Choat et al., 2018).
While our results indicate that compensating mechanisms were not sufficient to buffer drier populations from higher mortality rates during drought, a number of potential compensating mechanisms could in theory operate at the tree or ecosystem level to reduce drought vulnerability of drier populations. Drier populations within a species may exhibit more drought-tolerant traits, such as more embolism-resistant xylem (Anderegg, 2015; López et al., 2013), rooting distribution differences (Williams & Ehleringer, 2000), and lower leaf area per sapwood or root area (Martínez-Vilalta et al., 2009; Rosas et al., 2019; Trugman et al., 2019). At a community/ecosystem level, lower tree densities and lower leaf area found in drier populations can reduce water loss and local water stress during drought (Martínez-Vilalta et al., 2009; Rosas et al., 2019; Trugman et al., 2019) and thus could buffer those populations from experiencing mortality.
Despite the fact that compensating mechanisms seem to be unable to completely buffer dry populations, we do find evidence that they offer some mortality buffer, as indicated by the smaller edge mortality effect in angiosperm species, which have been documented to have more variable and plastic hydraulic traits compared to gymnosperms (Figure 2). As a caveat, we note that some of the studies in our meta-analysis examined local/regional range limits, rather than the full geographic range. However, examining population responses along a moisture gradient can be fruitful for understanding biotic and abiotic factors controlling biogeographic boundaries (Anderegg & HilleRisLambers, 2019). Furthermore, our results were robust when considering only those studies that examined large-scale or full species ranges (Figure S2). Finally, we note that our compilation of studies is primarily focused on temperate, Mediterranean-climate, and boreal regions, and contains only a handful of tropical studies (Table S1) due to a lack of studies that measure drought-induced mortality of individual species across climate gradients in the tropics.
Our results provide a strong and independent validation of projections of range shifts and dry edge mortality in species distribution and mechanistic vegetation models, suggesting that current intraspecific variation in most cases has been insufficient to buffer dry populations. Furthermore, our synthesis provides guidance for development of mortality algorithms in large-scale vegetation models, which is a major priority in plant ecophysiology and Earth system modeling (Fisher et al., 2018; McDowell et al., 2011), by linking mortality sensitivity to functional traits and for land management decisions to prepare for and mitigate drought-induced mortality triggered by climate change. Ultimately, improved understanding and prediction of drought-induced tree mortality has a strong potential to inform projections of the impacts of climate change on biodiversity, species extinctions, and the land carbon sink in the 21st century.
ACKNOWLEDGEMENTS
W.R.L.A. was supported by the David and Lucille Packard Foundation, National Science Foundation grants 1714972 and 1802880, and the USDA National Institute of Food and Agriculture, Agricultural and Food Research Initiative Competitive Programme, Ecosystem Services and Agro-ecosystem Management, grant no. 2018-67019-27850. A.T.T. acknowledges support from the USDA National Institute of Food and Agriculture Postdoctoral Research Fellowship Grant No. 2018-67012-28020. L.D.L.A. was supported by NSF Postdoctoral Research Fellowship Grant No. DBI-1711243 and a NOAA Climate & Global Change Fellowship. Any opinions, findings, and conclusions or recommendations expressed in this material are those of the author(s) and do not necessarily reflect the views of the National Science Foundation.


