Valuing urban green spaces in mitigating climate change: A city-wide estimate of aboveground carbon stored in urban green spaces of China's Capital
Abstract
Urban green spaces provide manifold environmental benefits and promote human well-being. Unfortunately, these services are largely undervalued, and the potential of urban areas themselves to mitigate future climate change has received little attention. In this study, we quantified and mapped city-wide aboveground carbon storage of urban green spaces in China's capital, Beijing, using field survey data of diameter at breast height (DBH) and tree height from 326 field survey plots, combined with satellite-derived vegetation index at a fine resolution of 6 m. We estimated the total amount of carbon stored in the urban green spaces to be 956.3 Gg (1 Gg = 109 g) in 2014. There existed great spatial heterogeneity in vegetation carbon density varying from 0 to 68.1 Mg C ha-1, with an average density of 7.8 Mg C ha−1. As expected, carbon density tended to decrease with urban development intensity (UDI). Likely being affected by vegetation cover proportion and configuration of green space patches, large differences were presented between the 95th and 5th quantile carbon density for each UDI bin, showing great potential for carbon sequestration. However, the interquartile range of carbon density narrowed drastically when UDI reached 60%, signifying a threshold for greatly reduced carbon sequestration potentials for higher UDI. These findings suggested that urban green spaces have great potential to make contribution to mitigating against future climate change if we plan and design urban green spaces following the trajectory of high carbon density, but we should be aware that such potential will be very limited when the urban development reaches certain intensity threshold.
1 INTRODUCTION
Vegetation have been widely evaluated in the capacity of generating provisioning (e.g., food and water production), regulating (e.g., carbon storage and climate change mitigation), supporting (e.g., nutrient cycling), and cultural (e.g., aesthetic benefits) ecosystem services (Millennium Ecosystem Assessment (MEA), 2005). Although cities are acknowledged to mainly rely on the supply of those services from natural ecosystems, the role of urban areas themselves in the direct provision of ecosystem services are commonly ignored and understudied (Gaston, Ávila-Jiménez, Edmondson, & Jones, 2013). In fact, green spaces can themselves be vitally important because they have been indicated as promising for providing local services to urban residents (Pulighe, Fava, & Lupia, 2016). More than 50% of the world's population now resides in urban areas and this figure is projected to be about 68% by 2050 (UN, 2018), although urban areas only occupy less than 3% of the earth's terrestrial surface (Brown, 2001). The unprecedented urbanization has profoundly shaped urban ecosystems with fragmented landscape, disturbed biodiversity, and distinct biogeochemical cycle (Delphin, Escobedo, Abd-Elrahman, & Cropper, 2016; He, Liu, Tian, & Ma, 2014; Kaushal, McDowell, & Wollheim, 2014). In particular, human activities in cities are estimated to contribute about 71% of the energy-related carbon dioxide (CO2) emissions (Grimm et al., 2008). Nevertheless, a growing body of research is demonstrating that urban ecosystems could store significant amounts of carbon (Churkina, Brown, & Keoleian, 2010; Davies, Edmondson, Heinemeyer, Leake, & Gaston, 2011; Ge & Zhao, 2017; Gratani, Varone, & Bonito, 2016; Nowak, Greenfield, Hoehn, & Lapoint, 2013; Zhao, Zhu, Zhou, Huang, & Werner, 2013), and urban green spaces can serve as an effective strategy in offsetting CO2 emissions (Dorendorf, Eschenbach, Schmidt, & Jensen, 2015). Trees in urban forests which account for 3% of the total land area of the United States can sequester about 14% of the entire amount of sequestration by the nation's forests (Heath, Smith, Skog, Nowak, & Woodall, 2011). An empirical study showed that the mean aboveground live biomass across the Seattle urbanizing region was 89 ± 22 Mg C ha−1, which was larger than the average of 53.5 Mg C ha−1 for all US forests (Hutyra, Yoon, & Alberti, 2011). Cities have been regarded as critical locations where impacts of global climate change on human populations will be focused, and study on the regulating services of carbon storage provided by urban green spaces is increasingly important to better understand the global carbon cycle and inform sustainable development in cities (Mitchell et al., 2018).
Many empirical studies have shown the usefulness of remote sensing satellite data (e.g., Landsat, SPOT, and Quickbird) combined with field survey data for quantifying the carbon pool of urban trees and its spatial variation caused by the rapid urbanization (Lee, Ko, & McPherson, 2016; Raciti, Hutyra, & Newell, 2014; Rao, Hutyra, Raciti, & Finzi, 2013). Urban–rural gradient monitoring and multiresolution comparative analyses are increasingly popular approaches to identify the urbanization effects on aboveground vegetation carbon in urban ecosystems (Huytra et al., 2011; Raciti et al., 2014). Frequent interaction between humans and land covers in cities might create smaller or more segregated urban green space patches that are embedded in heavily urbanized areas (Botzat, Fischer, & Kowarik, 2016; Qian, Zhou, Yu, & Pickett, 2015). Also, landscape metrics as quantitative indices indicating the spatial heterogeneity of green space patches could facilitate the analysis of land cover change effects through linking landscape patterns with ecological functions (Qian et al., 2015; Ren et al., 2013; Zhang et al., 2017). In the first 30 years of the 21st century, fast urban land cover increase is forecasted to mainly take place in cities of developing countries (Seto, Guneralp, & Hutyra, 2012). However, spatially explicit studies were intensively clustered in developed countries with increasing case studies of Chinese cities in recent several years (Liu & Li, 2012; Yao, Liu, Zhao, Long, & Wang, 2015). Many studies focus on urbanization-induced variation in carbon storage using coarse land use types (e.g., forest, farmland, and urban land), and there is limited efforts elucidating the relationship between urbanization intensity and carbon storage in urban green spaces. For example, estimation results from 219 sampling plots in Harbin revealed that the tree carbon storage density varied along the ring road-based urban–rural gradients (Lv et al., 2016). Using Landsat TM images and inVEST model, Tao, Li, Wang, and Zhao (2015) found that the carbon density decreased with the increasing intensity of urban development with a 1.5% average annual decrease from 1986 to 2011 in the urbanized areas of Changzhou, China. To value urban green spaces in mitigating climate change, a critical emerging research need is to characterize carbon storage variation in response to urbanization intensity and landscape structure change, and then understand the potential of appropriately managing urban green space landscape to enhance the biological carbon storage in densely urbanized Chinese cities.
China have experienced dramatic demographic urbanization and urban land expansion with the rapid economic growth during the past four decades (Sun & Zhao, 2018; Zhao et al., 2015). Beijing is one of the most representative cities with rapid urbanization and increasing energy consumption and carbon emissions in China. It is the second highest city of energy consumption in China, and the total CO2 emissions of Beijing in 2030 might be 0.43 times higher than that of 2005 (Feng, Chen, & Zhang, 2013). Urban area in Beijing has increased from 801 to 2,452 km2 over the past three decades, with an annual expansion rate of 3.7% (Wu, Zhao, Zhu, & Jiang, 2015). Trade-offs between rapid urbanization and environmental protection will be a major challenge for Beijing's sustainable development (Peng, Xie, Liu, & Ma, 2016). According to the carbon emission reduction target of “the 13rd Five-Year Plan of Beijing (2016–2020),” the CO2 emissions per unit of GDP in 2020 is to decrease by 20.5% compared with that in 2015 and the year 2020 is supposed to be the peak of total CO2 emissions, which is a big challenge for Beijing (Liu, Zong, Zhao, Chen, & Wang, 2014). In order to improve the ability of adaptation to climate change, the local government have launched tree planting programs such as the “Million Mu Trees Campaign” (one Mu equals to 1/15 ha), “Planting Where Possible” policy, and “Country Parks Circle Projects” to enhance the ecosystem services of carbon sequestration provided by urban green spaces (Jim & Chen, 2009). However, the ecological consequences of those tree planting policies are far from being understood (Yang, McBride, Zhou, & Sun, 2005). There is a lack of spatially explicit estimates of aboveground carbon storage over the city-wide urbanized area of Beijing, let alone the other megacities of China are remains largely undocumented. Humans take staple responsibility for the future of urban ecosystems and distinct spatial patterns of carbon storage could be created through elaborately altering and designing the urban green spaces (Strohbach & Haase, 2012). Thus, there is an urgent need for research on carbon storage density along urbanization intensity gradient to understand how urban carbon stocks respond to urban expansion and help decision-makers develop practical urban landscape management strategies to increase aboveground carbon stocks and achieve CO2 emissions reduction target in the capital of China.
Specifically, the objectives of this study were to: (a) quantify the aboveground carbon storage by urban green spaces in urbanized areas; (b) map and investigate the spatial distribution and variation of carbon storage in response to urban development intensities; and (c) explore the relationship between the landscape structure (composition and configuration) and aboveground carbon storage. These research efforts are urgently needed to investigate the urbanization effects on urban green space services and consequently benefit landscape design and management to achieve sustainable development for rapidly urbanizing cities of China.
2 MATERIALS AND METHODS
2.1 Study area
Beijing is located between 39°28′N–41°25′N and 115°25′E–117°30′E, northwestern of the North China Plain, surrounded by Yanshan Mountain in the west, north, and northeast. As the capital city of China, Beijing contains 16 districts with an administrative area of approximate 16,807 km2 (Figure 1). Beijing has a predominantly warm temperate continental monsoon climate. The annual frost-free period is about 186 days, the annual temperature of 10°C, and the average annual precipitation is 600 mm (Xie et al., 2015). Beijing has experienced rapid urban expansion during the past three decades and the urban area has increased from 801 to 2,452 km2 during 1980–2010 (Wu et al., 2015), and its population increased from 8.72 million in 1978 to 19.62 million in 2010 (BMSB, 2011). The central six districts (i.e., Chaoyang, Dongcheng, Fengtai, Haidian, Shijingshan, and Xicheng) have an area of 1,380 km2 (Figure 1b) and accommodate 59.7% of the total permanent population of Beijing in 2010 (Beijing Municipal Statistics Bureau, 2011). The most developed area of Beijing is the area within the 5th Ring Road where four ring roads (i.e., 2nd, 3rd, 4th, and 5th Ring Road) were built from the city center to the fringe in 1992, 1999, 2001, and 2003, respectively (Figure 1c). Most of the cropland distributed outside the 5th Ring Road.
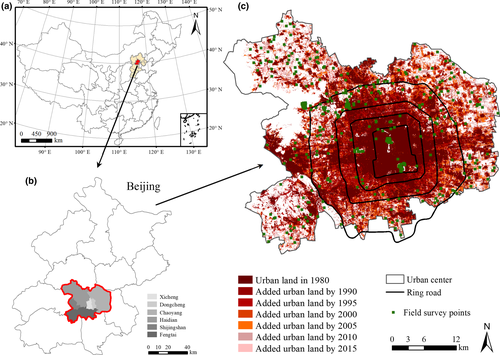
The local government have made great efforts (e.g., “Planting Where Possible” policy) to increase the vegetation coverage in rapidly urbanizing region since the ecosystem services provided by urban vegetation can significantly contribute to the well-being of urban residents in Beijing (Qian et al., 2015). However, Beijing is one of the most representative cities in China, which are confronted with serious conflicts between rapid urbanization and ecosystem service maintenance (Peng et al., 2017). Therefore, we chose urban Beijing as the case area for spatially explicit research on the aboveground carbon storage of urban trees. Since this study mainly focuses on urban trees, the study area was restricted to the six central districts of Beijing. We finally excluded the areas higher than 100 m above sea level because the main part of it is a mountainous region such as the Fenghuangling and Badachu Scenic Resort in the Haidian and Shijingshan districts, with considerably different landscape feature from urbanized region.
2.2 Field survey
The field survey was conducted between May and November in 2014. The plot size was set as 900 m2. The shapes of the plots used in this study were adjusted according to the local condition of each plot due to the heterogeneous green space landscape in urban ecosystem. Most of the surveyed plots were regular square shape while the shapes of those irregular plots were adjusted to guarantee the consistent survey area of 900 m2. A random sampling method was adopted. A total of 326 plots within the six central districts of Beijing were selected in this study (Figure 1c). One hundred and sixty-five plots were located within the 5th Ring Road and 161 plots were in the suburban area of Beijing. Because within the 4th Ring Road, 30 × 30 sized green spaces were mostly located on sensitive government agency or private managed neighbors where access was denied, we conducted vegetation survey mainly in urban parks (e.g., the Temple of Heaven Park, Beihai Park, and Yuyuantan Park). The central locations of the plots were positioned by GPS (Garmin GPSmap 629sc). Due to the relatively small contribution to carbon storage from shrubs and herbs (Davies et al., 2011) in urban ecosystem, we mainly focused on the aboveground carbon storage estimation of urban trees. During the field survey, we collected the following information for trees: species, number of each species, diameter at breast height (1.3 m, DBH >5 cm), tree height, and health condition of each measured tree.
2.3 Satellite image processing and urban vegetation classification
 (1)
(1)The land covers in this study were classified into four categories (i.e., vegetation, impervious surface, water body, and bare soil) with the object-based image analysis (OBIA) approach. The SPOT 6 images acquired in October 15, 2014 explicitly showed the distribution of vegetative area in Beijing and thus can be used to effectively map urban green spaces (i.e., vegetated areas). Vegetation consisted of all vegetated areas, which referred to as green space. Impervious surface included transportation, industrial, commercial, and residential space. Water bodies were mainly lakes and rivers. Bare soil referred to lands under construction and non-vegetative areas. In OBIA approach, an image is first segmented into objects that are classified according to both spectral and spatial information, such as color, shape, size, texture, and other features (Myint, Gober, Brazel, Grossman-Clarke, & Weng, 2011). When using high spatial resolution images to quantify the spatial distribution of land covers in urban ecosystems, the object-based image classification method is superior to traditional pixel-based method (Qian et al., 2015). Specifically, we use eCognition Developer 8.7 to segment the four-band SPOT 6 images with spatial scale parameter of 30 to capture the high heterogeneity, and then, we classified those images with a membership function nearest neighbor classification method (Walsh et al., 2008). This study used the high spatial resolution images in Google Earth Pro to conduct accuracy assessment (Zhao et al., 2015). Also, 300 stratified random sampling points were created in Erdas Imagine 2015. The overall accuracy of classification was 90.7% and the accuracy of vegetation was 92.4%, which can meet the accuracy requirements of land cover change evaluation (Foody, 2002).
2.4 Biomass calculation and carbon storage estimation
 (2)
(2)| Tree species | Biomass of stem | Biomass of branch | Biomass of leaf | Biomass of Bark | Aboveground biomass | References |
|---|---|---|---|---|---|---|
| Platycladus orientalis | lgWS = 0.6682 lg(D2H)−0.7426 | lgWB = 0.6497 lg(D2H)−0.9963 | lgWL = 0.5385 lg(D2H)−0.9448 | Wang, Yuan, Ye, and Zhang (2009) | ||
| Robinia pseudoacacia | Ws = 0.312 + 0.016D2H | WB = 0.161 + 0.003D2H | WL = 0.091 + 0.003D2H | He, Huang, Duan, and He (2007) | ||
| Koelreuteria paniculata | WS = 0.587 + 0.006D2H | WB = 0.059 + 0.001D2H | WL = 0.029 + 0.001D2H | He et al. (2007) | ||
| Pinus tabuliformis | WS = 0.274×D1.898 | WB = 0.001×D3.284 | WL = 0.009×D2.433 | Sun (2011) | ||
| Pinus bungeana | WS = 0.119×D2.180 | WB = 0.016×D2.621 | WL = 0.034×D2.061 | WP = 0.011×D2.172 | Li (2013) | |
| Fraxinus chinensis | WAG = 2.1893 + 0.032949D2H | Tabacchi, Cosmo, and Gasparini (2011) | ||||
| Abies | WS = 0.057D2.48 | WB = 0.012D2.41 | WL = 0.083D2.3 | Liu and Li (2012) | ||
| Ginkgo biloba | WS = 0.044 + 0.042D2H | WB = −0.011 + 0.005D2H | WL = −0.820 + 0.040D2H | He et al. (2007) | ||
| Acer palmatum | WAG = 0.0851D2.535 | Wang, (2006) | ||||
| Acer truncatum | WS = 0.05056(D2H)0.8812 | WB = 0.01151(D2H)0.9786 | WL = 0.01248(D2H)0.6869 | WP = 0.01398(D2H)0.8358 | Yan (1997) | |
| Salix | WAG = 0.1368D2.408 | Wang et al. (2006) | ||||
| Eucommia ulmoides | Ws = 0.910 + 0.030D2H | WB = 0.208 + 0.002D2H | WL = 0.055 + 0.002D2H | He et al. (2007) | ||
| Ulmus pumila | WS = 0.043D2.87 | WB = 0.0074D2.67 | WL = 0.0028D2 | Liu and Li (2012) | ||
| Populus | WS = 0.006(D2H) 1.098 | WB = 0.001(D2H)1.157 | WL = 0.012(D2H)0.685 | Li, Li, and Peng (2007) | ||
| Other conifers | lnWAG = −2.2796 + 2.2874lnD | Jo (2002) | ||||
| Other broadleaf trees | lnWAG = −3.5618 + 2.6645lnD | Jo and McPherson (1995) |
Note
- D and H represent diameter at breast height and tree height, respectively.
where  is the average carbon storage density for the jth survey plot;
  is the carbon storage for the ith tree species of the plot; n is the tree species number; and
  is the plot area for the jth plot which equals to 900 m2 in this study.
 (3)
(3)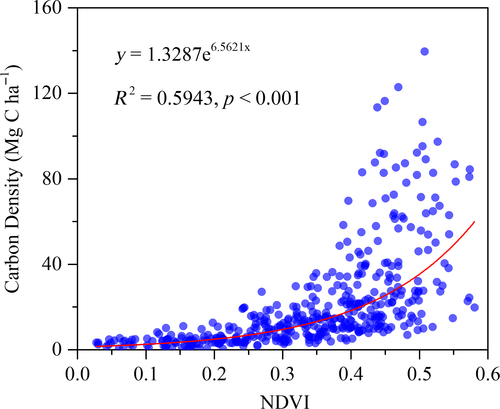
We applied the Equation (3) to map the spatial pattern of the city-wide carbon storage using ArcGIS 10.2 software. Since the maximum NDVI value is 0.6 from the surveyed spots in this study, estimates from NDVI values beyond 0.6 might not be reliable. The pixels with NDVI higher than 0.6 were excluded from the carbon storage estimation in this study.
In order to reveal the underestimation of biomass in urban areas from medium-resolution images which have been found in some urban ecosystems (Davies, Dallimer, Edmondson, Leake, & Gaston, 2013; Raciti et al., 2014), we not only used the SPOT 6 images to map the carbon storage patterns in high resolution, but also extracted the 30 m resolution NDVI data (August 19, 2014) from cloud-free Landsat 8 Operational Land Imager (OLI) sensors to compare the SPOT quantification results with the coarser resolution estimates.
2.5 Relationship between carbon storage and urban expansion
The administrative divisions of six districts (i.e., Chaoyang, Dongcheng, Fengtai, Haidian, Shijingshan, and Xicheng) were used to quantify the carbon stocks and compare differences in carbon density between old (i.e., Dongcheng and Xicheng) and younger (i.e., Chaoyang, Fengtai, Haidian, and Shijingshan) areas of the central region of Beijing. In addition, we compared the carbon storage density of four regions between ring roads which may represent the urban–rural gradients or urbanization of Beijing according to previous studies (Huang, Su, Zhang, & Koh, 2010; Qian et al., 2015).
 (4)
(4)where UDIi is the urban development intensity for spatial unit i, UAi represents the urban land area of spatial unit i, and TAi is the total area of the spatial unit i. The spatial unit was a 1 × 1 km grid in this study.
We then calculated the average UDI at a 1% interval and the corresponding value of the 95th, 50th, and 5th quantile carbon density as well as the interquartile range to explore how spatial variation in UDI affects carbon stocks. Piecewise regression was used to identify the thresholds of carbon density variation with UDI (Toms & Lesperance, 2003). Green spots with especially high carbon density were illustrated with examples of the false color composite of SPOT 6 data. SPOT estimates were overlaid with the medium-resolution estimates from Landsat data to make explicit comparison.
2.6 Relationship between carbon storage and landscape structure
To explore the influence of landscape composition and composition of green spaces on carbon density under different UDI levels, we calculated the landscape metrics of urban green space grids with the high (in the top 10%) and low (in the bottom 10%) carbon density of each UDI bin (i.e., 0–5, 5–10, 10–15, 15–20, 20–25, 25–30, 30–35, 35–40, 40–45, 45–50, 50–55, and 55–60) and analyzed its relationship with carbon storage. Although landscape structure can be captured by a variety of landscape metrics, we should take the redundancy into account and select representative metrics (Li & Wu, 2004). In this study, we explored the relationship between landscape structure (configuration and composition) and aboveground carbon storage from five aspects (i.e., diversity, area, shape, dispersion, and aggregation) by adopting six landscape metrics. The six metrics were: (1) percent cover of green spaces (PLAND); (2) Shannon's diversity index (SHDI); (3) mean patch area (AREA_MN); (4) mean value of shape index (SHAPE_MN); (5) mean Euclidian nearest-neighbor distance (ENN_MN); and (6) aggregation index (AI) (Table 2, McGarigal, Cushman, Neel, & Ene, 2002). PLAND and SHDI indicate the change in landscape composition which can respond to anthropogenic disturbance. Some studies showed that the proportion of green space patches might decrease where the intensity of urbanization became higher, with an increase in land cover diversity (Godwin, Chen, & Singh, 2015; Qian et al., 2015). On the other hand, the landscape configuration was measured using the remaining four metrics to reflect the fragmentation degree and patch shape complexity of urban green spaces brought about by the rapid urbanization process of Beijing (Qian et al., 2015). These metrics were calculated for each 1 × 1 km spatial unit based on the green space map using Fragstats 4.2 with patch neighbors defined by the “8-cell rule” (McGarigal et al., 2002). The spatial distributions of aboveground carbon density were quantified and mapped by ArcGIS 10.2 software. Pearson correlation coefficients (p < 0.05) were given to analyze the relationship between landscape structure and carbon storage density. Statistical analyses of the data were performed in R (R Development Core Team, 2013).
| Metric (unit) | Abbreviation | Description |
|---|---|---|
| Percent cover of green space (%) | PLAND | Proportional abundance of green space in the landscape |
| Shannon's diversity index | SHDI | A measure of the diversity of patch types in a landscape that is determined by both the number of different patch types and the proportional distribution of area among patch types |
| Mean patch area (ha) | AREA_MN | Total patch area divided by the patch number |
| Mean patch shape index | SHAPE_MN | Mean value of shape index |
| Mean Euclidian nearest-neighbor distance (m) | ENN_MN | Mean distance to the nearest neighboring patch of green space based on the edge-to-edge distance |
| Aggregation index (%) | AI | Proportional neighboring patches of green space |
3 RESULTS
3.1 Field results
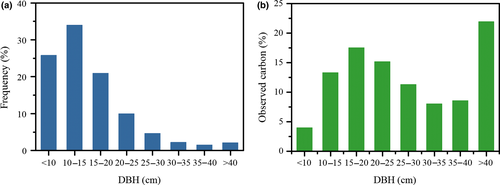
We measured 10,020 stems of 26 species. Top tree species sampled are Populus tomentosa (Carr.), Salix babylonica, and Sophora japonica (Linn.) which added up to represent 56% of the sampled trees. Other common species include Pinus tabuliformis (Carr.), Robinia pseudoacacia (L.), Sabina chinensis (L.) Ant., Ginkgo biloba (L.), and so on. The average DBH of all surveyed trees is 15.5 cm. Analyses of the field survey results showed that urban trees in Beijing city are dominant (80.8%) by small trees (DBH <20 cm) (Figure 3a). Large stems >20 cm in DBH, while uncommon, stored 65.1% of the observed carbon storage (Figure 3b). Especially stems with DBH >40 cm contains 22.0% of the field-surveyed carbon storage.
3.2 Spatial distribution of aboveground carbon storage
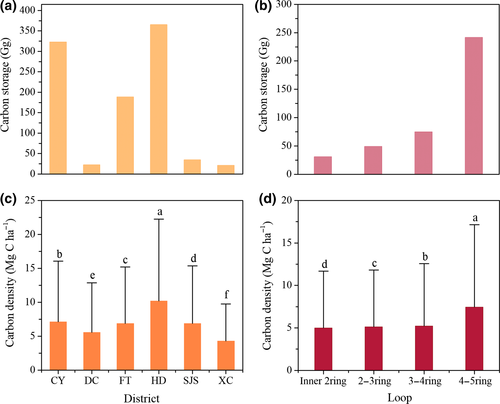
The spatial distribution of the aboveground carbon storage was mapped from Landsat (Figure 4a) and SPOT 6 (Figure 4b) data. The aboveground carbon storage estimates from high-resolution data (Figure 4b) showed that an estimated 956.3 Gg (1 Gg = 109 g) of carbon was stored by the aboveground vegetation of six districts of Beijing, and the carbon density of urban trees in the study area was 7.8 Mg C ha−1. The carbon storage of urban trees was highly heterogeneous. The carbon storage of Dongcheng and Xicheng which are the most heavily urbanized area of Beijing were significantly (p < 0.05) lower than Chaoyang, Fengtai, and Haidian (Figure 5a). Haidian district had the highest carbon stocks in the central six districts of Beijing. Differences in carbon density were much smaller than the overall carbon stocks differences among each district (Figure 5a,c). The carbon stocks increased constantly from the inner 2nd Ring Road to the outer 5th Ring Road (Figure 5d) with an abrupt increase in carbon stocks from the area between the 3rd and 4th Ring Road to the area between the 4th and 5th Ring Road (Figure 5c).
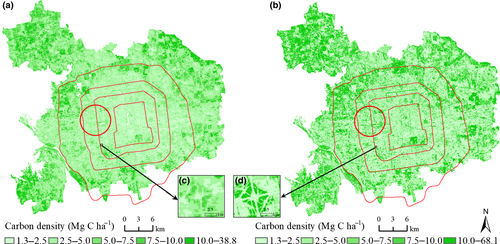
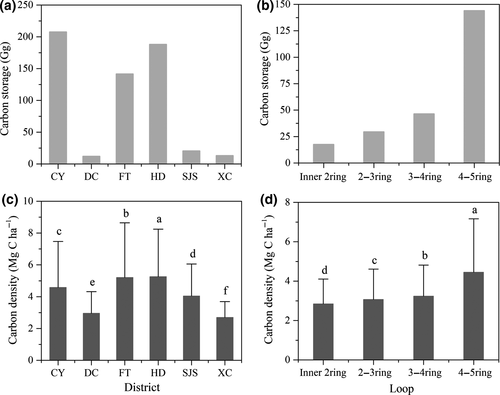
Comparatively, medium-resolution (30 m) Landsat product (Figure 4a) showed different spatial patterns of aboveground carbon storage from the SPOT estimates. It is noticeable that medium-resolution estimates failed to reveal the carbon storage capacity of dispersed small urban green spaces (marked by circle in Figure 4) that are mostly distributed in heavily urbanized area (i.e., region within the 5th Ring Road), and we found significant (p < 0.05) differences in the total stocks and carbon density variation among each urban districts of Beijing. Estimates of carbon stocks from the Landsat satellite images (Figure 6) showed a significant (p < 0.05) underestimation of urban vegetation's contribution, compared with SPOT product. Although the variation in carbon stocks and carbon density among each ring road remained similar, the total carbon stocks of Beijing were 582.8 Gg in the six central districts and 237.2 Gg in the region within the 5th Ring Road (Figure 6a,b), both of which are approximately 60% of results from SPOT remote sensing data (Figure 5). In addition, TM product (Figure 6c) failed to illustrate the high carbon storage density of Haidian district and the Dongcheng and Xicheng estimates were only about half of the SPOT product (Figure 5c).
3.3 Relationship between carbon storage and urban development intensity
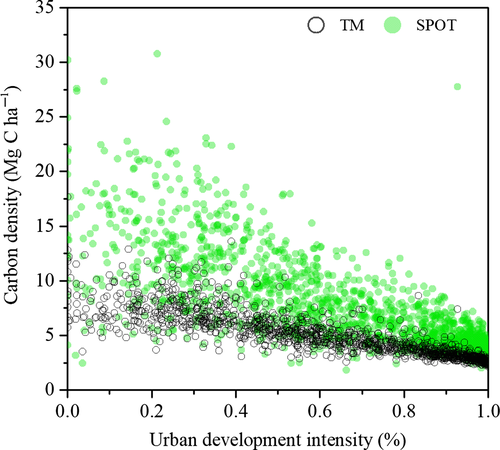
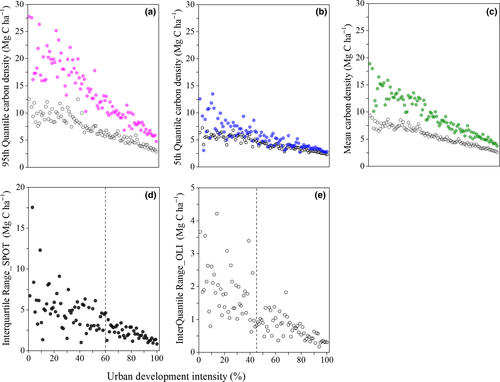
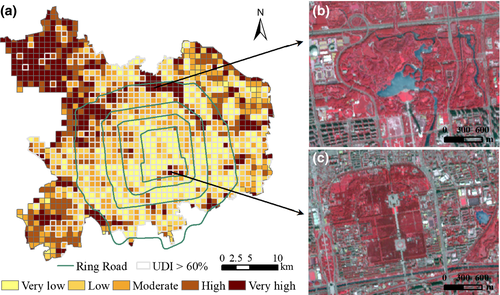
Carbon density generally declined with increasing UDI for both SPOT and Landsat estimates in the study (Figure 7). Figure 8 further illustrated the relationship between carbon storage and UDI at 1% interval. The average carbon density generally decreased with the increase in UDI. However, when UDI was less than 60%, the 95th quantile carbon density (Figure 8a) fluctuated greatly along the UDI, and large differences presented between the 95th and 5th quantile carbon density for each UDI bin (Figure 8a,b). When UDI was larger than 60%, the interquartile range (IQR) of carbon density at each UDI interval sharply reduced (Figure 8d). It is also noticeable that all of the 95th, 50th, and 5th quantile carbon density decreased consistently and sharply with the increase in UDI. For estimates from Landsat data, although the general decreasing patterns of the 95th, 50th, and 5th quantile carbon density with increasing UDI was similar, its 95th quantile values (black hollow point in Figure 8a) was lower than that of SPOT estimates and the IQR for Landsat (Figure 8e) narrowed down sharply when UDI was higher than 45%. Figure 9a showed that areas with UDI higher than 60% were mainly distributed within the 5th Ring Road of Beijing and the grids with high carbon storage density distributed in large urban parks such as Beijing Olympic Forest Park (Figure 9b) and Temple of Heaven Park (Figure 9c).
3.4 Relationship between carbon storage and landscape structure of urban green spaces
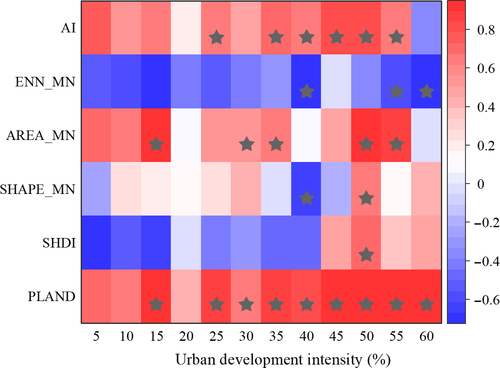
Scatter plots showed that variation in carbon was strongly correlated with landscape structure, but the significance (p < 0.05) of the relationship between carbon storage density and landscape metrics (Figure 10) changed greatly with UDI. The significant relationship was relatively stable for PLAND which showed positive correlation with carbon storage density where the UDI was higher than 25%. When the UDI level was higher than 35%, areas with high AI tended to have high density of carbon storage. As for landscape metrics of describing shape complexity and patch size, the correlation relationship was discontinuous and only significant at UDI of 25%–30% and 45%–50% for SHAPE_MN, and significant at UDI of 35%–40% and 45%–50% for AREA_MN. It is noteworthy that the carbon storage density decreased with the increase in ENN_MN which indicated the distance to the nearest neighboring patch of urban green space.
4 DISCUSSION
Rapid urban expansion has the potential to result in significant impacts on vegetation carbon storage, with high population densities and continually growing urban areas, especially in cities of developing countries (Seto et al., 2012). Using Beijing, the capital of China, as a case study, our results provide important insights into the landscape drivers of aboveground carbon stocks by urban green spaces across urbanization gradients. Conscious planning and design of urban green space landscape aimed to maintain and maximize carbon stores could be incorporated into urban management in order to mitigate future climate change.
4.1 Comparison of aboveground carbon storage and carbon density in six central districts of Beijing with other studies
The mean aboveground carbon storage density of urban green spaces in six central districts (i.e., Chaoyang, Dongcheng, Fengtai, Haidian, Shijingshan, and Xicheng) of Beijing is 7.8 Mg C ha−1. The average value of region within the 4th Ring Road is 5.2 Mg C ha−1 lower than the 7.4 Mg C ha−1 from the previous study of Beijing in 2002 by Yang et al. (2005). It might be attributed to the astonishing urban expansion during the past decade of Beijing as the capital of China and the core city of the Jing-Jin-Jin Urban Agglomeration, resulting in increased proportion of impervious surface and excessive disturbance to urban green space landscape such as replacing prior patches with sparse and young trees (Qian et al., 2015; Sun & Zhao, 2018; Wu et al., 2015). Therefore, our results highlight the overall negative urbanization effects on aboveground carbon storage in highly urbanized areas of mega cities, despite the possible enhancement of urban environments on urban vegetation growth (Zhao, Liu, & Zhou, 2016).
The spatial variation in aboveground carbon density that we estimated across the central six districts of Beijing emphasized the importance of quantifying carbon stocks using fine-resolution data. Fragmented urban development often leads to small green patches and isolated trees, and therefore, fine-spatial resolution remote sensing data used in this study is particularly beneficial to illustrate the spatial variation in carbon storage (Chen et al., 2017; Mitchell et al., 2018). Due to the mixed-pixel problem, each pixel is represented by the predominant land cover, and thus, maps from medium-resolution remote sensing data such as Landsat could not capture the finely grained green spaces in urbanized areas (Davies et al., 2013; Raciti et al., 2014). Analyses in our study revealed that estimates from Landsat data in the urban ecosystems lost the important information of large spatial variability of carbon density. An analysis in Leicester, UK, found that moving from 10 to 250 m resolution land cover data meant a 76% underestimate of aboveground carbons stores (Davies et al., 2013). Comparative analyses from SPOT and Landsat (Figures 5 and 6) in this study revealed a 39% underestimate of carbon storage from 6 to 30 m resolution remote sensing data. But using fine-resolution data to estimate carbon storage presents its own challenges including intensive computation efforts, available spatial extent and temporal frequency (Raciti et al., 2014). We thus underlined the trade-offs in estimating carbon storage while higher resolution data for urban areas are essential to illustrate the potential of urban green spaces in mitigating climate change.
Compared with other studies including the estimates from mountainous region adjacent to urbanized areas, like Shenyang with 33.2 Mg C ha−1 (Liu & Li, 2012), Hangzhou with 30.25 Mg C ha−1 (Zhao et a., 2010), and Xiamen with 20.8 Mg C ha−1 (Ren, Wei, & Wei, 2011), the relatively low density of city-wide estimated carbon storage of Beijing might be related to inconsistent definition of urban vegetation (Mitchell et al., 2018) and climate background (e.g., subtropical monsoon climate for Hangzhou). But the result was much higher than the city with the same temperate monsoon climate-Xi'an with 2.77 Mg C ha−1 which was also estimated for its heavily urbanized areas using field survey data and NDVI derived from satellite images (Yao et al., 2015). Although both of Beijing and Xi'an have long history of urban development, the arid climate of Xi'an might impact the carbon storage services of urban vegetation. Therefore, to facilitate the local level authorities make effective urban management strategy to mitigate future climate change, spatially explicit intracity analyses on the landscape drivers are more needed than coarse regional study.
4.2 Landscape structure drivers of aboveground carbon storage in urban green spaces
The average carbon density of the United States was estimated to be 76.9 Mg C ha−1 by Nowak et al. (2013) using urban tree field data from 28 cities. Chen (2015) collected empirical data from published literature and found that the average carbon density of vegetation of the urban green infrastructure in 35 major Chinese cities was only 21.34 Mg C ha−1. The low vegetation carbon density of Chinese cities on one hand can be attributed to the relative young vegetation stands (Chen, 2015), and on the other hand might be related to the landscape structure modification by the fast urban expansion process. During the past four decades, China's urbanization is characterized by significant increase in impervious surface, which has profoundly changed the local land cover types (Liu et al., 2005; Wang et al., 2012). Rapid urban expansion has significantly affected the important ecosystem services of mitigating and adapting to climate change provided by urban vegetation (Tao et al., 2015; Zhou, Wang, & Cadenasso, 2017). Our results showed that the correlation relationship between aboveground carbon storage and landscape metrics varied dramatically with different urbanization intensity. This study revealed that in high urbanization intensity, aboveground carbon storage was positively correlated with vegetation cover proportion, land cover diversity and negatively correlated with the aggregation degree of green space patches, which corroborates the previous findings (Godwin et al., 2015; Zhang et al., 2017). The reason why aggregated green space patches showed high carbon storage capacity might be related to the less edge effects on vegetation structure, which has been found in natural forest ecosystems (Harper et al., 2005). However, those previous studies failed to detect the threshold value of urbanization intensity with high variation in carbon density. Figure 8d shows that when the urbanization intensity (impervious surface proportion) increases to 60%, there was much less difference of carbon density among green space patches, and thus we suggest that the potential of carbon storage increase could be very limited when the urban development reaches certain intensity threshold. While Zhang et al. (2017) highlighted the important role of landscape planning in urban forest management especially in heavy urbanization areas, our results emphasized the marginal effects of those landscape planning in increasing carbon storage services.
Nevertheless, these relationships were much weaker in areas with relatively lower UDI (Figure 10). None of the selected landscape metrics unveiled a consistent significant correlation with carbon density when UDI was less than 30%, but an increase number of landscape metrics were related with carbon density when UDI increased. Most of those low UDI areas are rural parts of Haidian, Fengtai, and Chaoyang districts where rapid urban expansion happened in the recent decade (Figure 1c). Since relative large extent of those areas were dominated by forests, other local biotic factors (e.g., vegetation age species and vertical structure), and environmental factors (e.g., soil moisture) might also have important impacts on aboveground carbon storage (Mitchell et al., 2018). Rapid urban expansion has brought about profound modification of land cover types to the suburban of the central region of Beijing and has shaped dispersed vegetation landscape of those areas (Qian et al., 2015). Therefore, in order to increase aboveground carbon storage, landscape design measures in the future should be paid much attention, such as improving the proportion of green spaces at landscape level and the aggregation degree of green spaces. It should be noted that we used the range of carbon storage variability along the UDI gradient as an indicator for carbon sequestration potential, which should be valid if young and old forests/trees are well mixed together along the UDI gradient as the range represents possible carbon storage differences resulted from forest age, tree density, among other factors. Of course, this concept might not work if there are few old forests/trees in the city, a situation not likely in Beijing, the ancient capital of China.
4.3 Implications for urban design and planning to mitigate future climate change
Urban green spaces in cities provide a variety of ecosystem services to city-dwellers and the carbon storage estimation results in this study have addressed the role that urban green spaces can play in the mitigating climate change. Efforts of conscious planning and design of urban green spaces might significantly foster the urban resilience to climate change (Leichenko, 2011). Previous tree planting strategy in cities always emphasize on preserving the existing tree covers and planting where possible, while we suggest that much priority could be given to areas exclusive of rapid urban expansion and practicable for landscape configuration optimization in order to maintain and maximize carbon storage.
Rapid urban expansion, on one hand brought about profound modification of land cover types, shaping a relative young urban tree structure of Beijing (Figure 3), but on the other hand, many afforestation movements such as the “National Forest City” award (designated by the Forestry Administration of China) stimulated the demand for distinct design of landscape such as parks, gardens or street greenbelt, which could greatly increase the carbon storage of urban ecosystems. The landscape structure of those newly built urban green spaces, however, might vary with its urban development background, especially in Beijing and other densely established cities of China (Qian et al., 2015). Tree planting policies (e.g., “Planting Where Possible” policy and “Country Parks Circle Projects”) might bring increase of new urban green spaces in highly urbanized areas in the forms of residential yards, community gardens or street trees and large green spaces such as country parks in suburban and exurban (Gong, Mao, Qi, & Xu, 2015). Consequently, the local landscape structure would be significantly changed. Therefore, urbanization effect should be taken into account when making urban greening policy to enhance the ecosystem service of carbon storage provided by urban green spaces. In addition, many studies showed that cluster or less fragmented landscape configuration of urban vegetation could lower land surface temperature (Fan, Myint, & Zheng, 2015; Peng et al., 2016). Therefore, changes in landscape structure are likely to affect the urban heat island mitigation and aboveground carbon storage by urban vegetation simultaneously, and other potential co-benefits between various services provided by urban green spaces (Demuzere et al., 2014). Spatially explicit landscape assessment maps could combine physical and social features of urban ecosystems to facilitate multifunctional evaluation of where and what ecosystem services are provided by urban green spaces (Mitchell et al., 2018). The combination of these ecosystem services might make the use of urban green spaces a preferential climate mitigation strategy (Demuzere et al., 2014; Gill, Handley, Ennos, & Pauleit, 2007). According to the study (Zhao et al., 2015) from 32 major cities of China, the compactness index of Hangzhou, Jinan, Shanghai, Shenzhen, and Tianjin increased significantly during the past several decades, which suggest an increasingly compact urban expansion pattern. Given that many cities of China have implement tree planting programs to increase ecosystem services provided by urban green spaces, the results from this study might not only be potentially important to Beijing, but also other heavily urbanized cities in China. Rapid urban land growth directly leads to the diminishing of ecosystem services provision, and the high proportion of construction exerts significantly negative impact on ecosystem services (Peng et al., 2017). We thus emphasized the urgent need for these cities to identify the thresholds coupled in human-natural systems and target specific sites that may enhance the provision of urban green spaces services (Demuzere et al., 2014).
4.4 Limitations and suggested future research
This study has several limitations. First, some allometric equations adopted in this study are derived from natural forest ecosystems due to the difficulty of manipulating destructive whole-tree cutting experiment in urban ecosystems, and thus, there might be overestimate of the aboveground biomass in urban green spaces where management activities (e.g., mowing and pruning) are necessary to maintain the landscape esthetic (Muratet, Pellegrini, Dufour, Arrif, & Chiron, 2015). In addition, while this study has explored the relationship between aboveground vegetation carbon storage and landscape structure of urban green spaces, other variables not considered in this study will also influence urban vegetation carbon storages. The variables include soil temperature and texture, vegetation age structure, and microclimate conditions such as air temperature and pollution. Fine-scale three dimensional structure of vegetation provided by Light Detection And Ranging (LiDAR) data in recent years has been proved to be of great importance in high-resolution mapping of the spatial distribution of aboveground carbon stores in urban landscape of extreme high heterogeneity (Godwin et al., 2015; Mitchell et al., 2018; Raciti et al., 2014). A comprehensive analysis of these factors could better quantify the carbon stocks and identify the drivers of vegetation carbon storage variation in urban areas (Hutyra et al., 2011). It is also noteworthy that as an important component of urban ecosystem carbon storage, soil organic carbon is often significantly disturbed by urbanization and should be taken into account in landscape design and planning (Edmondson, Davies, McCormack, Gaston, & Leake, 2014). Only one city in one climatic zone type was studied, and it is of great interest to conduct intercity comparative study for future research to explore the relationship between landscape structure and urban aboveground carbon stocks.
ACKNOWLEDGEMENTS
This study was supported by the National key R&D plan of China Grant (2017YFC0503901), and the National Natural Science Foundation of China Grants 41590843, 41571079 and 41771093.


