Limited potential of harvest index improvement to reduce methane emissions from rice paddies
Abstract
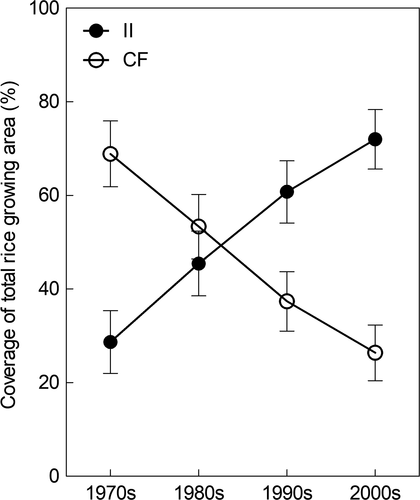
Rice is a staple food for nearly half of the world's population, but rice paddies constitute a major source of anthropogenic CH4 emissions. Root exudates from growing rice plants are an important substrate for methane-producing microorganisms. Therefore, breeding efforts optimizing rice plant photosynthate allocation to grains, i.e., increasing harvest index (HI), are widely expected to reduce CH4 emissions with higher yield. Here we show, by combining a series of experiments, meta-analyses and an expert survey, that the potential of CH4 mitigation from rice paddies through HI improvement is in fact small. Whereas HI improvement reduced CH4 emissions under continuously flooded (CF) irrigation, it did not affect CH4 emissions in systems with intermittent irrigation (II). We estimate that future plant breeding efforts aimed at HI improvement to the theoretical maximum value will reduce CH4 emissions in CF systems by 4.4%. However, CF systems currently make up only a small fraction of the total rice growing area (i.e., 27% of the Chinese rice paddy area). Thus, to achieve substantial CH4 mitigation from rice agriculture, alternative plant breeding strategies may be needed, along with alternative management.
1 INTRODUCTION
Agriculture is responsible for 19%–29% of human-caused greenhouse gases (GHGs; Vermeulen, Campbell, & Ingram, 2012), and concerns about climate change have prompted efforts to reduce GHG emissions from agricultural systems (Carlson et al., 2017; Chen et al., 2014; Smith, 2012; Wollenberg et al., 2016). Rice paddies account for approximately 11% of global anthropogenic methane (CH4) emissions (IPCC, 2013) and cover 11% of the global cropland area (Maclean, Dawe, Hardy, & Hettel, 2002). On a yield-scaled basis, the global warming potential of GHG emissions from rice cultivation is more than three times higher than from either wheat or maize (Carlson et al., 2017; Linquist, Groenigen, Adviento Borbe, Pittelkow, & van Kessel, 2012). At the same time, rice is a staple food in many Asian countries and by 2050 global demand for rice is expected to have increased by 28% (Alexandratos & Bruinsma, 2012). As such, much research over the last two decades has focused on identifying management practices that reduce CH4 emissions from rice cultivation while maintaining high yields (Hussain et al., 2015; Jiang et al., 2017, 2018; Linquist et al., 2012).
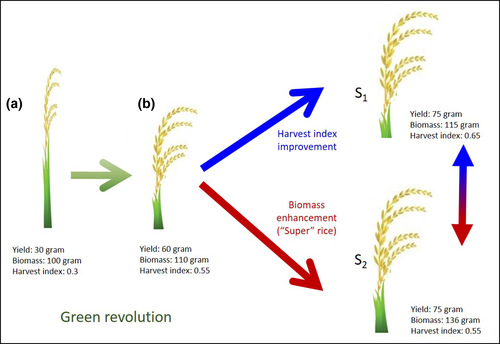
Rice yield potential made a quantum leap during the Green Revolution (Evenson & Gollin, 2003), when plant breeders started to incorporate dwarfing genes that allowed the development of shorter rice cultivars (Figure 1). These new rice cultivars allocated a larger fraction of photosynthates to grain production (Evenson & Gollin, 2003), resulting in higher harvest index values (HI; the mass of grain as a fraction of total aboveground biomass). Since the 1950s, the HI of rice cultivars has increased by about 83% (Cheng et al., 2007; Hay, 1995; Peng, Khush, Virk, Tang, & Zou, 2008; Yuan, 2015). Photosynthate from growing rice plants, in particular root exudates, is an important substrate for CH4-producing microorganisms (Lu & Conrad, 2005; Tokida et al., 2011; Watanabe, Takeda, & Kimura, 1999). By shifting the allocation of photosynthate from root exudates to rice grains, HI improvement likely affects CH4 emissions from rice paddies. For example, increased photosynthate allocation to rice grains by adding a single transcription factor gene can reduce CH4 emissions (Su et al., 2015), whereas reduced allocation by removing spikelets can greatly stimulate CH4 emissions (van Der Gon et al., 2002) under continuously flooded (CF) systems. These results led to the widely-held belief that CH4 emissions from rice agriculture can be reduced substantially by breeding new cultivars with higher HI (Bodelier, 2015; Das & Baruah, 2008a; van Der Gon et al., 2002; Jiang, Tian, et al., 2016; Paustian et al., 2016; Sass & Cicerone, 2002; Su et al., 2015).
Evidence for reduced CH4 emissions from rice paddies with HI improvement comes mostly from CF systems (van Der Gon et al., 2002; Su et al., 2015). However, widespread water shortages have led to a sharp rise in new water-saving practices such as intermittent irrigation (II) being implemented worldwide (Huang, Zhang, Zheng, Li, & Yu, 2004; Yan, Akiyama, Yagi, & Akimoto, 2009). Because irrigation strongly affects CH4 emissions from rice paddies (Feng et al., 2013; Linquist et al., 2015; Yan, Yagi, Akiyama, & Akimoto, 2005), accurate assessments of the effect of HI improvement need to take into account this recent shift in paddy management.
Here, we present a comprehensive study to quantify the effect of HI improvement on CH4 emissions from rice paddies. First, we conducted three complementary experiments to determine the effects of HI improvement on CH4 emissions in CF and II systems. Second, we used a meta-analysis to assess the effect of HI improvement on CH4 emissions, synthesizing 121 observations from 23 rice cultivar experiments. Finally, we conducted an expert survey to estimate the overall contribution of CF and II systems to rice production in China, the world's largest producer of rice.
2 MATERIALS AND METHODS
2.1 Field experiment
We conducted a field experiment at Shibu Farm, Sanya (109.5°E, 18.2°N) in 2018. Soil properties at the experimental site were as follows: soil organic C 9.5 g/kg, total N 1.0 g/kg, total P 0.2 g/kg, total K 17.2 g/kg, alkaline hydrolysis N 104.5 mg/kg, available P 9.8 mg/kg, and available K 69.8 mg/kg. Because there are two major subspecies of rice cultivars (Indica rice and Japonica rice), we used one typical Indica rice cultivar (Yangdao 6) and one typical Japonica rice cultivar (Ningjing 7). Yangdao 6 was commonly grown at the experimental site and its planting area in China is more than 0.4 million ha (http://www.ricedata.cn/variety/). Ningjing 7, a new high-yielding rice cultivar, was released in 2016 and is strongly recommended by seed companies and the Chinese government (http://www.ricedata.cn/variety/). Each cultivar was subjected to two levels of spikelet removal and two levels of water management in a factorial design. The 4 treatment combinations were applied to 16 plots (3 × 6 m), laid out as a complete randomized block design with four replications. Spikelet removal treatments consisted of spikelet removal (+SR) and the non-removal control (−SR). In the +SR treatment, we removed approximately 50% of the spikelets at flowering by clipping, thereby lowering the HI of rice plants (van Der Gon et al., 2002). Water management treatments consisted of conventional flooding (CF) and intermittent irrigation (II). In the CF treatments, a 4–5 cm water layer overlying the soil surface was maintained during the rice growing season. In the II treatments, water management was the same as in CF treatments until spikelet removal. In the II treatments, we started to drain plots 3 days after spikelet removal. When the soil volumetric water content of 0–5 cm depth had decreased to ~25%, we re-flooded the plots until a 4–5 cm water layer had formed on top of the surface. Nitrogen fertilizer as urea, phosphorus fertilizer as calcium superphosphate and potassium fertilizer as potassium chloride were applied as basal dressing at the rate of 113 kg N/ha, 65 kg P2O5/ha, and 65 kg K2O/ha, respectively. Side-dressing N fertilizer as urea was added at 67 kg N/ha and 45 kg N/ha at the tillering stage and panicle initiation stage, respectively. Other agricultural management practices followed local recommendations.
2.2 Pot experiment A
We also conducted a pot experiment at Shibu Farm in 2018, using the same soils and cultivars as in the field experiment. Plastic pots (diameter, 28 cm; height, 20 cm) were filled with 4.5 kg of dry soil. We placed a nylon root bag (diameter, 8 cm; height, 10 cm; mesh size, 40 µm) into the center of each pot. Two rice seedlings were planted in the bag. Forty pots were prepared for each cultivar, and 20 pots with healthy rice plants were selected at flowering. Similar to the field experiment, each cultivar was subjected to two levels of spikelet removal and two levels of water management in a factorial design. In the CF treatments, a 4–5 cm water layer overlying the soil surface was maintained during the rice growing season. In the II treatments, water management was the same as in the CF treatments until spikelet removal. Three days after spikelet removal, we decanted the water from the top of the soil surface and maintained the volumetric water content of 0–5 cm depth soil at 25%–30% for a week. After that, we re-flooded the pots for 5 days, and then drained water again. Each treatment combination was applied to five pots. Nitrogen fertilizer as urea, phosphorus fertilizer and potassium fertilizer were applied as at the rate of 225 kg N/ha, 150 kg P2O5/ha and 150 kg K2O/ha, respectively.
2.3 Pot experiment B
In a second pot experiment, we planted 40 pots with male sterile plants (through pollen abortion) of rice line 9311S. The pot experiment had two levels of water management and two levels of pollen addition. Similar to pot experiment A, the water management treatments consisted of CF and II. The pollen treatments consisted of pollen addition (+P) and a control treatment without pollen addition (−P). At the heading stage, we selected 20 pots of healthy rice plants for the four treatments; each treatment was replicated five times. Water management treatments were applied as before. In the +P treatment, we added the normal pollen from 9311S's rice restorer line (thereby increasing the HI of plants). We added the pollen every day from initial flowering to fully flowering. Other management practices were similar as described in pot experiment A.
2.4 Sampling and measurement methods
In all experiments, we measured CH4 emissions once every 3–5 days using the static closed chamber technique (Jiang et al., 2017; Jiang, Tian, et al., 2016). We used the gas chromatograph equipped with a flame ionization detector (7890A, Agilent Technologies Inc., USA) to measure the CH4 concentrations. Five days after re-flooding, we measured the redox potential (Eh) of soil in the root bags using a platinum ORP electrode (WTW, Germany).
At the rice maturity stage, we harvested the rice plants from the field and pot experiments and collected the soil samples from the root bags. We used 0.5 mol/L K2SO4 to extract the fresh soils and then measured soil dissolved organic carbon (DOC) by a TOC analyzer (multi N/C UV, Analytik Jena AG, Germany). We extracted DNA from 0.25 g of soil, using a Power Soil DNA Isolation Kit (MoBio, USA). The copies of mcrA and pmoA genes, which represent the abundances of methanogens and methanotrophs, respectively, were quantified using the primer pair mcrAf/mcrAr and A189f/A682r, respectively (Holmes, Costello, Lidstrom, & Murrell, 1995; Luton, Wayne, Sharp, & Riley, 2002). Quantitative real-time PCR was performed using the CFX96 (Bio-Rad, America). Rice plants were oven-dried at 70°C to achieve a constant weight.
2.5 Statistical analysis
A two-way ANOVA (water management and spikelets/pollen) and an independent sample t-test within each water management treatment were performed in all experiments. All analyses were performed with the statistical package SPSS 18.0. Differences between treatments were considered significant at p < 0.05.
2.6 Meta-analysis
- rice biomass, rice yield and CH4 emissions were all reported;
- CH4 fluxes had to be measured for an entire rice growth period;
- at least two rice cultivars were compared;
- all rice cultivars were grown under identical conditions.
Nineteen articles including 23 sites met our criteria (Table 1). The geographic distribution of experimental sites is shown in Figure S1. For each experiment in our dataset, we tabulated all the possible combinations of two cultivars for which the difference in yield was at least 5%, but aboveground biomass was within 5% (DataSet S1). For each combination, the rice cultivar with the lowest HI was taken as the control. Our dataset contained 125 comparisons between low and high HI cultivars.
| Reference | Country | Site | Irrigation | Experimental design | Mean effects (%) | |||
|---|---|---|---|---|---|---|---|---|
| CH4 | Biomass | Yield | HI | |||||
| Das and Baruah (2008a) | India | Assam | CF | Field | −30.4 | −0.6 | 7.6 | 8.2 |
| Das and Baruah (2008b) | India | Assam | CF | Field | −23.3 | −0.8 | 22.2 | 23.2 |
| Gutierrez, Kim, and Kim (2013) | Korea | Sacheon | CF | Field | −16.6 | 0.6 | 12.1 | 11.5 |
| Jain et al., (2000) | India | New Delhi | II | Field | −7.1 | 1.7 | 7.1 | 5.4 |
| Jiang et al. (2017) | China | Nanjing | CF | Pot | −10.4 | 0.6 | 19.7 | 19.0 |
| Lou et al. (2008) | Japan | Tsukuba | CF | GC | −11.0 | 5.0 | 24.4 | 18.5 |
| Lu et al. (2000) | China | Hangzhou | II | Field | −8.8 | 3.5 | 7.5 | 3.8 |
| Ma, Tong, and Wang (2013) | China | Fuzhou | II | Field | −16.4 | −0.4 | 6.7 | 7.1 |
| Mitra, Jain, Kumar, Bandyopadhyay, and Kalra (1999) | India | New Delhi | CF | Field | −9.8 | 0.6 | 26.6 | 25.9 |
| Qin et al. (2015) | China | Huizhou | II | Field | −4.6 | 0.2 | 18.3 | 18.1 |
| Setyanto, Makarim, Fagi, Wassmann, and Buendia (2000) | Indonesia | Java | CF | Field | −18.4 | −2.9 | 11.5 | 14.9 |
| Simmonds et al. (2015) | USA | Arkansas | CF | Field | −57.9 | 2.8 | 24.0 | 20.5 |
| Simmonds et al. (2015) | USA | Biggs | CF | Field | 3.4 | 4.8 | 30.1 | 24.2 |
| Simmonds et al. (2015) | USA | Davis | CF | Field | 0.0 | 0.0 | 22.8 | 22.8 |
| Singh, Singh, and Kashyap (1999) | India | Varanasi | CF | Field | 14.9 | 4.9 | 35.4 | 29.0 |
| Tang, Liu, Zhu, and Kobayashi (2015) | China | Jiangdu | II | Field | 20.4 | −4.5 | 12.0 | 18.4 |
| Wang et al. (2000) | China | Beijing | II | Field | 53.1 | 2.2 | 51.1 | 47.9 |
| Wassmann et al. (2000) | Philippines | Los Baños | CF | Field | 33.3 | 0.0 | 106.7 | 106.7 |
| Xu, Wang, Li, and Wang (1999) | China | Beijing | II | Field | −59.5 | −2.7 | 13.2 | 16.3 |
| Zhang et al. (2015) | China | Danyang | II | Field | 1.2 | 0.5 | 23.0 | 22.4 |
| Zhang et al. (2015) | China | Jinxian | II | Field | 0.3 | −2.9 | 25.3 | 37.8 |
| Zhang et al. (2015) | China | Shengyang | II | Field | −1.1 | −0.6 | 24.2 | 24.9 |
| Zhu et al. (2015) | China | Shengyang | II | Field | 8.5 | 2.5 | 7.6 | 4.9 |
Note
- CF: continuously flooding; II: intermittent irrigation; GC: Growth chambers.

where xt and xc are the values of the variables (biomass, yield, HI, or CH4 emissions) for the cultivar with high HI and for the control cultivar, respectively (Hedges, Gurevitch, & Curtis, 1999). We categorized studies based on the post-anthesis irrigation: CF systems or II systems. We also assessed the effects of increasing HI on pre- and post-anthesis CH4 emissions in CF systems (DataSet S1). Four outliers of ln (RCH4) (−1.30, −1.05, −0.90, and 0.62) were identified by the descriptive statistics-explore of the statistical package SPSS 18.0. These four observations (as well as the corresponding observations on biomass, yield and HI) were excluded from further analyses.
We performed a mixed-effects meta-analysis in R, using the rma.mv function in the “metafor” package (Viechtbauer, 2010). We included “site” as a random effect (because several sites contributed more than one effect size), and we weighted lnR by the inverse of its variance. We estimated missing variances using the average coefficient of variation across the dataset (van Groenigen et al., 2017). The mean effect sizes for experimental classes were considered to be significant if the 95% CI did not include zero. To ease interpretation, the results of this meta-analysis on lnR were back-transformed and reported as percentage changes ((R − 1) ×100).
2.7 Literature review
- data collection was restricted to field experiments using transplanted seedlings;
- CH4 fluxes had to be measured for an entire rice growth period using the manual static chamber method;
- CH4 fluxes were measured at least once every 10 days;
- information on irrigation practices was reported.
In total, 138 papers containing 1,076 observations from 150 sites were included in this analysis (DataSet S2). The geographic distribution of experimental sites is shown in Figure S1. According to the data from the International Rice Research Institute, the last 1/4–1/3 rice growth period is the post-anthesis stage (Mosleh, Hassan, & Chowdhury, 2015). Because the exact dates of rice flowering and harvest were not reported in most studies, we assumed the last 1/3 of the rice growth period to be the post-anthesis stage. Studies were categorized as either CF systems or II systems, based on the irrigation during the post-anthesis stage. We estimated the contribution of post-anthesis CH4 emissions to the seasonal total as the mean value of the literature review.
2.8 Expert survey
In 2014, we conducted an expert investigation using a questionnaire to survey the water management practices in China's rice paddies from 1970s to 2000s. The investigation was sponsored by China National Rice Research Institute. This expert investigation covered all major rice growing provinces in China. We used the expert dataset of Ministry of Agriculture of People's Republic China to select local rice cultivation experts. All selected experts have worked in rice cultivation for at least 30 years and were at least 50 years old. These experts were asked to fill out questionnaires on local rice water management practices (Table S1). In total, we received 105 valid questionnaires. Rice water management practices mainly included continuous flooding (CF), early flooding-midseason drainage-flooding (F-D-F), and early flooding-midseason drainage-intermittent irrigation (F-D-II); the experts were asked to estimate the percentage of total rice paddy area under each of these management practices in their county. We estimated the coverage of different water management practices in China as the mean value of the expert investigation. Since HI improvement mainly affects CH4 emissions in the post-anthesis stage, the irrigation practices during this period are most relevant to our analysis. Thus, for the purpose of this analysis, CF and F-D-F water management practices were both considered as continuously flooded systems.
3 RESULTS
3.1 Plant traits and CH4 fluxes
As expected, spikelet removal decreased yield and HI for both rice cultivars in both the field experiment and pot experiment A (Tables 2 and 3). Similarly, pollen addition increased yield and HI in pot experiment B (Table 4). Furthermore, spikelet removal increased root biomass in pot experiment A, whereas pollen addition reduced root biomass in pot experiment B (Tables 3 and 4). The effects of spikelet removal and pollen addition on yield, HI, and root biomass showed no significant interaction with water management.
| Cultivar | Continuously flooded | Intermittent irrigation | ANOVA (p value) | ||||
|---|---|---|---|---|---|---|---|
| −SR | +SR | −SR | +SR | SR | W | SR × W | |
| Yangdao 6 | |||||||
| Aboveground biomass (g/m2) | 1,492 ± 20* | 1,359 ± 28 | 1,440 ± 25* | 1,357 ± 46 | 0.001 | 0.302 | 0.308 |
| Yield (g/m2) | 741 ± 7** | 426 ± 33 | 740 ± 19** | 480 ± 64 | <0.001 | 0.310 | 0.292 |
| HI | 0.50 ± 0.01** | 0.31 ± 0.02 | 0.51 ± 0.01** | 0.35 ± 0.02 | <0.001 | 0.086 | 0.443 |
| Ningjing 7 | |||||||
| Aboveground biomass (g/m2) | 882 ± 23 | 859 ± 20 | 914 ± 30 | 856 ± 18 | 0.143 | 0.596 | 0.500 |
| Yield (g/m2) | 419 ± 16** | 250 ± 14 | 460 ± 12** | 252 ± 10 | <0.001 | 0.168 | 0.220 |
| HI | 0.48 ± 0.02** | 0.29 ± 0.02 | 0.50 ± 0.01** | 0.29 ± 0.01 | <0.001 | 0.348 | 0.476 |
Notes
- Mean ± standard error (n = 4). * and ** indicate differences within irrigation treatment between –SR and +SR at p < 0.05 and 0.01, respectively.
| Cultivar | Continuously flooded | Intermittent irrigation | ANOVA (p value) | ||||
|---|---|---|---|---|---|---|---|
| −SR | +SR | −SR | +SR | SR | W | SR×W | |
| Yangdao 6 | |||||||
| Aboveground biomass (g/plant) | 41.3 ± 1.3 | 39.3 ± 1.3 | 46.0 ± 2.6 | 40.9 ± 2.0 | 0.094 | 0.089 | 0.263 |
| Yield (g/plant) | 20.6 ± 0.6** | 8.7 ± 0.9 | 22.7 ± 1.2** | 8.8 ± 0.4 | <0.001 | 0.133 | 0.195 |
| HI | 0.50 ± 0.01** | 0.22 ± 0.02 | 0.49 ± 0.00** | 0.22 ± 0.01 | <0.001 | 0.827 | 0.883 |
| Root (g/plant) | 5.2 ± 0.1** | 6.1 ± 0.1 | 5.6 ± 0.2 | 6.0 ± 0.2 | 0.001 | 0.292 | 0.167 |
| DOC (mg/kg) | 105.2 ± 2.6** | 118.1 ± 2.4 | 79.4 ± 1.6 | 87.2 ± 3.2 | 0.003 | <0.001 | 0.304 |
| Eh | −224 ± 5 | −221 ± 6 | −73 ± 4 | −80 ± 3 | 0.660 | <0.001 | 0.327 |
| Ningjing 7 | |||||||
| Aboveground biomass (g/plant) | 19.3 ± 0.8 | 18.4 ± 0.8 | 19.6 ± 0.3** | 16.5 ± 0.7 | 0.016 | 0.204 | 0.164 |
| Yield (g/plant) | 11.5 ± 0.5** | 9.0 ± 0.5 | 11.7 ± 0.3** | 7.2 ± 0.3 | <0.001 | 0.066 | 0.093 |
| HI | 0.60 ± 0.01** | 0.49 ± 0.01 | 0.60 ± 0.01** | 0.44 ± 0.01 | <0.001 | 0.014 | 0.076 |
| Root (g/plant) | 2.4 ± 0.2** | 3.0 ± 0.1 | 2.3 ± 0.1* | 2.6 ± 0.1 | 0.004 | 0.044 | 0.136 |
| DOC (mg/kg) | 66.1 ± 5.3 | 86.6 ± 6.4 | 51.8 ± 1.6** | 66.7 ± 1.6 | <0.001 | <0.001 | 0.421 |
| Eh | −269 ± 10 | −288 ± 17 | −29 ± 7 | −43 ± 4 | 0.523 | <0.001 | 0.818 |
Note
- Mean ± standard error (n = 5). * and ** indicate significant differences within irrigation treatment between –SR and +SR at p < 0.05 and 0.01, respectively.
| Continuously flooded | Intermittent irrigation | ANOVA (p value) | |||||
|---|---|---|---|---|---|---|---|
| +P | −P | +P | −P | P | W | P × W | |
| Aboveground biomass (g/plant) | 41.2 ± 2.5 | 38.2 ± 1.2 | 39.7 ± 1.8 | 39.1 ± 1.4 | 0.313 | 0.883 | 0.504 |
| Yield (g/plant) | 6.5 ± 0.6** | 0.0 ± 0.0 | 6.5 ± 0.4** | 0.0 ± 0.0 | <0.001 | 0.991 | 0.991 |
| HI | 0.16 ± 0.01** | 0.00 ± 0.00 | 0.16 ± 0.00** | 0.0 ± 0.0 | <0.001 | 0.561 | 0.561 |
| Root (g/plant) | 5.8 ± 0.2* | 6.7 ± 0.3 | 6.0 ± 0.3 | 6.5 ± 0.3 | 0.013 | 0.949 | 0.522 |
| DOC (mg/kg) | 117.2 ± 15.2* | 162.2 ± 5.6 | 92.9 ± 5.3 | 98.1 ± 5.2 | 0.034 | 0.01 | 0.018 |
| Eh (mv) | −196 ± 7 | −193 ± 16 | −109 ± 8 | −109 ± 8 | 0.881 | <0.001 | 0.900 |
Notes
- Mean ± standard error (n = 5). * and ** indicate significant differences within irrigation treatment between +P and −P at p < 0.05 and 0.01, respectively.
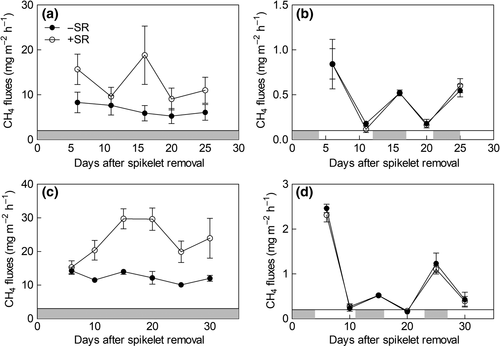
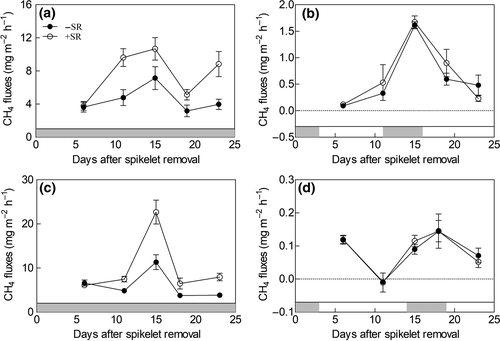
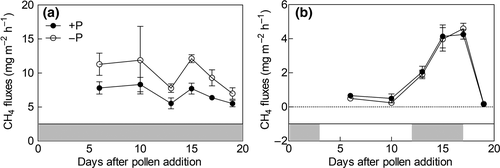
Spikelet removal increased CH4 emissions by 83% from both cultivars under CF, but it did not affect CH4 emissions under II (Figures 2a and 3). Similar results were found in pot experiment A; spikelet removal significantly increased the CH4 emissions from both cultivars under CF, but it did not affect CH4 emissions under II (Figures 2b and 4). In pot experiment B, pollen addition reduced CH4 emissions by 30% under CF, but it did not affect CH4 emissions under II (Figures 2c and 5).

3.2 Soil properties
Spikelet removal increased soil DOC in pot experiment A, whereas pollen addition reduced soil DOC in pot experiment B (Table 3 and 4). Neither spikelet removal nor pollen addition affected soil Eh (Tables 3 and 4). Compared to CF, II reduced soil DOC and increased soil Eh in both pot experiments.
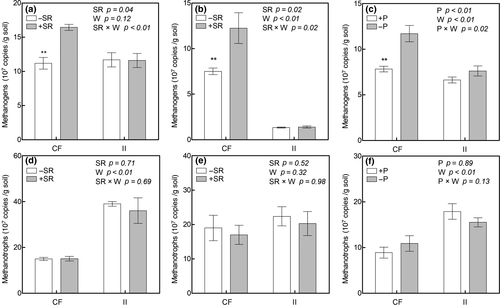
Spikelet removal stimulated the abundance of methanogens by 46% in Yangdao 6 and by 63% in Ningjing 7 under CF, but it did not affect the abundance of methanogens under II (Figure 6a,b). Pollen addition reduced the abundance of methanogens by 49% under CF, but it did not affect the abundance of methanogens under II (Figure 6c). Compared to CF, II stimulated the abundance of methanotrophs in both pot experiments, although the effect was not significant for Ninjing 7 (Figure 6d–f). Spikelet removal or pollen addition did not significantly affect the abundance of methanotrophs.
3.3 Meta-analysis
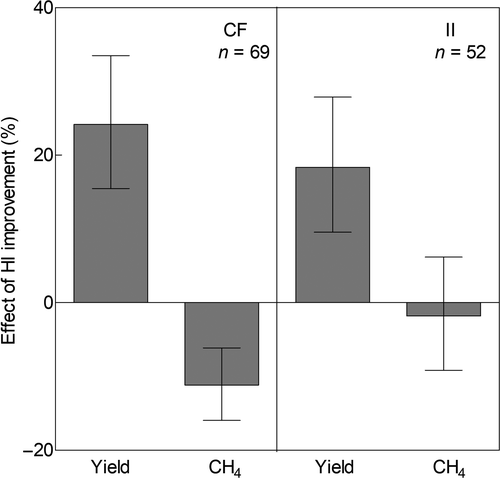
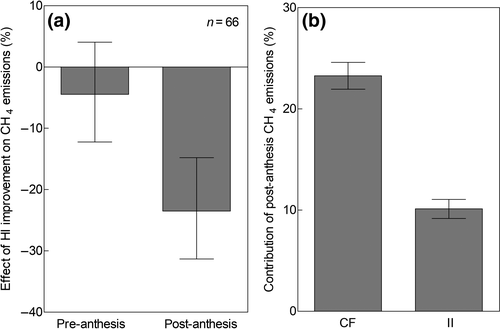
Our meta-analysis showed that high HI cultivars on average had higher yields (Figure 7) and lower root biomass (Table S2). HI improvement only reduced CH4 emissions in CF systems, with no effect in II systems (Figure 7, Table S2). In CF systems, HI improvement only reduced CH4 emissions during the post-anthesis period, with no effect in the pre-anthesis period (Figure 8a, Table S2). In the II systems, HI improvement did not affect the CH4 emissions during the pre-anthesis period and the post-anthesis period (Table S2). Across the studies of CF systems in our dataset, HI increases correlated with treatment effects on post-anthesis emissions but not with treatment effects on seasonal emissions (Figure S2). The effect of HI improvement on CH4 emissions did not differ between single- and multi-season experiments (p = 0.96; Figure S3).
3.4 Extrapolation

where ECH4 is the mean percentage change in post-anthesis CH4 emissions per % increase in HI. C is the mean contribution of post-anthesis CH4 emission to total seasonal CH4 emission, expressed as a fraction. HIf is the future value of HI, and HIc is the HI value of current high yield rice cultivars.
The HI value of current high-yielding rice cultivars is ~0.55, whereas the theoretical upper limit of HI is 0.65 (Cheng et al., 2007; Hay, 1995; Peng et al., 2008; Yuan, 2015). Thus, enhancing the HI of current high-yielding rice cultivars to the theoretical upper limit would constitute an 18.2% increase. In our meta-analysis, a 22.9% increase in HI reduces post-anthesis CH4 emissions in CF systems by 23.5% (Table S2). Assuming linearity, raising HI by 18.2% would therefore reduce post-anthesis emissions by 18.6%. To estimate the effect of HI improvement to total seasonal CH4 emissions, we quantified the contribution of post-anthesis emissions to the seasonal total, synthesizing data from 603 studies. On average, post-anthesis CH4 emissions contributed 23.3% to the seasonal total in CF systems, and 10.1% in II systems (Figure 8b). Thus, accounting for its contribution to total emissions, a potential 18.6% reduction in post-anthesis emissions for CF systems amounts to a reduction in total seasonal CH4 emissions of 4.4% (95% CI: 2.2%–8.8%) (Figure S4).
3.5 Expert survey
The expert survey suggests that the water management of Chinese rice field has changed substantially over time (Figure 9). In the 1970s, CF was the dominant irrigation practice. However, in the 2000s, CF systems made up only a small fraction of the total rice growing area. Based on the expert response, we estimate that II was applied in at least 73% of the Chinese rice paddy area in the 2000s.
4 DISCUSSION
Both our experiments and our meta-analysis show that HI improvement decreases root biomass. Because root exudates are an important substrate for CH4-producing microorganisms (Tokida et al., 2011; Watanabe et al., 1999), the finding of our meta-analysis that HI improvement reduces CH4 emissions from CF systems was to be expected. Our meta-analysis also shows that HI improvement in CF systems only reduces CH4 during the post-anthesis period. These results provide further support for the assumption that HI improvement can reduce CH4 emissions by decreasing soil C input. This is because carbohydrates in rice grains largely originate from photosynthates produced after flowering (Fageria, 2007). Thus, an increase in allocation to grains reduces C substrate availability to methanogens through root exudates mainly after rice plants have flowered.
In contrast, both our experiments and our meta-analysis show that HI improvement does not reduce CH4 emissions in II systems, even though root biomass was decreased. Why do CF and II systems respond differently to HI improvement? Water drainage in II systems inhibits methanogenesis and promotes CH4 oxidation by stimulating O2 diffusion into soil (Ma & Lu, 2010; Yuan, Conrad, & Lu, 2009), as indicated by the lower abundances of methanogens and higher abundances of methanotrophs. Under these conditions, CH4 production may no longer be limited by substrate availability, and reducing soil C input by switching to high HI cultivars has no effect on CH4 production (Yuan et al., 2009). Furthermore, higher soil O2 concentrations during the drying stage of II can affect the redox status of the soil (Conrad, 2007; Ratering & Conrad, 1998). In particular, iron and sulfate are oxidized during the drying stage (Conrad, 2007; Ratering & Conrad, 1998). This process can suppress CH4 production in the subsequent wetting stage, because CH4 production usually does not take place until these potential electron acceptors (that is, Fe3+ and SO42−) have been reduced (Cai, Tsuruta, Gao, Xu, & Wei, 2003; Conrad, 2007; Ratering & Conrad, 1998). Indeed, significant CH4 production in paddies often occurs at Eh <−150 mv (Le Mer & Roger, 2001; Wang, Delaune, Patrick, & Masscheleyn, 1993), far lower than what was found during the re-flooded stage under II in our experiments.
Spikelet removal is a simple and cheap technique to regulate photosynthesis allocation in rice plants (Jiang, Huang, et al., 2016; Nakano, Makino, & Mae, 1995). The spikelet removal approach has been widely used to assess the impacts of photosynthate allocation on crop yield, biomass accumulation, leaf photosynthesis, and N uptake (Dordas, 2009; Jiang, Huang, et al., 2016; Kato, 2004). Our study and van Der Gon et al. (2002) showed that spikelet removal reduced the HI and increased root exudation. Spikelet removal may increase root exudation not only because of altered photosynthate allocation, but also because of physical damage altering plant physiology (Paterson, Thornton, Sim, & Pratt, 2003). As such, it could be argued that effects of spikelet removal aren't fully indicative of HI improvement through breeding efforts. However, regardless of the underlying mechanisms, spikelet removal met our goal of decreasing HI and increasing root exudation. Moreover, our meta-analysis and the pollen addition experiment without physical damage yielded results that are consistent with the spikelet removal experiment, indicating that our results are robust.
Our estimate of a potential 4.4% decrease in CH4 emissions from CF systems through HI improvement represents an upper limit, as it does not take into account future shifts in irrigation practices. Indeed, our expert investigation found that CF systems make up only a fraction of the total rice growing area and II was the dominant irrigation practice in the 2000s in the China. Similar results were also found in other rice production countries such as Indian, Indonesia, Japan, Korea, and Bangladesh (Yan et al., 2009). Since II has been demonstrated to support high rice yields and to reduce water use (Feng et al., 2013; Linquist et al., 2015), II practices will likely become even more popular in the future. HI improvement does not affect CH4 emissions from II systems, suggesting that its impact on CH4 emissions from rice agriculture will decrease over time.
Some limitations of our extrapolation need to be noted. First, our experiments and most experiments in our dataset focused on the effects of HI improvement on CH4 emission during the current growing season. However, HI improvement may affect soil organic C input in following seasons if HI improvement causes a reduction in rice straw production. Since crop straw incorporation often stimulates paddy CH4 emissions (Feng et al., 2013; Jiang et al., 2018; Liu, Lu, Cui, Li, & Fang, 2014), lower root biomass and straw biomass production due to HI improvement might reduce paddy CH4 emission in succeeding seasons. In our meta-analysis, multi-season experiments show similar results as single season experiments, suggesting that HI effects on CH4 emissions do not change over time. Nonetheless, multi-year measurements in long-term studies are needed to confirm these results.
Second, whereas the baseline HI value of 0.55 in our extrapolation is based on current leading cultivars, lower yielding rice cultivars are still applied in some small regions in Asia. For these cultivars, the potential of CH4 mitigation from CF systems through HI improvement may be slightly higher than our estimates. However, as early as the 1990s, modern rice cultivars were grown on about 70% of the rice planting area in Asia (Evenson & Gollin, 2003), further suggesting that the potential for CH4 mitigation through HI improvement is small. Finally, factors such as weather condition and agronomic practice largely affect CH4 emissions from rice paddies (Conrad, 2007; Feng et al., 2013; Linquist et al., 2012). Whether and how HI improvement interacts with these factors is still unknown and requires further study.
Our meta-analysis indicates that previous HI improvement has increased rice yields without stimulating CH4 emissions in II systems (Figure 7). This is an important result, given that global rice demand is expected to increase by 28% between 2007 and 2050 (Alexandratos & Bruinsma, 2012). If this extra rice were to be produced using today's practices and cultivars, total CH4 emissions would keep pace with rice production and increase to a similar extent, i.e., by 28%. Thus, our results suggest that new cultivars with higher HI could meet some of this increased rice demand without further stimulating CH4 emissions. However, because the HI of current rice cultivars is already high, the potential for further increases will likely be modest. For comparison, the average HI value for the “low HI” and “high HI” cultivars in our meta-analysis was 0.41 and 0.49, respectively (DataSet S1); the HI of current high-yielding rice cultivars has already reached 0.55 (Cheng et al., 2007; Peng et al., 2008; Yuan, 2015). Further enhancement of the HI will become increasingly difficult as HI approaches its theoretical maximum value of 0.65 (Cheng et al., 2007; Hay, 1995; Peng et al., 2008; Yuan, 2015).
In conclusion, our experiments, meta-analysis and expert survey indicate that the potential of HI improvement to further reduce area-scaled CH4 emissions from rice agriculture is limited. However, other plant breeding strategies might be more successful in meeting these goals. Importantly, higher yield potential through breeding can be achieved by increasing HI or by increasing total biomass without a change in the HI (Figure 1). At the beginning of the 21st century, plant breeders started to consider the latter approach as a key strategy to increase rice yield (Cheng et al., 2007; Richards, 2000; Yuan, 2015). From 2000 to 2015, plant breeding efforts have increased the biomass of super rice cultivars in China by about 25%; another 25% increase in biomass is expected over the next decades (Yuan, 2015). Compared to rice cultivars with low biomass, cultivars with high biomass and equal HI can reduce CH4 emissions substantially due to active O2 transport in both CF systems and II systems (Jiang et al., 2017). The full potential of this breeding strategy is still unclear, both due to a lack of long-term field studies (Jiang et al., 2017) and to the uncertainty about the potential for further increasing biomass without decreasing HI (Yuan, 2015). To maximize contributions of plant breeding programs towards food security while minimizing environmental impacts of rice agriculture, we suggest that future research should focus on both these issues.
ACKNOWLEDGEMENTS
This work was supported by the National Key Research and Development Program China (2016YFD0300903, 2016YFD0300501, 2017YFD0300104, and 2015BAC02B02), Special Fund for Agro-scientific Research in the Public Interest (201503122), the China Agriculture Research System - Green Manure (CARS-22-G-16), Central Public-interest Scientific Institution Basal Research Fund of Institute of Crop Science, the Innovation Program of CAAS (Y2016PT12, Y2016XT01), the GEF Project of Climate Smart Staple Crop Production in China (P144531) and the China Scholarship Council.


