Assessing climate change associated sea-level rise impacts on sea turtle nesting beaches using drones, photogrammetry and a novel GPS system
Abstract
Climate change associated sea-level rise (SLR) is expected to have profound impacts on coastal areas, affecting many species, including sea turtles which depend on these habitats for egg incubation. Being able to accurately model beach topography using digital terrain models (DTMs) is therefore crucial to project SLR impacts and develop effective conservation strategies. Traditional survey methods are typically low-cost with low accuracy or high-cost with high accuracy. We present a novel combination of drone-based photogrammetry and a low-cost and portable real-time kinematic (RTK) GPS to create DTMs which are highly accurate (<10 cm error) and visually realistic. This methodology is ideal for surveying coastal sites, can be broadly applied to other species and habitats, and is a relevant tool in supporting the development of Specially Protected Areas. Here, we applied this method as a case-study to project three SLR scenarios (0.48, 0.63 and 1.20 m) and assess the future vulnerability and viability of a key nesting habitat for sympatric loggerhead (Caretta caretta) and green turtle (Chelonia mydas) at a key rookery in the Mediterranean. We combined the DTM with 5 years of nest survey data describing location and clutch depth, to identify (a) regions with highest nest densities, (b) nest elevation by species and beach, and (c) estimated proportion of nests inundated under each SLR scenario. On average, green turtles nested at higher elevations than loggerheads (1.8 m vs. 1.32 m, respectively). However, because green turtles dig deeper nests than loggerheads (0.76 m vs. 0.50 m, respectively), these were at similar risk of inundation. For a SLR of 1.2 m, we estimated a loss of 67.3% for loggerhead turtle nests and 59.1% for green turtle nests. Existing natural and artificial barriers may affect the ability of these nesting habitats to remain suitable for nesting through beach migration.
1 INTRODUCTION
Climate change is recognized as a major driver of ecosystem transformation worldwide (Hoegh-Guldberg & Bruno, 2010), and is likely to cause shifts in species ranges and phenology, and potentially threaten the survival of entire species and habitats (Baker, Littnan, & Johnston, 2006; Bellard, Bertelsmeier, Leadley, Thuiller, & Courchamp, 2012; Hawkes, Broderick, Godfrey, & Godley, 2007; Thomas et al., 2004). Global sea level rise, due to ocean thermal expansion, melting of glaciers and ice caps, aggravated by increased storm activity (Pachauri et al., 2014), is expected to have impacts on coastal tropical areas, and to profoundly affect species which depend on these habitats. The latest Intergovernmental Panel on Climate Change (IPCC) projections on global sea-level rise (SLR) range from 0.47 m (95% CI: 0.26–0.55 m) to 0.63 m (95% CI: 0.45–0.82 m) by 2,100 (Collins et al., 2013), while semi-empirical models, including ice melt, project even more extreme sea-level rise for the same period (>1 m SLR, Grinsted, Moore, & Jevrejeva, 2010, Nicholls & Cazenave 2010; Nicholls et al., 2011; Horton, Rahmstorf, Engelhart, & Kemp, 2014, DeConto & Pollard, 2016, Vousdoukas et al., 2018, Chown & Duffy 2017). Although global sea level has varied a great deal during glacial/interglacial cycles (Fairbanks, 1989), current SLR is happening at an unprecedented rate (Pachauri et al., 2014), some argue, potentially too rapidly for species to adapt to new conditions (Jezkova & Wiens, 2016).
All marine turtle species are thought to be particularly vulnerable to climate change (Hamann, Fuentes, Ban, & Mocellin, 2013; Hawkes, Broderick, Godfrey, & Godley, 2009). They depend on temperate to tropical sandy beaches for reproduction and generally display natal philopatry; returning to the beach where they hatched to lay their eggs (Meylan, Bowen, & Avise, 1990). This also means their nesting grounds are exposed to SLR and enhanced storm activity (Poloczanska, Limpus, & Hays, 2009), as areas of beach can be lost or degraded by coastal erosion or flooding. Several nesting beaches used by sea turtles have already been assessed with regard to potential SLR impacts, with studies predicting significant losses of coastal habitat, under median SLR scenarios, ranging from 45% to 65% (Baker et al., 2006; Fish et al., 2005, 2008; Fuentes, Limpus, Hamann, & Dawson, 2010; Katselidis, Schofield, Stamou, Dimopoulos, & Pantis, 2014).
Concerns regarding the impacts of climate change associated SLR mandates the development of highly accurate modelling techniques that should be cost-effective if they are to be broadly used. To estimate habitat loss due to SLR on marine turtle nesting beaches a range of methods have been employed to create beach DTMs: beach profiles can be measured at transect points across a beach using an Abney Level (e.g. Fish et al., 2005, Fish et al., 2008), which is a low-cost approach requiring only basic equipment. However, the estimates obtained from these types of surveys, are usually limited to discrete beach transects (i.e. are not capable of delivering spatially distributed data without considerable time and effort), and may be subject to systematic errors and low accuracy (Isaak, Hubert, & Krueger, 1999). At the other methodological extreme, terrestrial and airborne LiDAR (Light Detection and Ranging) uses expensive and heavy equipment to pulse lasers across a surface to create highly accurate DTMs (e.g. Long, Angelo, & Weishampel, 2011, Yamamoto, Anderson, & Sutton, 2015), but generally instrumentation and software costs exceed tens of thousands of pounds per survey, and thus can be operationally prohibitive, even more so for repeat surveys. The ability to obtain a robust DTM of the current nesting habitat, where possible impacts can be projected, is an essential baseline for use in combination with SLR predictions to make informed decisions, and prioritize conservation efforts to mitigate the consequences of SLR to sea turtle populations. What is now needed is more cost-effective method than airborne and terrestrial LiDAR for scale-appropriate and spatially distributed estimation of beach terrain.
Structure-from-motion (SfM) photogrammetry using aerial photos from a drone (also referred to as unmanned aerial vehicle, UAV, or unmanned aerial system, UAS, in literature), has now emerged as a cost-effective tool to generate robust surface and terrain models in geoscience applications (Glendell et al., 2017, Westoby et al., 2012, Capolupo, Pindozzi, Okello, Fiorentino, & Boccia, 2015, Cunliffe, Brazier, & Anderson, 2016). It uses multiple overlapping aerial photos and merges them into a 3D model using a computer vision technique known as bundle adjustment (Luhmann, Robson, Kyle, & Boehm, 2013). However, to achieve an accurate bare Earth DTM over a beach-type study system typically requires access to a differential GPS (dGPS), or a'real time kinematic’ (RTK) system, to record the locations of a series of deployed ground control points (GCPs) in the survey area which are used to both georeference the 3D model and improve its quality. The purchase of a high accuracy single RTK surveying unit is often high (e.g. in the UK, such a system would cost £5,000–15,000) which means that the costs are again prohibitive for many users. Here we describe a new workflow that was developed to circumvent the requirement for expensive equipment to produce fine-grained and high accuracy DTMs for coastal monitoring applications and how such a workflow can be achieved by combining the use of drones and SfM photogrammetry with an alternative ground-based RTK surveying solution. We used a key sea turtle rookery at Alagadi, Northern Cyprus (Broderick, Glen, Godley, & Hays, 2002), to demonstrate the application of our method and to estimate the future impacts of SLR on nesting beach habitat of two sympatric sea turtle species.
2 METHODOLOGY
2.1 Study site and nesting data
Alagadi (35.34ºN, 33.49ºE) is a major sea turtle nesting area in Northern Cyprus (Broderick et al., 2002) and is composed of two beaches separated by a rocky point covering a total extension of ca. 1,700 m, with Beach 1 to the west, extending for 1,000 m, and Beach 2 to the east, extending for 700 m (Supporting Information Figure S1). Both beaches are generally made up of fine sand sediment and are micro-tidal, hosting two species of nesting sea turtles (green Chelonia mydas, and loggerhead Caretta caretta; Broderick et al., 2002). During the nesting season, night patrols assure near-perfect attribution of nests to known nesting females (for details in survey methods see Stokes et al., 2014). From 2012 to 2016, we recorded the location of all 767 green and 293 loggerhead clutches laid at both beaches using a handheld GPS Garmin eTrex 10 (horizontal accuracy of ±3 m). Hatched nests were excavated and we measured top clutch depth, i.e. from the surface to the first egg shell found as well as bottom clutch depth, i.e. from the surface to the last egg shell found.
2.2 Photogrammetry workflow
We used a custom-made quadcopter drone equipped with a Canon S100 compact digital camera with 12 megapixel image sensor (Supporting Information Figure S2) to collect aerial photographs of the turtle nesting beaches. The drone was flown in automated survey mode, whereby it followed a GPS waypointed path pre-programmed into the open-source Pixhawk autopilot software, to avoid human piloting error and to achieve a consistent forward and side overlap of ≥80% between the aerial images, which is required for an accurate DTM and orthophoto generation (Haala, Cramer, & Rothermel, 2013). The drone flew at 30 m altitude at a velocity of 4 m/s with the camera triggering a photo every two seconds. The aerial survey resulted in 773 photos for Beach 1 and 436 photos for Beach 2. The camera focus was set to automatic, aperture at f4.5, shutter speed 1/1,200 and ISO 400. To improve the accuracy of the final model, following Tonkin, Midgley, Graham, and Labadz (2014), we distributed 30 GCPs, (Supporting Information Figure S4) evenly along each beach, and selected 10 additional natural features on the ground to serve as control check points to assess the accuracy of the final model. We then proceeded to record their individual centroid coordinates in x, y and z using a novel RTK-GPS system, the Piksi (www.swiftnav.com/piksi-multi).
The Piksi is a low-cost (Table 1), alternative carrier phase RTK GPS with centimetre level relative positioning accuracy consisting of two modules: the rover, which we used to survey the GCPs, and the base station, which we kept stationary in a GCP placed on the high tide mark. Both base and rover were connected to a survey grade Global Navigation Satellite System (GNSS) external antenna to enhance satellite signal. Each GCP was surveyed with the rover in a static position for approximately 1 min in order to assure an accurate measurement. Two field studies have assessed the accuracy of the Piksi, reporting 4.1–8.2 cm of horizontal accuracy, and 1.1–5.2 cm vertically (Fazeli, Samadzadegan, & Dadrasjavan, 2016; Zollo & Gohalwar, 2016).
| Surveying methods | Accuracy in cm | Visual impact | Equipment cost in £ | Portability of equipment in kg |
|---|---|---|---|---|
| Abney Level | ±25a | Low/2D profile | Ca. 25 | 1 |
| Theodolite | <1b | Low/2D profile | >1,000 | 6 |
| LiDAR | 6–22c | High/3D aerial | >30,000 | >1,000 |
| Photogrammetry + dGPS | <5d | Very High/3D aerial + realistic view | >7,000 | 10 |
| Photogrammetry + PIKSI | <10e | Very High/3D aerial + realistic view | Ca. 2,500 | 6 |
After manually removing the photos that were captured during take-off and landing phases, and any that were blurred, the remaining images were imported into Agisoft PhotoScan Professional software v 1.3.1 (© Agisoft). Agisoft performs photogrammetric processing of digital images, which generates three-dimensional spatial data from the images. These data can then be visualized as a sparse point cloud. We then manually identified the survey GCP centroids in the point cloud and georeferenced them using their real-world, RTK-GPS co-ordinates. This also allowed us to refine the camera calibration parameters, and optimize the geometry of the output point cloud. Finally, we used the georeferenced and optimized data to generate a dense point cloud using a multi-view stereo algorithm as detailed in previous studies (e.g. Westoby, Brasington, Glasser, Hambrey, & Reynolds, 2012; Gonçalves & Henriques, 2015; Mancini et al., 2013).
The parameters used for SfM processing are shown in supplemental Table S1. The final result was a georeferenced orthophoto and a DTM. In our case, we had unvegetated sandy beaches, so the digital surface model (DSM) produced by PhotoScan was treated as a DTM (bare Earth model) since there was no overlying vegetation to remove.
2.3 Characterization of nesting preferences
The resulting georeferenced orthophoto and DTM were imported in raster format into ESRI ArcGIS software (v10.4), along with GPS coordinates of all green and loggerhead sea turtle nests recorded between 2012 and 2016. To quantify preferred nest sites by species and by nesting season, we applied a Kernel Density Estimation (KDE) interpolation (as described by Macleod, 2014), with an output cell size of 1 m side length and bandwidth (search radius) set to 30 m.
2.4 Nest elevation
To estimate the elevation of nests (i.e. their height above sea level, from which we could estimate inundation risk from SLR) we overlaid the GPS coordinates of sea turtle nests on the DTM and used the ArcMap 3D Analyst Toolset to extract the beach surface elevation at each nest. We then subtracted from this the depth from the beach surface elevation down to the deepest egg shell found for each nest estimate the nest elevation at the bottom of the clutch (available through a long-term monitoring study established at the site, which excavates and records the fate of all nests). We assume that nests became partly inundated when the bottom nest elevation estimate is below the predicted sea level, and used these data to estimate the proportion of green turtle and loggerhead clutches that would be affected under 0.1 m increments of SLR scenarios, assuming no changes in beach morphology (I.e. passive flooding). We believe this approach is more meaningful than estimating the available nesting area that would be inundated, as it considers the current optimal nest site areas of the two species of turtles.
2.5 Inundation scenarios
To show the visual impact of this method, we used the final SfM-derived orthophoto to simulate habitat loss under the three SLR scenarios (0.48, 0.63 and 1.2 m). The former two were Representative Concentration Pathways (RCPs) in the Intergovernmental Panel for Climate Change (Collins et al.,2013); one intermediate (RCP6) and one high emissions scenario (RCP8.5). The latter, more extreme scenario was based on semi-empirical models (0.7–1.2 m SLR by 2,100; Horton et al., 2014).
3 RESULTS
3.1 DTM and orthophoto accuracy
From the comparison of the checkpoints coordinates measured with the Piksi against the final DTM we found a mean ± SD horizontal error of 6.8 ± 0.8 cm (range: 1.2–7.5 cm, n = 10), and a mean ± SD vertical error of 9.4 ± 1.0 cm (range: 6.9–10.0 cm, n = 10) for Beach 1. The values for Beach 2 were 6.5 ± 1.8 cm (range: 1.8–7.9 cm, n = 10) and 9.3 ± 1.4 cm (range: 5.4–9.9 cm, n = 10), respectively.
3.2 Nesting site preferences
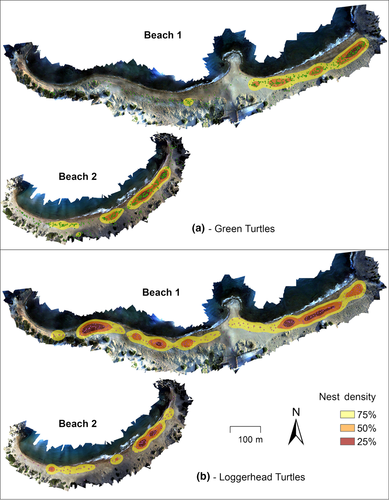
Core areas of green turtle nest distribution were generally centred in the eastern portion of both beaches (Figure 1a), while the loggerhead core areas were more evenly distributed throughout each beach with a lesser preference for eastern areas (Figure 1b).
The mean bottom elevation of green turtle clutches was approximately 0.76 ± 0.12 m below the sand surface (mean ± SD, range: 0.36–1.20 m, n = 720 nests or 94% of all green turtle nests laid), while the mean bottom elevation of loggerhead nests were 0.48 ± 0.07 m below the sand surface (mean ± SD, range 0.27–0.82 m, n = 251% or 86% of all nests laid by loggerhead turtles). For the remaining nests (which were not measured), we used the mean depth for each species calculated here.
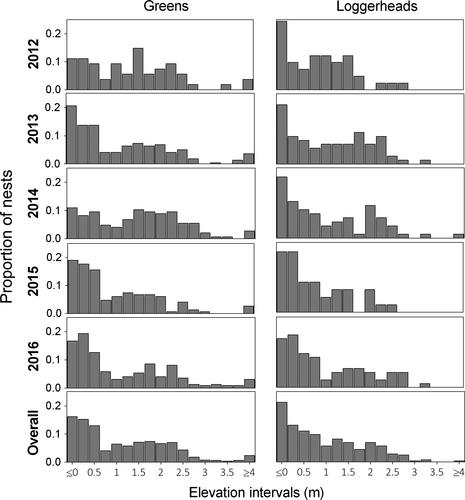
Independent-sample Welch's t tests indicated that there were significant differences in nest surface elevation above the highest tide line (not taking into account the clutch depth) for the 5 year period between species: Beach 1: t428.85 = 7.2, p < 0.0001, Beach 2: t270.62 = 7.2, p < 0.0001), and between beaches within the same species. Nest elevation was significantly lower in Beach 2 for green turtles (Figure 2, Beach 1 = 2.2 ± 0.9 m SD, Beach 2 = 1.4 ± 1.1 m SD; t746.54 = 11.8, p < 0.0001) and loggerheads (Beach 1 = 1.7 ± 0.8 m SD, Beach 2 = 0.5 ± 0.5 m SD; t250.36 = 13.9, p < 0.0001).
3.3 Sea-level rise
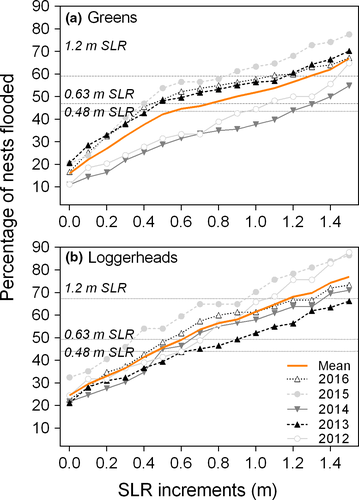
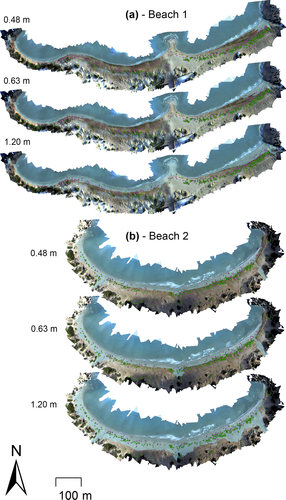
For green turtles we estimated that with a 0.48 m SLR scenario, inundation would affect 33.2%–43.5% of the clutches (sea water reaching top and bottom of clutch, respectively), 42.3%–47.0% with 0.63 m SLR and 57.1%–59.1% with 1.2 m SLR (Figure 3a). For loggerheads we project a loss of 36.5%–44.1%; 43.3%–49.4% and 62.1%–67.4%, for 0.48 m, 0.63 m and 1.2 m SLR scenarios, respectively (Figure 3b). Nesting beach inundation under each of the three SLR scenarios can be seen in Figure 4.
4 DISCUSSION
Recent improvements in the resolution, affordability and ease of acquisition of remotely sensed data, coupled with new tools for geospatial analysis, can assist with mapping putative anthropogenic threats, such as the predicted consequences of SLR (Fish et al., 2008). Existing methods for creating DTMs of sea turtle nesting habitats result in models which are not visually realistic and may also be too expensive to implement or lack the accuracy to make robust inferences. Here, we present a method to create high-resolution and accurate DTMs and orthophoto imagery data of coastal areas, improving on all main aspects of those currently employed—visual impact, accuracy, cost and portability.
4.1 DTM visual impact, accuracy, cost and portability
Our workflow produced a high-resolution DTM and orthophoto mosaic combination and achieved an error under ±10 cm which is a similar to high-end survey methods using LiDAR (Stockdon et al., 2017 ,Yamamoto et al., 2015) or photogrammetric methods incorporating dGPS or total station control (Smith, Carrivick, & Quincey, 2016; Westoby et al., 2012), but with much lower cost and higher portability than either method (Table 1). Although digital photogrammetry is already widely used in other disciplines for creating DTMs, it typically requires a dGPS like a Leica Total Station or similar, weighing over 5 kg and costing £5,000–15,000 rendering it cost-prohibitive for most conservation projects. The total build cost of the Piksi RTK GPS system was £1,500 (prices in April 2018).
The total cost of our drone survey system (drone, camera) was £850, excluding the licence for Agisoft PhotoScan (£385; educational licence, price April 2018), but there are free software alternatives available that perform the same task (e.g. http://opendronemap.org). Each Piksi module fits the palm of the hand and weighs 26 g, making it also extremely portable and therefore ideal for deployment in remote locations.
Our final orthophotos (Figure 5) are photo-realistic and are easier to visually interpret than outputs obtained through traditional survey methods, making it useful not only for scientific analysis but also as an effective visual aid for enabling science communication and knowledge transfer to the general public and decision-makers, including planning professionals addressing other coastal development issues, such as water-front tourism development. Similarly, the SfM-derived DTM can be used for virtual “fly-throughs” to engender a sense of reality (as we show in supplemental video in Rees et al., 2018). The accurate DTM and orthophoto allow the retrieval of valuable information concerning nest elevation and nest site preferences of each sea turtle population. Additionally, the use of DTM differencing methods, where successive DTMs are subtracted from one another to produce spatially distributed maps of topographic change, would enable the quantification of subtle shifts in beach morphology over time, and facilitate analysis of any impacts on sea turtle nesting activities.

Looking to the future, it is clear that this method will likely become cheaper and easier as drones and RTK solutions flood the market at lower prices and with higher capabilities. In addition to the Piksi, there are other available RTK-GPS alternatives (e.g. Emlid Reach, https://emlid.com/reach Accessed: 2018–07–11.) and several others in development that can be used in conjunction with a similar SfM-based methodology and at comparatively low cost. New drone solutions are starting to integrate on-board RTK-GPS positioning, and in time will likely render the requirement for ground-based control obsolete, therefore simplifying the process of acquiring data. However, this is unlikely to be a viable surveying solution for most applications in the short-term.
4.2 Nest site selection and SLR scenarios
Green turtles, on average, utilized the nesting habitat at higher elevations than the loggerheads. However, the risk of inundation under SLR scenarios was comparable for both species, since green turtles dig deeper nest chambers and thus their clutches are at similar elevations to those of loggerheads when compared to mean sea level. This shows the importance of field measurements of clutch depth, particularly in sites where relocation of clutches laid at lower elevations is a common conservation practice.
Both species laid their nests at lower elevations on Beach 2. This might be because this beach is located within a more sheltered cove, so sand at lower altitudes is more stable as it is less influenced by wind and wave action. The nest density shows the successful nesting areas but not necessarily the preferred areas. Both species emerge from the water across the available beach extension, but only manage to nest in different specific areas, showing that the conditions for successful nesting vary between species within the same habitat.
Our results also show that while the two beaches in our study vary in their physical characteristics, they do not vary greatly in their susceptibility to the potential impacts of SLR. Except for the western section of Beach 1, which will most likely be inundated under a medium SLR scenario, the rest of the beach extent is still afforded room to migrate landward into areas which are currently dunes, despite modest development behind Beach 1. However, it is important to make sure that the current area for beach migration is safeguarded from future coastal development and that planning accounts for the most extreme SLR scenario and increased storm activity. This is particularly important for the green turtle as these two beaches are key areas for this population. Priority conservation areas where development should be specifically restricted include the highest nest density areas which are also at a higher risk of inundation.
4.3 Limitations
Our methodology highlights the potential area of beach under threat but it does not, however, offer a complete analysis of the potential shoreline response. The lack of data on long-term beach profile changes and knowledge about precise coastal processes, makes it challenging to forecast the response of each beach to sea-level rise. Beach sediment redistribution is dictated by numerous factors, such as substrata type, topographic relief and shelter from wave energy and wind (Wells, 1995), and accurate models to project coastal adjustments have proven difficult to produce so far. The most commonly used method has been the Bruun rule (Bruun, 1962), which predicts increased erosion and an upward and landward migration of beaches. However, this very simple model has limited application, and its ability to provide reliable predictions has been questioned even under ideal conditions (Cooper & Pilkey, 2004). This field of study is however under significant progress and new, more accurate, models working with fine sediment movement may soon become available. Models such as XBeach have already been successfully tested on several study sites with gravel beaches (Christie et al., 2018; McCall, Masselink, Poate, Roelvink, & Almeida, 2015; Mickey et al., 2017). Accurate DTMs will be needed to test such future models and our method could be useful here.
There are a number of practical considerations that must be borne in mind for mainstreaming this work into other projects. Field-work limitations, such as wind gust conditions or small particles of airborne sand, which could possibly damage the drone engines should also be taken into account (for more details see Duffy et al., 2018). Additionally, restrictions regarding drone transport and local regulations governing the use of drones in specific countries or locales should be considered and require careful pre-survey planning. For sea turtle nesting beaches, however, one of main limitations is the amount of vegetation cover. While small bushes or sparse trees are acceptable, areas with dense vegetation will block the view of the ground from the air, therefore, rendering the photos unsuitable for photogrammetric reconstruction of bare earth topography. To overcome this, the Piksi RTK can be used in rover mode to ground-survey what cannot be seen from an aerial perspective and combine these data with those acquired from aerial SfM.
Future work should include the Piksi (or a similar RTK-GPS based system) as the tool for measuring nest GPS coordinates, thereby reducing the error introduced by handheld GPS.
Here, we used 5 years of nests coordinates acquired using an eTrex 10 GPS with ±3 m horizontal accuracy, but given the large sample size (1,062 nests) our predictions overall should be robust. However, the vertical accuracy of the eTrex (±10 m) is clearly unsuitable for the desired accuracy estimates of elevation and thus for this purpose we used estimates from the DTM (under 10 cm accuracy) instead. This 10 cm error was not considered in our calculations on this manuscript. As the elevation error can be positive or negative, we assumed that the average error should not have a major impact in the overall results.
4.4 Future and wider applications
The potential for our low-cost and accurate workflow to augment and improve understanding of climate change associated impacts for sea turtles is quite profound. With cheap, portable, accurate and visually appealing/easily understood results, we have demonstrated it to be a viable solution for assessing the likely loss of to marine turtle nesting habitat, from which well-informed and effective management responses to coastal squeeze (Fish et al., 2008), can be made. This workflow can be used for other sea turtle species and populations—as we demonstrate in Patrício, Varela, Barbosa, Broderick, Airaud, et al. (2018) and Patrício, Varela, Barbosa, Broderick, & Catry, et al. (2018), but can also be broadly applied to any vulnerable species or coastal habitats, e.g. mangroves (Ellison, 2015; Spencer et al., 2016; Woodroffe, 2018), and shorebirds (Galbraith et al., 2002; Kane, Fletcher, Frazer, & Barbee, 2015; Thorne et al., 2018) or forecasting likely extent of oil spill contamination (Lauritsen et al, 2017), which require a realistic model for SLR projections. Finally, our surveying solution can also be deployed by researchers in other disciplines where SfM is routinely used for topographic characterization as it reduces costs while increasing portability when replacing the dGPS with an alternative RTK solution.
ACKNOWLEDGEMENTS
The authors would like to thank all the volunteers from the Marine Turtle Conservation Project, which is a collaboration between the University of Exeter Marine Turtle Research Group, The North Cyprus Society for Protection of Turtles (SPOT) and the North Cyprus Department of Environmental Protection. We also want to say thank you to the North Cyprus Civil Aviation Department for granting permission to undertake the work. The long-term monitoring data used in this article is supported in part by fundraising support from Karşıyaka Turtle Watch, Kuzey Kıbrıs Turkcell, Erwin Warth Foundation, the MAVA Foundation, Tony and Angela Wadsworth and the English School of Kyrenia.


