A response to ‘Trends in tropical tree growth: reanalysis confirms earlier findings’
Graphical Abstract
We recently demonstrated that growth trends from tree rings from Van Der Sleen et al. (Nature Geoscience, 8, 2015, 24) and Groenendijk et al. (Global Change Biology, 21, 2015, 3762) are affected by demographic biases. In particular, clustered age distributions led to a negative bias in their growth trends. In a response, they challenge our analysis and present an alternative correction approach. We here show that their arguments are incorrect and based on misunderstanding of our analysis and that their alternative approach does not work.
We recently demonstrated that growth trends from tree rings from Van Der Sleen et al. (2015) and Groenendijk et al. (2015) are affected by demographic biases. In particular, clustered age distributions led to a negative bias in their growth trends. In a response, they challenge our analysis and present an alternative correction approach. We here show that their arguments are incorrect and based on misunderstanding of our analysis and that their alternative approach does not work.
Firstly, they argue that our correction methods result in spurious positive growth increases. This is a misinterpretation. Yes, in our test of the correction method, we find positive growth trends (see SI Fig. 3 in Brienen et al., 2012), but they are not spurious as they are expected and of the correct magnitude. Our approach does not correct for all biases and does not remove the effect of slow-grower survivorship bias (Brienen et al., 2012), as explained in Brienen et al. (2016). The authors misinterpreted the trend as a fault in the correction procedure, while in fact, it is confirmation that our methods work perfectly. Another point the authors raise with regard to our shuffling approach is that it would yield often insignificant results. However, we only establish a null model of expected growth trends arising from the irregular age distributions of their species, which is a valid, accepted approach.
Secondly, the authors claim we unnecessarily removed species. There is however clear logic behind this. To identify the effect of the nonuniform age bias on trends, those species affected by other biases had to be removed from the dataset. We thus first removed three species which were identified by the authors themselves to be biased by mortality biases (Groenendijk et al., 2015). We then tested the effect of the nonuniform age bias using two different correction procedures for all remaining nine species, including those with nonuniform age biases. As a final test, we also removed the three species with the most nonuniform age distributions to estimate growth trends over time for the remaining six species using the original method of Van Der Sleen et al. (2015) which does not correct for any biases.
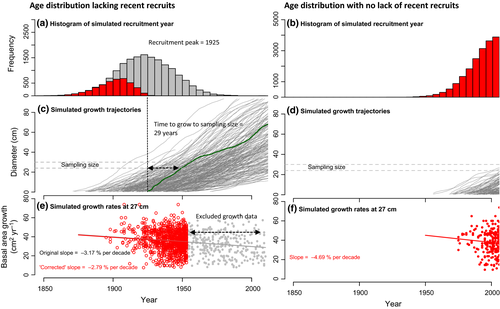
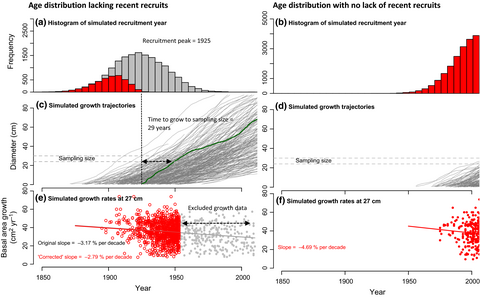
Finally, the authors propose to remove recent growth data from some species as an alternative correction approach. This procedure is flawed. Firstly, by removing recent growth data, one cannot any longer test whether growth increased recently! Secondly, the approach erroneously assumes that the bias only occurs when there is a lack of recent recruits. However, the problem not only arises because of the lack of recent recruits, and any nonuniform age distribution may result in biases, even if there are recent recruits (see Fig. 1). Finally, their subsetting approach does not remove the effect of the nonuniform age bias as shown in Fig. 1 and thus is of no use for this problem.

We conclude that none of the points raised by Van der Sleen et al. (2016) are valid, and their tree data unfortunately still preclude detection of growth changes over the last decades.


