The cold-water climate shield: delineating refugia for preserving salmonid fishes through the 21st century
Abstract
The distribution and future fate of ectothermic organisms in a warming world will be dictated by thermalscapes across landscapes. That is particularly true for stream fishes and cold-water species like trout, salmon, and char that are already constrained to high elevations and latitudes. The extreme climates in those environments also preclude invasions by most non-native species, so identifying especially cold habitats capable of absorbing future climate change while still supporting native populations would highlight important refugia. By coupling crowd-sourced biological datasets with high-resolution stream temperature scenarios, we delineate network refugia across >250 000 stream km in the Northern Rocky Mountains for two native salmonids—bull trout (BT) and cutthroat trout (CT). Under both moderate and extreme climate change scenarios, refugia with high probabilities of trout population occupancy (>0.9) were predicted to exist (33–68 BT refugia; 917–1425 CT refugia). Most refugia are on public lands (>90%) where few currently have protected status in National Parks or Wilderness Areas (<15%). Forecasts of refuge locations could enable protection of key watersheds and provide a foundation for climate smart planning of conservation networks. Using cold water as a ‘climate shield’ is generalizable to other species and geographic areas because it has a strong physiological basis, relies on nationally available geospatial data, and mines existing biological datasets. Importantly, the approach creates a framework to integrate data contributed by many individuals and resource agencies, and a process that strengthens the collaborative and social networks needed to preserve many cold-water fish populations through the 21st century.
Introduction
The thermal environments that organisms experience strongly affect their vital rates, distribution, and abundance (Kingsolver, 2009). That is particularly true among ectotherms (Buckley et al., 2012) and taxa like stream fishes, whose spatial and temporal distributions are in quasiequilibrium with thermal environments (Rieman et al., 2007; Ruff et al., 2011; Grenouillet & Comte, 2014). Because stream fishes are confined to dendritic networks, their ability to track thermal environments is contingent on fluvial connectivity. Climate change is altering that connectivity and the thermalscapes required by these fishes (Isaak et al., 2012; Jurgelenaite et al., 2012; Orr et al., 2014), even as changes associated with a growing human population (Vorosmarty et al., 2010) and non-native species (Rahel & Olden, 2008), compromise the ability of fish to migrate. Collectively, those factors raise concerns that the disproportionate amount of Earth's biodiversity hosted by freshwater environments is at disproportionate risk this century (Strayer & Dudgeon, 2010; Isaak & Rieman, 2013).
From a societal perspective, the marquis freshwater fish in cold waters globally are salmonines—trout, salmon, char, taimen, and lenoks in the subfamily Salmoninae (hereafter, salmonids). Not only do those fish have commercial, recreational, and cultural importance, but they serve ecological roles as predators, prey, hosts of freshwater mussels, and conduits of nutrients from oceans, lakes, and rivers to headwater tributaries and their associated riparian habitats (Quinn, 2005). Salmonids evolved in and colonized cold waters throughout the northern hemisphere, but have also been widely introduced around the world. Nevertheless, within their native ranges, most taxa have undergone declines over the last two centuries, coincident with their exploitation for food, their habitats for water development, and their watersheds for resources (Montgomery, 2003; Williams et al., 2011; Katz et al., 2013). Many taxa or conservation units within them have been designated as in need of conservation action—for example, listing under the US Endangered Species Act, Canada's Species At Risk Act, or state or provincial programs identifying species of concern. For some taxa, declines have been arrested, but restoration to their former habitats has been difficult and costly, in many cases because invasive species now occupy those habitats (Fausch et al., 2009).
As non-native species invasions continue, habitats are degraded, and temperatures increase with climate change, many salmonid populations are shifting their distributions or declining in abundance (Comte & Grenouillet, 2013; Eby et al., 2014). Oftentimes, these changes will constrain populations to smaller and more fragmented headwater habitats, heightening their risk of extirpation (Rieman et al., 2007; Almodóvar et al., 2012). Given limited resources for conservation, not all populations can be saved and strategic assessments are needed for efficient investment planning. To that end, explicitly identifying cold-water habitats (CWHs) that may withstand climate change while supporting viable populations has emerged as a critical task (Jiang et al., 2012). If such climate refugia could be identified, it would allay fears of species extinctions, enable the protection of key watersheds, and provide a foundation for designing climate smart conservation networks (Verboom et al., 2010). Moreover, because the growth and survival of many non-native species are limited in the cold streams where native salmonids often thrive (Fausch, 1989), refugia comprised of especially cold habitats would also be resistant to invasions and require less costly management interventions. Cold water could, in effect, be used as a ‘climate shield’ to preserve many salmonid populations this century.
Although there is extensive work modeling species distributions associated with climate change (Franklin, 2013), only recently have discussions focused on identifying specific refugia (Gavin et al., 2014). Among the biggest challenges to doing so are spatially sparse datasets that cause model imprecision (Potter et al., 2013; Hannah et al., 2014). Yet the management, regulatory, and research communities often possess a wealth of data, when viewed collectively, that could overcome this issue (Hampton et al., 2013). In the aquatic realm, one salient example has been an effort in the northwestern USA to assemble a massive stream temperature database from hundreds of biologists and dozens of resource agencies for the development of high-resolution stream climate scenarios [NorWeST project (www.fs.fed.us/rm/boise/AWAE/projects/NorWeST.html)]. Here, we combine those scenarios with the National Hydrography Dataset (Cooter et al., 2010), high-resolution stream flow scenarios (Wenger et al., 2010), and species occupancy models built from crowd-sourced biological datasets to identify CWH and climate refugia for two salmonids of conservation concern—bull trout (BT; Salvelinus confluentus) and cutthroat trout (CT; Oncorhynchus clarkia)—across >250 000 stream km in the Northern Rocky Mountains of the USA. The locations of refugia are mapped for baseline, moderate, and extreme climate change scenarios and are then cross-referenced with land administrative status to highlight watersheds where native trout populations are likely to persist, and conversely, where declining future habitat suitability suggests difficulties in maintaining populations.
Materials and methods
Study area
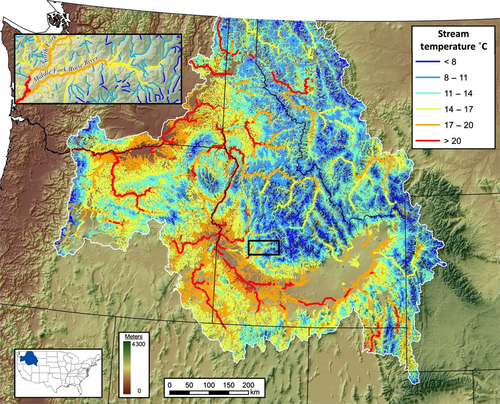
The 506 000 km2 study area is topographically complex and encompasses environments that range from low-elevation deserts to mid-elevation steppe grasslands to high-elevation forests and alpine zones exceeding 4000 m of elevation (Fig. 1). Climate is characterized by cold winters with moderate to heavy snow accumulations at high elevations and hot, dry summers. Stream hydrographs are typical of snowmelt-dominated systems, with high flows during spring and early summer and low flows during late summer, fall, and winter. Although urban areas with dense human populations occur at lower elevations in some river valleys, most of the region is sparsely populated. Cutthroat trout are widely distributed in streams across the study area except for a few river basins in the southwestern portion that were not historically occupied. The species range of CT extends north into Canada, west to the Pacific Ocean, and further east and south through the Rocky Mountains. Bull trout are also widely distributed across the study area except for river basins in the southeastern portion. The study area constitutes the southernmost extent of the BT range, which also extends through much of western Canada.
Stream geospatial and climate data
To delineate the fish-bearing stream network within the study area, geospatial data for the 1 : 100 000-scale National Hydrography Dataset-Plus were downloaded from the Horizons Systems website (http://www.horizon-systems.com/NHDPlus/index.php) and filtered by minimum flow and maximum stream slope criteria. Summer flow values predicted by the variable infiltration capacity hydrologic model (Wenger et al., 2010) were downloaded from the Western US Flow Metrics website (http://www.fs.fed.us/rm/boise/AWAE/projects/modeled_stream_flow_metrics.shtml) and linked to individual stream reaches through the COMID field. Average summer flow values for three 30-year climate periods were available from that website—a baseline period (1970–1999, hereafter 1980s) and two future periods (2030–2059, hereafter 2040s; 2070–2099, hereafter 2080s) associated with the A1B emissions scenario. An ensemble of 10 global climate models that best represented historical trends in air temperatures and precipitation for the northwestern USA during the 20th century was used for future projections (Table S1). Stream reaches with summer flows <0.0057 m3s, which approximates a wetted width ≤1.0 m (based on an empirical relationship developed in Peterson et al., 2013a), were trimmed from the network because trout are rare in such small streams. Reaches with slopes >15% were also trimmed for the same reason (<1% of species occurrences in regional fish database; Appendix S1) and because these reaches occur at the top of drainage networks where slopes become progressively steeper. Application of the slope and flow criteria reduced the original extent of the stream network in the study area from 335 851 km to 259 052 km, and the latter was used to represent baseline fish habitat (Table 1).
| Period | Network | Total lengtha | Cold-water habitats |
|---|---|---|---|
| 1980s | Full | 259 052 | 70 335 |
| CT range | 179 956 | 56 545 | |
| BT range | 191 487 | 52 966 | |
| 2040s | Full | 248 330b | 43 556 |
| CT range | 173 083 | 37 841 | |
| BT range | 183 730 | 31 714 | |
| 2080s | Full | 246 759 | 29 789 |
| CT range | 172 199 | 24 296 | |
| BT range | 182 604 | 20 752 |
- a Stream segments with slope <15% and summer flows >0.0057 m3/s.
- b Reductions in network extent result from projected decreases in summer flows (Table S1). Network extent reductions are small relative to flow decreases, because the 15% slope threshold eliminates many small streams that would otherwise be affected.
Summer stream temperatures, represented by August means, were downloaded for the A1B emissions scenario and climate periods described above from the NorWeST website (www.fs.fed.us/rm/boise/AWAE/projects/NorWeST.html). NorWeST scenarios with 1-km resolution are available for all streams in the northwestern USA. Within the study area, those scenarios were developed using spatial statistical network models (Ver Hoef et al., 2006; Isaak et al., 2010) applied to 29 593 summers of measurement at 10 451 unique stream sites monitored with digital sensors from 1993 to 2011. The density and spatial extent of the temperature dataset, combined with the predictive accuracy (r2 = 0.91; RMSE = 1.0 °C) and resolution of the NorWeST model across those sites, overcame the commonly cited weakness of coarse resolution in climate vulnerability assessments (Potter et al., 2013; Hannah et al., 2014). Because interannual variation from 1993 to 2011 was considerable (mean August air temperatures varied by 5.0 °C; mean August flows varied threefold), the NorWeST model was calibrated to a wide range of climatic conditions. Of note was that the warmest years during the calibration period were similar to the average conditions predicted to occur by the 2040s, so extrapolation beyond the range of observed conditions did not occur until the 2080s scenario was considered. Projections for the study area suggest that mean August stream temperatures would increase 1.3 °C by the 2040s and 2.1 °C by the 2080s, although these averages mask variation within and among river basins that are integrated to the NorWeST scenarios (Table S1).
Three caveats pertaining to the stream temperature and flow scenarios warrant additional discussion. First, our assessment is restricted to patterns observed during summer because most streams in the study area are in remote, mountainous terrain, and temperature and biological data for nonsummer seasons are rare. It is generally recognized, however, that trout growth and survival are strongly affected by thermal and flow conditions during this season (Scarnecchia & Bergersen, 1987; Al-Chokhachy et al., 2013). Second, consistent sets of flow and stream temperature scenarios were available only for the A1B emissions scenarios at the time of this study. Although it is standard practice to assess several emissions scenarios, most climate model projections are similar at mid-century and diverge only in late century due primarily to uncertainties about future greenhouse gas emissions (IPCC, 2013). That range of future possibilities is bracketed by the climatic conditions associated with the historical baseline and A1B scenario used in our assessment (Table S1). Assessing changes larger than those we consider is possible, but perhaps not useful because so little trout habitat would remain and the societal disruptions caused by larger changes make it unlikely that fish conservation would remain a human priority. Third, because of the significant uncertainties about when changes will occur in the future, we de-emphasize the dates associated with scenarios and refer to them instead as baseline (1980s), moderate change (2040s) and extreme change scenarios (2080s). Regardless of the timing and magnitude of predicted changes, the future scenarios show qualitatively similar trends to those that have been occurring in the Northern Rocky Mountains during the last 50 years—summer flow decreases, air temperature increases, and stream temperature increases (Luce & Holden, 2009; Isaak et al., 2010, 2012; Leppi et al., 2012).
Cold-water criterion for native trout
Subadult and adult trout migrate widely, occupy an array of habitats, and occur with many other fish species (Behnke, 2010), but individual populations are often delineated based on the locations of natal habitats and juvenile fish (Rieman & McIntyre, 1995; Dunham et al., 2002b). Those habitats are restricted in ecological scope and geographic distribution, especially with respect to temperature because juvenile fishes have a narrower thermal niche and lower tolerance of temperature fluctuations than do adults (Elliott, 1994). For example, juvenile BT are rarely found where mean summer temperatures exceed 12 °C (Dunham et al., 2003; Isaak et al., 2010), whereas adult BT sometimes occupy habitats as much as 5–10 °C warmer (Howell et al., 2010). Similar patterns are evident with CT (Schrank et al., 2003; Peterson et al., 2013b), so we sought a thermal criterion based on the occurrence of juvenile fish.
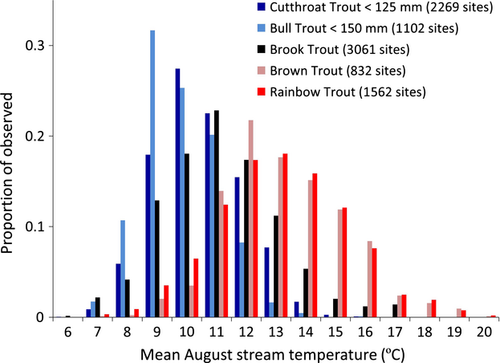
To develop the criterion, thousands of fish locations from a regional database (Appendix S1) were cross-referenced with the NorWeST baseline scenario to develop a set of standardized thermal niches (Fig. 2). Although we focused on juveniles of the two native trout species (CT < 125 mm; BT < 150 mm), all sizes of other trout species were considered because they often displace BT and CT where their distributions overlap. Other trout consisted of brook trout (Salvelinus fontinalis; BKT; introduced from eastern North America >100 years ago), brown trout (Salmo trutta; introduced from Europe >100 years ago), and rainbow trout (Oncorhynchus mykiss; introduced to the eastern third of the study area but native elsewhere). Juvenile BT and CT were most common at the coldest stream sites (90% of BT observations and 75% of CT observations occurred at sites ≤11 °C); whereas brown trout and rainbow trout were rare at those sites. The thermal niche of BKT overlapped that of the native species, but its occurrence peaked at a slightly warmer temperature and declined thereafter. As a compromise between minimizing species overlap and affording BT and CT the largest possible habitats, we chose a mean August temperature of 11 °C to delimit the downstream extent of CWHs. Because temperatures that cold limit incursions by rainbow trout, our criterion also highlights where hybridization with CT begins to rapidly decrease (Gunnell et al., 2008; Rasmussen et al., 2012). Nonsalmonid species were discounted in developing the thermal criterion because their upstream distributions are constrained to much warmer temperatures (Lawrence et al., 2012; Beauchene et al., 2014). In fact, based on our extensive field surveys of streams across the study area, species of sculpin (Cottus spp.) were usually the only other fish in streams ≤11 °C (Isaak & Hubert, 2004; Young et al., 2005, 2013; Isaak et al., 2010).
Cold-water habitat characteristics and occupancy
Spatially contiguous 1-km reaches of stream with temperatures ≤11 °C were aggregated into discrete CWHs using a custom ArcGIS Python script applied to the baseline fish hydrology layer (Fig. S1). The occupancy status (present or absent) of native trout juveniles and BKT within a subset of those CWHs (BT n = 512; CT n = 566) was determined using the fish survey database (Table 2; Appendix S1). The percentage of false absences (incorrectly concluding a species was absent from a CWH) in our status determinations was held below 10% by ensuring that a minimum number of fish site samples occurred within each CWH and by scaling sampling effort with habitat size (Appendix S2). Wherever juvenile fish of a native species were not sampled within a CWH, the status was considered to be unoccupied. We also assigned absences to those habitats with ≥4 sample sites if BKT were present at all sites and native trout occurred at only a single site. In those habitats, the native trout population was regarded to be threatened with replacement and therefore functionally extirpated.
| Species | Variable | Mean | Median | Minimum | Maximum |
|---|---|---|---|---|---|
| BT | Habitat size (km) | 26.2 | 14.1 | 1.50 | 562 |
| Mean temperature (°C) | 9.05 | 9.06 | 6.51 | 11.0 | |
| Minimum temperature (°C) | 7.55 | 7.48 | 4.00 | 11.0 | |
| Slope (%) | 7.96 | 7.89 | 1.62 | 14.7 | |
| Brook trout (%) | 28.3 | 0.00 | 0.00 | 100 | |
| CT | Habitat size (km) | 22.9 | 11.6 | 0.11 | 562 |
| Mean temperature (°C) | 9.25 | 9.29 | 6.35 | 11.0 | |
| Minimum temperature (°C) | 7.99 | 7.95 | 3.26 | 11.0 | |
| Slope (%) | 7.66 | 7.54 | 1.36 | 14.9 | |
| Brook trout (%) | 35.6 | 0.00 | 0.00 | 100 |
Logistic regression (LOGISTIC procedure in sas) was used to model the probability of native trout occupancy within CWHs. Four predictor variables—CWH size, stream slope, BKT prevalence, and stream temperature—were assessed in the models based on their biological relevance and their availability across the study area. Habitat size was represented as the channel length of each CWH. For salmonids, habitat size is positively correlated with species presence, population size, and life history diversity (Rieman & McIntyre, 1995; Young et al., 2005; Peterson et al., 2013c) and buffers populations against stochastic disturbances that are common in mountain environments (Miller et al., 2003). Stream slope was represented as the average value across all the reaches within a CWH. Slope dictates the kinds of physical habitat available to fish and the likelihood that a CWH experiences a catastrophic debris torrent after a wildfire (Miller et al., 2003). Streams with low slopes are more benign environments and are generally preferred by the trout species considered here (Fausch, 1989; Dunham et al., 2002a). Brook trout are often associated with declines in both native species (Fausch et al., 2009; Warnock & Rasmussen, 2013), and their prevalence was represented as the percentage of sample sites within a CWH where they occurred. Temperature was represented in one of two ways: the mean August temperature across all 1-km sections constituting a CWH or the lowest mean temperature of any 1-km section within a CWH. The former may represent the overall climatic suitability of a habitat for a particular species, whereas the latter might reflect the role of exceptionally cold areas for population persistence. The strong correlation between the two thermal metrics (r > 0.86) precluded their inclusion in the same model. Other predictor variables were weakly correlated (r < 0.50) so potential issues with multicollinearity were not a concern (Figs S2 and S3).
Logistic regressions were developed for global models that included all predictor variables and reduced models based on variable subsets (Table S2). Interactions between predictors were considered if both predictors were included in the model and a biological rationale existed for an interaction. Models were ranked based on Akaike's information criterion adjusted for small sample sizes (AICc). Predictive accuracy of the final models was assessed using classification rates at a 0.5 threshold, area under the curve (AUC) metrics, and cross-validation statistics calculated with the DAAG procedure (Maindonald & Braun, 2012).
Climate refugia and land status assessment
Final logistic regression models were applied to the full set of CWHs within the historical range of each native species to predict probabilities of native trout occupancy. Predictions were made for the baseline and future periods. Within each period, those CWH with occurrence probabilities >0.9 were considered to be climate refugia. To account for uncertainties in BKT distributions, probabilities of native trout occurrence were calculated for two levels of BKT invasions during each period: a pristine scenario (0% BKT) and a broad invasion scenario (50% BKT) that assumed BKT would occur at half the sites within each CWH. In the latter case, we did not consider 100% prevalence because BKT rarely exceeded 50% in the larger CWH (i.e., >40 km) that were most likely to serve as refugia (Figs S2 and S3).
Land administrative status associated with CWHs and climate refugia was determined by referencing these areas with geospatial data from the USGS Gap Analysis Program (Gergely & McKerrow, 2013). The total length and percentage of those habitats under public and private jurisdiction were summarized for different climate periods. We also noted the proportion of habitats that were administratively protected within National Parks and Wilderness Areas.
Results
Considerable thermal heterogeneity exists in streams across the Northern Rocky Mountains (3.3–27.0 °C mean August temperatures; Fig. 1). Approximately one-third of stream km in the baseline period were colder than the critical temperature of 11 °C and more than 50 000 km of those CWH occurred within the historical range of each native species (Table 1). Projections suggest CWH length would decrease 33–40% (depending on the species) in the moderate change scenario and 57–61% in the extreme change scenario (Table 1). Large majorities of CWH occurred on public lands during the baseline period, and this pattern was projected to become more pronounced in the future because most private lands are at low elevations where streams are warmest (Table 3; Table S3). Only small percentages of CWH (<15%) are currently within watersheds that have protected status.
| Land status | Cold-water habitat | Climate refugia | ||
|---|---|---|---|---|
| 1980s | 2040s | 1980s | 2040s | |
| Private | 5580 (10.5) | 2037 (6.4) | 304 (3.7) | 39 (2.5) |
| TNC | 157 (0.3) | 79 (0.2) | 0 (0) | 0 (0) |
| Tribal | 1779 (3.4) | 1014 (3.2) | 659 (8.1) | 226 (14.5) |
| State/City | 1621 (3.1) | 734 (2.3) | 130 (1.6) | 67 (4.3) |
| BLM | 1534 (2.9) | 738 (2.3) | 89 (1.1) | 29 (1.9) |
| NPS | 652 (1.2) | 322 (1.0) | 44 (0.5) | 0 (0) |
| FS-wilderness | 6483 (12.2) | 4181 (13.2) | 919 (11.2) | 158 (10.1) |
| FS-nonwilderness | 34 068 (64.3) | 22 000 (69.4) | 5905 (72.3) | 1042 (66.6) |
| Other | 1093 (2.0) | 607 (1.9) | 121 (1.5) | 1.6 (0.1) |
| Totals | 52 966 | 31 714 | 8171 | 1564 |
- TNC, The Nature Conservancy; BLM, Bureau of Land Management; NPS, National Park Service; FS, Forest Service. Other category includes Corp of Engineers, Fish and Wildlife Service, Bureau of Reclamation, and lands with undesignated status.
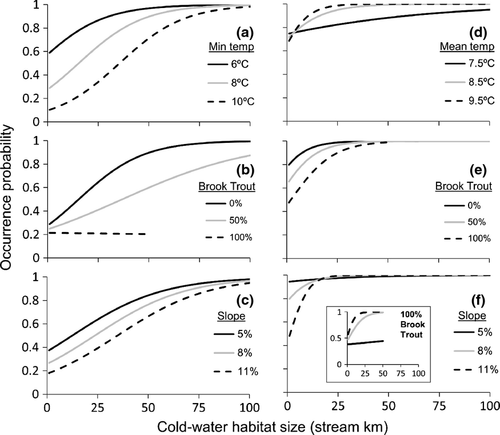
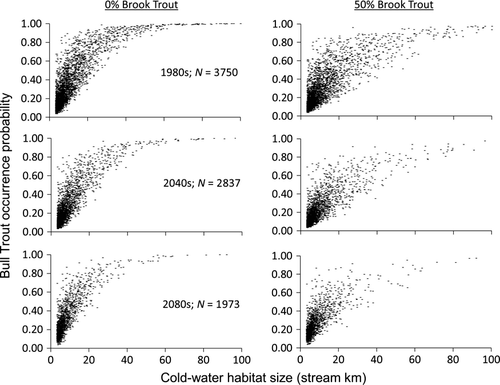
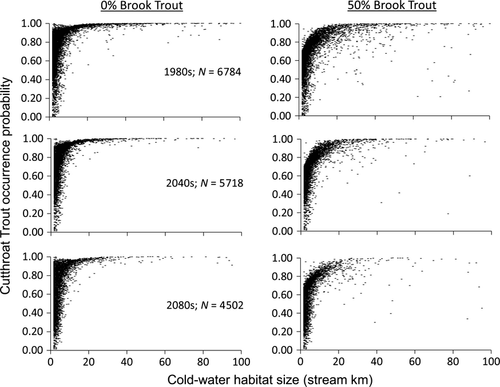
Stream temperature and other CWH attributes were good predictors of native trout occurrence within the CWHs used to develop occupancy models (Table 4; Table S2). Classification accuracy of the models at a 0.5 threshold was 78.1% for the 512 BT CWH and 84.6% for the 566 CT CWH. For both species, models that included the four main predictor variables and some interactions performed best. In the case of BT, models using minimum temperature outperformed those with mean temperature as the thermal descriptor. Three BT models with interactions between habitat size, BKT, and slope were clearly superior to no-interaction models (ΔAICc > 7) but had similar AIC rankings (Table S2). Because the three models made similar predictions (r > 0.99), we chose the simplest one for subsequent use in predicting occupancy probabilities. Models for CT were similar to those for BT except that mean August temperature was the best thermal variable and interactions involving BKT were stronger (Table 4). Species response curves derived from the final models matched expectations based on the ecology of BT and CT, but also revealed important differences between the species (Fig. 3). Habitat occupancy for both native trout was positively related to CWH size, but BT required habitats five times larger than CT to reach a 0.9 occupancy threshold. Bull trout occupancy was negatively related to minimum temperature (i.e., habitats with colder temperatures had higher probabilities of occupancy), whereas CT were positively related to mean temperature. Stream slope negatively affected both species, as did the co-occurrence of non-native BKT—especially in small streams with low slopes. Notably, the interaction with BKT was so strong it negated the normal preference of CT for streams with low slopes (Fig. 3f).
| Model | Predictor | bx (SE) |
|---|---|---|
| BTa | Intercept | 5.43 (1.26) |
| Size | 0.0627 (0.0152) | |
| MinTemp | −0.632 (0.113) | |
| Slope | −0.166 (0.0586) | |
| BKT | −0.00336 (0.00511) | |
| Size × BKT | −0.00064 (0.00022) | |
| CTb | Intercept | 18.8 (5.35) |
| Size | −0.695 (0.129) | |
| MeanTemp | −1.5 (0.558) | |
| Slope | −1.96 (0.603) | |
| BKT | −0.0633 (0.0103) | |
| Size × Slope | 0.0301 (0.00669) | |
| Size × BKT | −0.00031 (0.00018) | |
| Size × MeanTemp | 0.0645 (0.0126) | |
| BKT × Slope | 0.00611 (0.00121) | |
| MeanTemp × Slope | 0.160 (0.0628) |
- BKT, brook trout.
- a Classification accuracy for 512 BT cold-water habitats at a 0.5 threshold was 78.1%; classification accuracy at 0.5 based on fivefold (leave-one-out) cross-validation was 74% (74%); AUC = 0.83.
- b Classification accuracy for 566 CT cold-water habitats at a 0.5 threshold was 84.6%; classification accuracy at 0.5 based on fivefold (leave-one-out) cross-validation was 84% (83%); AUC = 0.88.
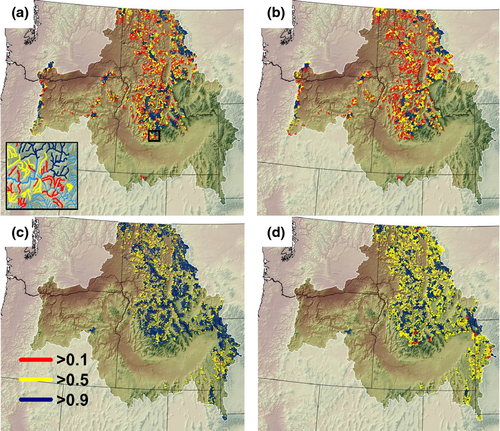
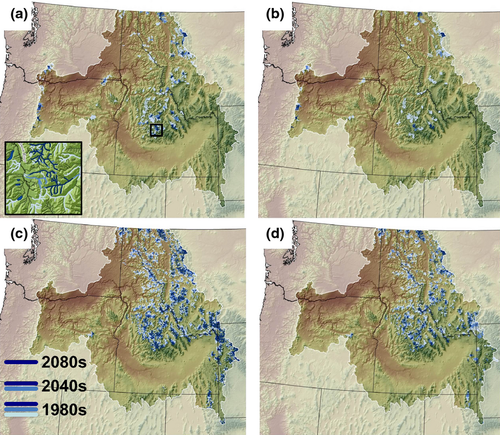
The final occupancy models were particularly good at identifying CWHs within the dataset that met the refuge criterion. Of the 81 BT CWHs predicted to have an occupancy probability >0.9, 96% were actually occupied. For CT, 98% of 260 refugia were occupied. Application of the occupancy models to the historical ranges of native trout during the baseline period indicated that 3750 BT CWH and 6784 CT CWH existed where occupancy probabilities were >0.1 (Figs 4-6; Figs S4 and S5). The subsets of those CWH with occupancy probabilities >0.9 were 225 and 2184 for BT and CT, respectively. Projections for future climate periods show the number of discrete CWHs declining, as do average occupancy probabilities within remaining CWHs (Figs 5 and 6). Nonetheless, some climate refugia were predicted to exist for both species during both climate periods (33–68 BT refugia; 917–1425 CT refugia; Table 5; Fig. 7). Projecting a broad regional BKT invasion further reduced the number of refugia because the median size of a CWH required to constitute a refugium doubled from 10 to 20 km for CT and from 50 to 100 km for BT. Despite the large median size of refugia, however, an individual refugium could be much smaller depending on the local combination of habitat factors (e.g., a BT refugium could be only 16 km if BKT were absent and temperatures and stream slope were low; Table 5). Results from the land administration analysis for refugia were similar to that for CWH but indicated an even greater importance of public lands (Table 3; Table S3).
| Native trout | BKT | Period | Refugia | Size (km) |
|---|---|---|---|---|
| BT | 0% | 1980s | 225 | 51 (16–677)a |
| 2040s | 68 | 54 (22–283) | ||
| 2080s | 33 | 53 (15–242) | ||
| 50%b | 1980s | 69 | 96 (27–677) | |
| 2040s | 14 | 91 (27–283) | ||
| 2080s | 10 | 85 (27–242) | ||
| CT | 0% | 1980s | 2184 | 11 (1.5–677) |
| 2040s | 1425 | 9.5 (1.5–271) | ||
| 2080s | 917 | 8.5 (1.5–242) | ||
| 50% | 1980s | 745 | 21 (2.2–623) | |
| 2040s | 502 | 18 (2.4–271) | ||
| 2080s | 165 | 19 (2.4–242) |
- a Values in parentheses show range in size of refugia.
- b BKT occurred at 50% of the sites within refugia.
Discussion
As observed in other parts of North America, Europe, and Asia (Nakano et al., 1996; Fausch, 2008; Almodóvar et al., 2012), exceptionally cold streams in the Northern Rocky Mountains are sustaining populations of native salmonids upstream from species with warmer thermal niches. That fact can be exploited for conservation planning in thermally diverse environments for which high-resolution climate information exists. The approach we describe here is conservative in assuming that the target cold-water species will be fully restricted by expansion of other species (which is currently not the case in many Rocky Mountain streams), but bounding the invasion-resistant environments is a pragmatic step given the breadth of contemporary species invasions (Rahel, 2002; Baiser et al., 2013). Doing so in the Northern Rocky Mountains revealed that some refugia and many thousands of kilometers of CWH were likely to remain even under extreme climate change scenarios. Those invasion-resistant habitats should require limited conservation investments for population maintenance and could provide a foundation for strategic conservation planning to maintain broader species distributions this century (Williams et al., 2011; Peterson et al., 2013b).
Despite that BT and CT are often sympatric in Northern Rocky Mountain streams, we anticipate somewhat different futures for each species. Chars in the genus Salvelinus are indigenous to the coldest freshwater habitats in the northern hemisphere (Klemetsen et al., 2003). They are also noted for exhibiting extreme plasticity in life histories that often feature migration (Klemetsen, 2010), which probably conveys a fitness advantage in environments with marked spatial and temporal heterogeneity in productivity, thermal conditions, and connectivity. The size of CWHs with the greatest likelihood of occupancy by BT implies that migration may be nearly a default strategy for this species, or that it tends to occur in populations at very low densities relative to other salmonids (Rieman & McIntyre, 1995; High et al., 2008). Regardless, it is unsurprising that a species requiring especially cold, large habitats is at substantial risk of decline at the southern extent of its range where conditions favor species that can endure (or prefer) warmer water temperatures or smaller habitats.
To an extent, CT constitute such a species. In some populations, individuals may migrate tens to hundreds of kilometers between natal sites and adult habitats (Bjornn & Mallet, 1964), yet populations also commonly persist in habitats as small as a few kilometers that have been isolated for decades to centuries (Northcote, 1992; Peterson et al., 2013c). That flexibility is consistent with an evolutionary origin in western North America under climates alternating between periods of abundant precipitation, large pluvial lakes, and high fluvial connectivity, and periods with greater aridity, habitat contraction, and fluvial fragmentation (Minckley et al., 1986). The thermal niche for this species is less restrictive than that of BT (Wenger et al., 2011), and in some locations, stream warming will provide new habitats at higher elevations or permit increased abundance in those already occupied (Young et al., 2005; Coleman & Fausch, 2007). Although those gains will not counterbalance losses at lower elevations, warming in the latter locations often occurs where anthropogenic activities or invasive species have already reduced or eliminated CT populations. For CT, therefore, the greatest risk from climate change appears to be that warmer conditions will continue to enhance the spread of other salmonids such as brown trout and rainbow trout.
Non-native BKT constitute a dilemma for both native species because cold temperatures alone provide little security. Large habitats are resilient to BKT invasions, but the number of large CWH will decline as warming proceeds. Paradoxically, the most secure CWH are those that also have steeper slopes, despite both native species preferring low-slope habitats when in allopatry. Although we modeled all habitats as invadible by BKT, their erratic distribution in Rocky Mountain streams (Dunham et al., 2002a; Rieman et al., 2007; Appendix S1; Figs S2 and S3) suggests a preference for small, low-gradient streams. Moreover, the large rivers that connect these habitats tend to be warm and harbor some of the species (e.g., brown trout and rainbow trout) that are detrimental to native BKT populations in eastern North America (Larson & Moore, 1985; Fausch et al., 2009). Thus, invasions by BKT are unlikely to be as widespread as we project. Regardless, because optimal climate refugia for BT and CT lack BKT, undertaking their removal or preventing their invasions may be essential in some areas. And because both actions are costly and difficult (Peterson et al., 2008), an efficient investment strategy requires that habitats secured from BKT invasions are also suitable as climate refugia.
Conserving native trout in the Rocky Mountains will largely be a public enterprise because the great majority of future habitats likely to be occupied occur on municipal, state, tribal, and federal lands. A small proportion of those habitats are located in National Parks or Wilderness Areas where pristine habitat conditions and protection of native fauna are emphasized, but the majority are on lands open to a wide range of public and commercial uses, especially those within National Forests. In such areas, efficient conservation will require balancing investments between habitats that are most likely to serve as climate refugia, and less suitable areas, some of which may be discounted because they are unlikely to support native trout populations in the future. Remaining habitats may be improved to increase their quality (Roni et al., 2008; Pierce et al., 2013) or may be subject to other forms of direct intervention to facilitate population persistence. Those interventions might consist of assisted migrations or the removal or installation of barriers to fish passage. Although sometimes controversial and posing other risks (Pilliod et al., 2010; Hewitt et al., 2011), direct interventions have constituted a basis of fish management for much of recent human history (Rahel, 2002) and will continue so in the future.
We do not claim that our native trout occupancy forecasts are absolutely accurate, which would require resolution of the deep uncertainties associated with future climate (Hallegatte et al., 2012; IPCC, 2013). Rather, they provide a spatially explicit ranking of habitats critical for population persistence, based on extensive empirically derived characterizations of environmental niches and the most likely changes this century—that temperatures will continue increasing. By providing a strategic view of those habitats, our analyses can help guide where conservation resources are invested most cost-effectively. Our analyses could also be used to conduct efficient biological inventories or develop monitoring programs that further reduce uncertainties about the distributional status and trends of BT and CT (Isaak et al., 2009; Eby et al., 2014). As one intriguing possibility, inexpensive environmental DNA surveys (Wilcox et al., 2013) could be used with our detailed habitat maps to develop complete population censuses and up-to-date status assessments in the near future.
The relative simplicity and accuracy of the BT and CT occupancy models indicate that distributions of native trout in the Northern Rocky Mountains are associated with a basic set of environmental gradients (i.e., temperature, topographic slope, and habitat size), which is not surprising given that these species have had tens to thousands of millennia to explore and colonize suitable habitats in this area (Behnke, 2010). We did not attempt a more detailed analysis involving a larger set of predictor variables, in part, due to the challenges of representing these factors across a large area, but also from a desire to first develop a general framework that could provide a foundation for subsequent refinements. Those refinements might include variables that describe local habitat impairment (Peterson et al., 2013b), connectivity among populations (Erős et al., 2012), additional flow metrics (Wenger et al., 2010), application of spatial statistical network models (Peterson et al., 2013c; Isaak et al., 2014), or descriptions of disturbances related to wildfires, droughts, and heat waves that are becoming more pronounced as climate change progresses (Luce & Holden, 2009; Rieman & Isaak, 2010). In particular, a better understanding of disturbance regimes may be key because historical habitat occupancy relationships are expected to shift toward larger habitats in more variable environments (Verboom et al., 2010).
For aquatic species reliant on the colder end of the thermal spectrum, the ‘climate shield’ approach appears widely applicable. It could be used for other salmonids within their native ranges, such as BKT in eastern North America (Larson & Moore, 1985; DeWeber & Wagner, 2015), brown trout in Europe (Almodóvar et al., 2012; Comte & Grenouillet, 2013), or char and taimen in eastern Asia (Nakano et al., 1996; Matveyev et al., 1998). It might also be used for other aquatic taxa with cold thermal niches such as some species of stream-dwelling amphibians (Williams et al., 1981; Pilliod et al., 2013) or macroinvertebrates (Brown et al., 2009; Durance & Ormerod, 2010). Deriving thermal criteria for other species and delineating refugia, once high-resolution climate scenarios exist, consists simply of cross-referencing biological datasets to temperature maps and developing occupancy models. The foundational elements for that information—digital hydrology layers (Vogt et al., 2007; Cooter et al., 2010), stream geostatistical tools (Peterson & Ver Hoef, 2014; Ver Hoef et al., 2014), geospatial databases of predictor variables (Wang et al., 2011), and large biological and temperature datasets (Wenger et al., 2011; Comte & Grenouillet, 2013)—are widely available across much of North America and Europe. Even where data densities are initially low, inexpensive genetic inventories (Young et al., 2013), continuing aggregation of smaller datasets (Hampton et al., 2013; Isaak et al., 2014), and inexpensive climate sensors (USEPA, 2014) are rapidly expanding the quality and quantity of datasets that will become available in future years. Equally important, a climate shield approach creates a framework capable of integrating data from many individuals and resource organizations that can be regularly updated to refine and improve the quality of information available for decision making. In our experience, the process of developing that information also serves to build and strengthen the social networks and collaborations that are ultimately needed for effective conservation.
Projections of continued warming through at least mid-century mean that extirpations of some populations are inevitable. That is especially true for organisms like salmonid fishes that are dependent on cold habitats undergoing a net global decline. It was previously difficult to discern where, or whether, habitats would remain to support resilient populations later this century. In the Northern Rocky Mountains, and we suspect many other landscapes inhabited by these iconic fish, some habitats appear likely to persist, albeit in lower numbers. Forecasts about the locations of climate refugia can enable their protection, be used to rally support among multiple stakeholders, and improve the odds that many salmonid populations are conserved through the 21st century. By then, human technologies and societal choices may be effective in moderating the climate to more benign conditions. Until then, the collective actions of people committed to protecting and preserving these species could constitute another shield to reinforce that provided by cold water.
Acknowledgements
This research was inspired by the landscapes of the Rocky Mountains and managers everywhere that are working to preserve native trout. Special thanks to the many biologists with the National Forest system for providing fish survey data and Leslie Nyce with Montana Fish, Wildlife and Parks for assistance with the MFISH database. Seth Wenger provided thousands of additional fish species locations that were generously contributed by the Idaho Department of Fish and Game and the Wyoming Game and Fish Department. The US Fish and Wildlife Service's Great Northern and North Pacific Landscape Conservation Cooperatives funded the NorWeST temperature project that was key to this research. D. Isaak, M. Young, D. Nagel, D. Horan, and M. Groce were supported by the Rocky Mountain Research Station, the Northern Rockies Adaptation Partnership, and the Blue Mountains Adaptation Partnership. The Adaptation Partnerships led by David Peterson provided a valuable forum that accelerated this research. Bruce Rieman, Frank McCormick, and three anonymous reviewers commented on previous drafts of this manuscript and helped improve its content.


