
Weeding the Biodiversity Patch—A Mesocosm Study of Predation by Boeckella major (Copepoda: Calanoida) on Billabong Zooplankton
Funding: The authors received no specific funding for this work.
ABSTRACT
- We carried out short-term field experiments (duration 1–3 days) to study the impact of predation by natural densities of Boeckella major on zooplankton in Australian ephemeral billabongs (oxbow lakes). Predation reduced total zooplankton densities by 33.6%–91.9%. Rotifers, Daphnia lumholtzi, Bosmina meridionalis, Ilyocryptus spinifer and copepod nauplii were markedly reduced, but late-stage calanoid copepodites, cyclopoid copepods and D. carinata were little affected.
- Clearance rates on total zooplankton were constant at about 100–110 mL.copepod−1.day−1 above c. 25 zooplankton.L−1 but declined below this. Clearances on rotifers, small cladocerans, D. lumholtzi and nauplii (190–120 mL.copepod−1.day−1) were higher than on cyclopoid copepods and calanoid CI–III (50–60 mL.copepod−1.day−1). Clearance was zero on D. carinata and calanoid CIV–CV. Clearance rates were negatively related to prey length. Functional response curves for most prey were Types I or II, but may have been Type III for D. lumholtzi, small cladocerans and calanoid nauplii.
- Boeckella major showed switching behaviour; rotifers, calanoid nauplii and small cladocerans were positively selected when > 10% of total zooplankton abundance. D. carinata and calanoid CIV–VI were avoided, but all other prey were selected in proportion to abundance. Selectivity was negatively related to prey size. D. lumholtzi was more vulnerable than expected from its size and was attacked mainly on the head and antennae.
- B. major mainly took prey < 2 mm long, resulting in an increase in mean length of the zooplankton community. Zooplankton composition changed in favour of calanoid copepods and D. carinata, and species richness was reduced by up to 50%. The effects of B. major predation are predicted to decline below adult densities of 10.L−1 and to be minimal below 1.L−1.
- The study suggests that B. major predation is a selective force structuring zooplankton communities of ephemeral billabongs. The effects occur only early in billabong development and are short-lived, but a suite of other invertebrate predators may have similar effects at later stages.
1 Introduction
Freshwater calanoid copepods are fundamentally omnivorous, although different species have varying tendencies towards herbivory or carnivory (e.g., Van der Ploeg 1994; Kimmel 2011). While many, particularly smaller species, feed mainly on algae (e.g., Burns and Xu 1990), ciliates (e.g., Burns and Gilbert 1993; Burns and Schallenberg 2001; Dhanker et al. 2013), rotifers (e.g., Brandl 2005) and both cladocerans and other copepods (e.g., Arashkevich 1969; Wong and Chow-Fraser 1985; Green et al. 1999; O'Brien 2001; Reissig et al. 2004) may be included in the diet. In general, the largest calanoids are the most carnivorous, and their mouthparts usually have features, such as solid spines and piercing and cutting edges on mandibles, to enable efficient handling and ingestion of animal prey (e.g., Wong 1984; Green and Shiel 1999). In freshwaters, large predatory calanoids are usually most common in fishless habitats where they may be one of the top predators and have significant impacts on zooplankton community structure. For example, Dodson (1974) found that Diaptomus shoshone predation eliminated small Daphnia minnehaha, but not the large D. middendorffiana. In arctic pools, predation by Heterocope septentrionalis favours D. middendorffiana, Diaptomus pribilofensis and Cyclops scutifer over Daphnia pulex and Bosmina longirostris (Luecke and O'Brien 1983), and reintroduction of Hesperodiaptomus arcticus to Snowflake Lake, following its earlier elimination by trout stocking, suppressed rotifers and nauplii (McNaught et al. 1999).
In Australia, diverse permanent and semi-permanent waterbodies on riverine floodplains, ranging from larger cut-off meanders (oxbows) to small waterholes on the undulating floodplain surface are termed billabongs (Hillman 1986). Small fishless ephemeral billabongs are very numerous on the floodplains of the upper River Murray and its tributaries. Such habitats support complex zooplankton communities, including a considerable diversity of centropagid calanoid copepods (Shiel et al. 1998). Three of the largest of these calanoids (Boeckella major, B. pseudochelae and Hemiboeckella searli) are known to include animals in their diets, and examination of mouthpart morphology and gut contents has shown that B. major is by far the most carnivorous of the three species (Green and Shiel 1999). Green et al. (1999) found that variations in size structure of the zooplankton in these habitats were significantly correlated with the incidence of B. major. They concluded that B. major predation may be an important structuring element in these zooplankton communities by preferentially removing rotifers, resulting in dominance by larger cladocerans and copepods. This conclusion was, however, based only on circumstantial evidence.
Here we describe a series of mesocosm experiments carried out to investigate the impact of predation by adult B. major on zooplankton communities of ephemeral billabongs. Our objectives were to test whether such predation could modify the density, the species composition, and the size structure of such communities and whether it could promote dominance by larger forms. To examine the impact of B. major predation on a wide range of zooplankton species, experiments were carried out in three billabongs on the River Murray, Australia.
2 Methods
2.1 Study Site
Ryan's property, on the River Murray floodplain below the Hume Dam near Bonegila, Vic. (now the Ryan's Lagoon Conservation Reserve) was selected in view of the close proximity of three billabongs—one in which B. major occurs (Ryan's 3 billabong, 36°06′33.04″ S/146°58′36.37″ E) and two closely adjacent billabongs (Ryan's 1 and 2, 36°06′37.77″ S/146°57′58.08″ E and 36°06′45.21″ S/146°58′17.67″ E, respectively) in which B. major is absent. Ryan's 3 (R3) is the smallest, the most ephemeral (it dries in the summer of most years) and is usually fishless, while Ryan's 1 and 2 (R1, R2) are larger oxbow lakes, more permanent (they dry only infrequently) and contain fish. However, all three billabongs, within 1 km2, are confluent when the River Murray floods.
2.2 Experimental Design
Three field experiments were conducted during August and September 1991. Experiment 1 was carried out in R2 and R3 between 24 and 26 August. Experiments 2 and 3 were carried out between 14 and 15 September, and 22 and 25 September, respectively, in R1, R2 and R3. Surface water temperatures during the experiments were: Experiment 1—R2 & R3, 10.5°C; Experiment 2—R1 15.7°C, R2 15.8°C, R3 18.2°C; Experiment 3—R1 15.0°C, R2 17.8°C, R3 22.0°C. In all cases the general experimental design was to use small-scale enclosures (volume 2–5 L) that were 50 × 100 cm bags of heavy clear plastic, with five predation enclosures (with added B. major adults) and five control enclosures (minus B. major). In Experiment 1 2 L of water was used in each enclosure and in Experiments 2 and 3, 5 L. The numbers of B. major added to each of the experimental enclosures were chosen to mimic their natural densities in R3. In Experiment 1, 30 adult B. major (16 females, 14 males) were added to each 2 L enclosure, corresponding to the peak natural densities of c. 15.L−1. In Experiments 2 and 3, 40 adults (20 females, 20 males) were added to each 5 L enclosure, corresponding to mean natural densities of c. 8 adults.L−1. Mean lengths (anterior margin of cephalothorax to ends of caudal setae) of B. major were: Experiment 1, females 3.56 mm, males 2.82 mm; Experiments 2 and 3, females 3.37 mm, males 2.66 mm. Adult B. major used in the experiments were obtained from R3 on the afternoon before the experiment by net tows with a 70 μm mesh net. Depending on the experiment, they were sorted into appropriate groups using a dissecting microscope and acclimated overnight in 1 L beakers containing water and natural densities of prey from the experimental site.
In setting up an experiment, water from the site was placed in a 100 L container and continuously mixed using a Secchi disc. While the water was still being mixed, 2 or 5 L volumes were removed then carefully poured into the plastic bags. R3 water was prefiltered through a 500 μm sieve to remove any adult B. major and this procedure also removed some of the largest Daphnia. The previously sorted and acclimated groups of B. major adults were added to the bags and the tops tied to exclude most air. The enclosures were then suspended in the billabong 2 m from the margin and just below the surface by tying them to a length of rope that was tightly strung just below the surface between two metal stakes driven into the floor of the billabong. Control and predation enclosures were placed randomly along the length of the rope. The enclosures were retrieved after 48 h in Experiment 1, 24 h in Experiment 2 and 72 h in Experiment 3. These durations were chosen to strike a balance between being long enough for the predators to achieve significant reductions in prey densities, yet short enough that prey recruitment and nonpredatory mortality were minimised. In Experiment 1 (using peak natural densities of B. major, 2 L enclosures and a 2-day experimental duration) prey densities were reduced to very low levels in the predation treatments, so it was decided to use a lower density of predators and a shorter duration in Experiment 2. However, the reduction in prey densities achieved in this experiment was considered only just adequate, given the variability of the control counts, and so the duration of the third experiment was lengthened to 3 days, while still maintaining the lower predator density. At the end of each experiment, the contents of each bag were filtered through a 35 μm mesh net, anaesthetised with soda water, and preserved in 4% formalin. No mortality of B. major occurred in any experiment.
Counts were made of the various zooplankton groups in each enclosure, using a gridded perspex tray mounted on a moveable stage of a Zeiss SV8 dissecting microscope. The nauplii and immature copepodite stages of calanoid copepods were separated in the counts. Volvox colonies, which were present in R1 in Experiment 1 and at all sites in Experiment 3, were also counted. Total body lengths of usually at least 10 specimens of each zooplankton taxon from the control enclosures were measured to ±0.035 mm. In the case of Daphnia spp., which exhibited a wide range of body lengths, where possible 20 specimens were measured from each control and experimental enclosure, to give a total of 100 from control and experimental situations. If there were fewer than 20 specimens, the total numbers present were measured. Length distributions of the total zooplankton community were determined by measuring the lengths of, in most cases, 60 randomly selected specimens from each replicate, to give a total of 300 for each treatment in each experiment. In two instances, there were fewer than 300 specimens in all replicates combined (Experiment 1, R2, predation treatment, n = 236; Experiment 3 R1, predation treatment, n = 104). Lengths measured were: Cladocera—anterior margin of the head to the posterior margin of the valve, not including spines; Copepoda—anterior margin of the cephalothorax to the ends of the caudal setae; Rotifera—anterior margin of the lorica to the posterior end, if contracted, or to the tip of the toes, if extended; other groups—greatest axial dimension. In R1 and R2, particularly in Experiment 2, but also in Experiment 3, several partly consumed corpses of Daphnia lumholtzi were found in the samples. These were examined to determine the attack pattern of B. major. Three injury states were recognised (A, minus the tail spine; B, minus the head and antennae; C, minus the tail spine, head and antennae), and the proportions of corpses in these states were determined.
2.3 Data Analysis
| Prey category | Acronym | Taxa included | Overall mean length and range (mm) |
|---|---|---|---|
| Daphnia carinata | D car | Daphnia carinata s.l. (R3 only) | 2.11 (0.87–3.26) |
| Daphnia lumholtzi | D lum | Daphnia lumholtzi (R1 & R2 only) | 1.35 (0.53–2.45) |
| Other cladocera | Clad | Bosmina meridionalis, Ceriodaphnia dubia, Ilyocryptus spinifer (R1 & R2 only) | 0.36 (0.33–0.53) |
| Calanoid nauplii | Cal N | Boeckella symmetrica (R3), B. fluvialis (R1 & R2), B. minuta (R1 & R2) | 0.24 (0.11–0.33) |
| Calanoid copepodites I–III | CI–III | -ditto- | 0.74 (0.50–1.03) |
| Calanoid copepodites IV–VI | CIV–VI | -ditto- | 1.46 (1.01–2.04) |
| Cyclopoid nauplii | Cyc N | Microcyclops sp., Mesocyclops sp. | 0.19 (0.15–0.22) |
| Cyclopoid copepodites | Cyc C | -ditto- | 0.79 (0.55–1.20) |
| Rotifers | Rotifers or Rot | Asplanchna sieboldii (R3), Brachionus quadridentatus (R3), Epiphanes macroura (R3), Euchlanis incisa (R3), Keratella procurva (R1–R3), K. slacki (R2), Lecane bulla (R3), Lecane luna (R1–R3), Lecane quadridentata (R3), Mytilina ventralis (R2, R3), Polyarthra dolichoptera (R1, R3), Synchaeta oblonga (R1–R3), Testudinella elliptica (R3), Trichocerca similis (R1, R3), Trichotria tetractis similis (R3). | 0.23 (0.12–0.54) |
| Other | Other | Chydoridae, Ostracoda, Simocephalus elizabethae, testate Rhizopoda | 0.57 (0.12–2.50) |
- Note: Numerically dominant taxa are underlined. Any site specificity is indicated: R1, Ryan's 1; R2, Ryan's 2; R3, Ryan's 3.
Prey categories for which HL is less than DT are likely to be eliminated by B. major predation.
As we could not find values of rmax for the zooplankton species being studied, we have used average values for similar species or groups summarised by Nero and Sprules (1986).
To measure of the overall effects of predation on the gross community composition a comparison was made of the mean proportions of major dietary groups—Clad (=all Cladocera), Cal (=calanoid nauplii, adults and copepodites), Cyc (=cyclopoid nauplii, adults and copepodites), Rotifers and Other—in control and experimental treatments, and the goodness-of-fit of the predation proportions of these groups to the control proportions was tested by G tests (Sokal and Rohlf 1995).
T-tests were used to compare the mean values of various variables (e.g., prey density, clearance and consumption rate, prey size) between control and predation treatments, ANOVA was used to compare clearance rates (the variable, eight levels) between prey groups (fixed factor), and linear regression for the relationship between mean clearance rates and values of Chesson's α and prey body length. Statistical analyses were carried out using the programs Instat 3 (GraphPad Software 1998) and Systat 7 (SPSS Inc. 1997).
3 Results
3.1 Effects of Predation on Prey Densities
Mean densities of total zooplankton were significantly reduced in the predation treatments, compared to those in the control treatments, at all sites in all experiments (Figure 1). Overall % reductions of density (i.e., difference between control and predation mean densities as a percent of mean control density) during the experiments ranged from 33.6% to 91.9% (mean 60.7% in Experiment 1, 62.8% in Experiment 2 and 79.3% in Experiment 3). Daily % reductions (Table 3) averaged 6.85% copepod−1.L−1, or 54.8%.L−1 at a B. major density of eight adults.L−1 (the mean density found in R3 during August 1991).

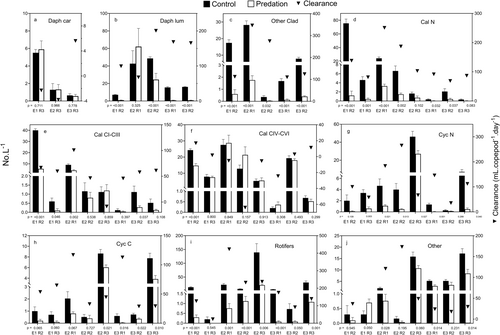
Density reductions of individual animal prey categories were more variable (Figure 2), although there were marked reductions in mean density in many instances. Despite careful mixing of the bulk zooplankton sampling prior to filling the mesocosms, there was still often considerable inter-replicate variability in control treatments. In comparing the control and treatment means with t-tests, this variability almost certainly leads to Type II errors being committed at the conventional 5% significance level. For instance, for ‘D lum’ in R1, Experiment 2, no significant difference was detected between the control and predation means (p = 0.325), yet it was clear from the large number of B. major faecal pellets found in the samples that consisted almost entirely of Daphnia remains, and the many partly consumed Daphnia corpses present, that there had been considerable predation on this prey category. Interpretations using the 5% probability level must thus be regarded as being conservative in detecting significant density changes in this study. Over all the experiments, density reductions that were significant at p = 0.05 occurred in 58% of instances (Table 2). All animal prey categories, except ‘D car’, showed at least one significant decrease. Most significant decreases occurred in ‘Clad’ (100% of cases), ‘Rotifers’ (87.5%), ‘D lum’ (80%) and ‘Cal N’ (75%). ‘Cyc N’, ‘Cyc C’, ‘CI–III’ and ‘Other’ showed significant decreases in c. 50%–60% of instances, and ‘CIV–VI’ decreased significantly only once (12.5%). A significant increase in density occurred in only one instance (‘Others’, R3, Experiment 1, Figure 2). Overall mean % reductions in densities of the various animal prey categories during the experiments were: ‘Clad’ 93.4%, ‘Rotifers’ 87.2%, ‘D lum’ 86.0%, ‘Cal N’ 83.4%, ‘Cyc N’ 78.9%, ‘Cyc C’ 59.2%, ‘CI–III’ 58.5%, ‘Other’ 29.0%, ‘D car’ 0.7% and ‘CIV–VI’ –10.1%. Mean daily % reductions (Table 3) varied from −0.83% to 19.36%.copepod−1.L−1 and were higher for ‘Clad’, ‘Rotifers’, ‘D lum’, ‘Cal N’ and ‘Cyc N’ (c. 12%–19% copepod−1.L−1), than ‘Cyc C’, ‘Cal CI–CIII’ and ‘Other’ (5%–6%.copepod−1.L−1). ‘D car’ and ‘Cal CIV–VI’ increased on average.
| Prey category | n | Decreases | Increases | ||
|---|---|---|---|---|---|
| No. | % | No. | % | ||
| D car | 3 | 0 | 0 | 0 | 0 |
| D lum | 5 | 4 | 80 | 0 | 0 |
| Clad | 5 | 5 | 100 | 0 | 0 |
| Cal N | 8 | 6 | 75 | 0 | 0 |
| CI–CIII | 8 | 4 | 50 | 0 | 0 |
| CIV–CVI | 8 | 1 | 12.5 | 0 | 0 |
| Cyc N | 8 | 5 | 62.5 | 0 | 0 |
| Cyc C | 8 | 4 | 50 | 0 | 0 |
| Rotifers | 8 | 7 | 87.5 | 0 | 0 |
| Other | 8 | 4 | 50 | 1 | 12.5 |
| Total | 69 | 40 | 58 | 1 | 1.4 |
- Note: Over all three experiments (From data in Figure 2).
| Prey category | Range | Mean |
|---|---|---|
| D car | −0.23–0.56 | −0.02 |
| D lum | 6.76–20.05 | 14.03 |
| Clad | 11.00–34.68 | 19.36 |
| Cal N | 6.87–25.06 | 12.59 |
| CI–CIII | −0.86–10.07 | 5.37 |
| CIV–CVI | −6.40–1.68 | −0.83 |
| Cyc N | 3.53–26.50 | 12.07 |
| Cyc C | 2.89–11.70 | 6.05 |
| Rotifers | 2.31–13.91 | 18.08 |
| Other | −2.82–17.23 | 5.29 |
| Total zooplankton | 1.4–13.7 | 6.85 |
Most rotifer species, other than Keratella procurva, were not present at all sites in all experiments. Calculations of mean density changes (full data not shown) and statistical tests of the differences between control and experimental treatments are thus less precise than for the major prey categories and only those species with significant changes in density are considered here (Table 4). In all cases, densities decreased and there were no significant increases. Daily % reductions were variable and ranged from 6.1% to 21.5%.
| Rotifer | n | Decreases | Increases | F | % Reduction | |||||
|---|---|---|---|---|---|---|---|---|---|---|
| No. | % | Signif. (%) | No. | % | Signif. (%) | Range | Mean | |||
| Keratella procurva | 6 | 6 | 100 | 5 (83) | 0 | 0 | 0 (0) | 99.9–331.4 | 215.3 | 21.5 |
| Synchaeta oblonga | 4 | 4 | 100 | 1 (25) | 0 | 0 | 0 (0) | 69.3–585.3 | 203.8 | 20.4 |
| Trichocerca similis | 4 | 4 | 100 | 2 (50) | 0 | 0 | 0 (0) | 28.9–452.3 | 170.7 | 17.1 |
| Polyarthra dolichoptera | 3 | 2 | 67 | 2 (67) | 0 | 0 | 0 (0) | 0–407.3 | 164.6 | 16.4 |
| Lecane bulla | 1 | 1 | 100 | 1 (100) | 0 | 0 | 0 (0) | — | 153.0 | 15.3 |
| Keratella slacki | 3 | 3 | 100 | 2 (67) | 0 | 0 | 0 (0) | 86.6–231.5 | 147.5 | 14.8 |
| Lecane quadridentata | 1 | 1 | 100 | 1 (100) | 0 | 0 | 0 (0) | — | 99.9 | 10.0 |
| Testudinella elliptica | 2 | 1 | 50 | 1 (50) | 1 | 50 | 0 (0) | −10.4-132.4 | 61.0 | 6.1 |
- Note: Numbers of replicates over all three experiments (n), numbers of decreases or increases in abundance (No.), percentages of decreases or increases (%), numbers and percentages (Signif., [%]) of statistically significant (p < 0.05) decreases or increases, clearance rates (mL.copepod−1.day−1) (range and mean) and mean daily percentage reduction of densities (%.copepod−1. day−1. L−1). % reduction is estimated as 0.1 mean F. Species are ranked according to F value.
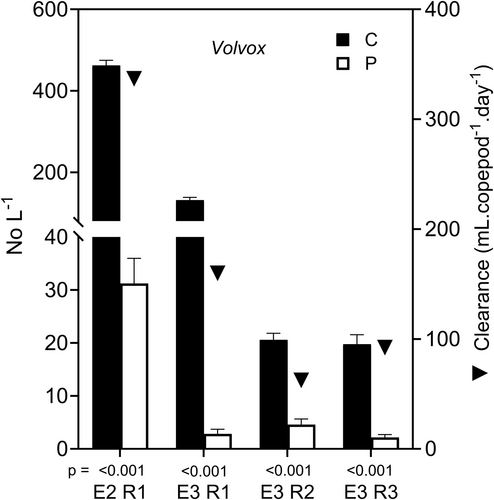
Densities of Volvox colonies were significantly reduced in the four instances when they were present (Figure 3). Overall % reductions of Volvox colonies varied from 77.7% to 97.9% (mean 89.5%) and daily reductions from 6.2% to 33.6% (mean 16.3%).copepod−1.day−1.
3.2 Clearance and Consumption Rates
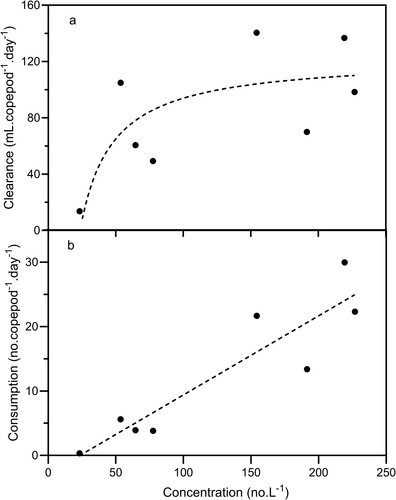
Clearance rates on total zooplankton (Figure 1) ranged from 13.7 to 140.5 mL.copepod−1.day−1, and the overall mean (84.2 mL.copepod−1.day−1) differed significantly from zero (t7df = 5.423, p = 0.001). Consumption rates on total zooplankton (Figure 4) increased linearly with total prey concentration. There was no indication of a saturation level being reached at high concentrations, so this relationship may represent the rising portion of either a Type I or Type II functional response curve. The fitted regression line shown in Figure 4b has been used to calculate a predicted clearance curve, shown in Figure 4a. This curve describes the relationship between clearance and concentration quite well and suggests that clearance rate was constant above a total zooplankton concentration of c. 75.L−1 and that below this there was a rapid decline in clearance rate, reaching zero at a zooplankton concentration of c. 25.L−1. The predicted clearance curve indicates a peak clearance rate of c. 100–110 mL.copepod−1.day−1, and this is similar to the mean value (94.3 mL.copepod−1.day−1) of the seven clearance rates at zooplankton densities greater than 50.L−1.
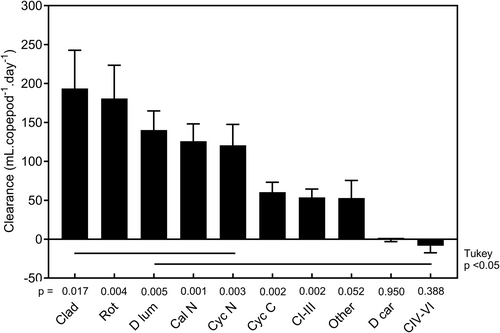
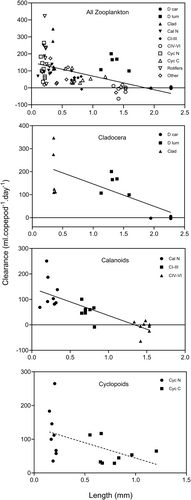
Clearance rates on individual animal prey categories are shown in Figure 2. Mean clearance rates (Figure 5) ranged from 193.6 to −8.3 mL.copepod−1.day−1. All except those of ‘Other’, ‘D car’ and ‘CIV–VI’ were significantly different from zero. One-way ANOVA indicated that there were significant differences among mean clearance rates (p < 0.0001) and Tukey–Kramer multiple comparison tests indicated that those of ‘Clad’ and ‘Rotifers’ (c. 180–190 mL.copepod−1.day−1) were significantly higher than those of other categories (Figure 5). Values for ‘D lum’, ‘Cal N’ and ‘Cyc N’ were intermediate (c. 120–140 mL.copepod−1.day−1) and higher than those of ‘Cyc C’, ‘CI–III’ and ‘Other’ (c. 50–60 mL.copepod−1.day−1). Clearance rate was significantly negatively related to prey length for all zooplankton (Figure 6), for the combined categories of ‘Cladocera’ (=‘Clad’, ‘D lum’ and ‘D car’) and ‘Calanoids’ (=‘Cal N’, ‘CI–III’ and ‘CIV–VI’), marginally for ‘Cyclopoids’ (=‘Cyc N’ and ‘Cyc C’), but not in ‘Rotifers’ and ‘Other’. Clearance rates reached zero at prey lengths of c. 2.5 mm in ‘Cladocera’ and c. 1.5 mm in both ‘Calanoids’ and ‘Cyclopoids’. In no instance was there a statistically significant relationship between clearance rate and prey concentration (data not shown), although in ‘CI–III’ and ‘Rotifers’ there were suggestions that clearance rates may have declined below c. 10.L−1, and perhaps of lower rates at higher concentrations in ‘Cal & Cyc N’ and ‘Cyc C’.
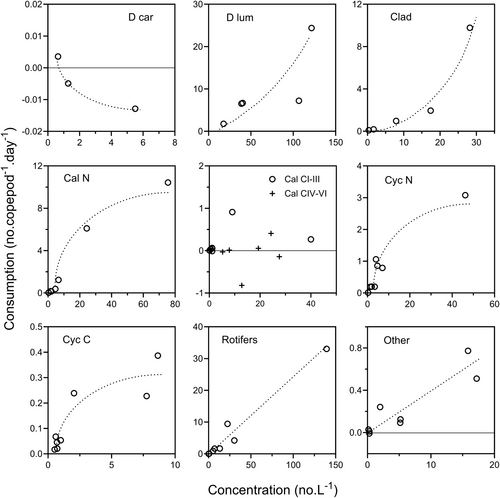
Consumption rates of individual animal prey categories in relation to prey concentration are shown in Figure 7. Possible functional responses have been indicated by the dotted curves although, because of the small number of data points, these suggestions cannot be definitive. For ‘Rotifers’ and ‘Other’ the relationships between consumption rate and concentration appear to be linear and may represent the left-hand portions of Type I or II functional response curves. For ‘Cyc N’ and ‘Cyc C’, the relationships appear to be Type II responses, and the highest densities encountered in the experiments would seem to be near the saturation densities in each case. In ‘D lum’ and ‘Clad’, consumption rate appears to increase exponentially with prey concentration and these relationships may thus be the left-hand portions of Type III responses. This may be also true of ‘Cal N’, for which consumption increases exponentially between 0 and c. 7 nauplii.L−1. The saturation density for ‘Cal N’ may be near the highest densities encountered during the experiments (c. 80. nauplii.L−1). The response for ‘D car’ was rather different from the others, and declined exponentially, with positive consumption rates only at the lowest densities. This curve may represent the extreme right-hand portion of a Type I or II functional response, in which case some characteristic of ‘D car’ must make its handling time much greater than for the other animal prey categories. For ‘CI–CIII’ and ‘CIV–VI’, no patterns were evident.
Rotifer species clearance rates (F) for those species with statistically significant decreases or increases in abundance are given in Table 4. Values were quite variable and may be divided into three broad groupings: those with high values (F between ca. 215 and 200 mL.copepod−1.day−1) (Keratella procurva and Synchaeta oblonga), those with medium values (F between ca. 200 and 140 mL.copepod−1.day−1) (in order Trichocerca similis, Polyarthra dolichoptera, Lecane bulla and Keratella slacki) and those with low values (F between ca. 140 and 60 mL.copepod−1.day−1) (Lecane quadridentata and Testudinella elliptica). The relationship between rotifer species size and clearance rate was not significant (r = −0.241, p = 0.257). Rotifer taxa with nonsignificant changes in abundance (because of low densities and high variance between replicates) were Euchlanis incisa, Trichotria tetractis similis, Asplanchna sieboldii, Lecane luna, Epiphanes macroura, Mytilina ventralis and Brachionus quadridentatus.
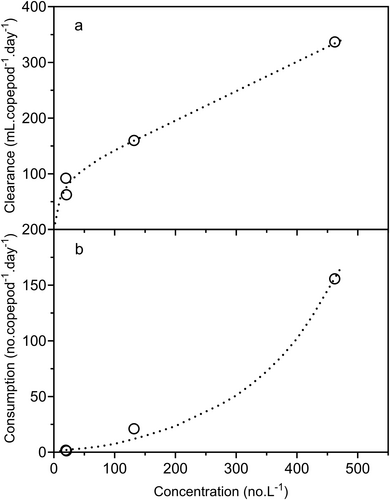
Clearance rates on Volvox colonies (mean 162.9, range 62.5–336.8 mL.copepod−1.day−1, Figure 3) increased steadily between c. 25 and 500 colonies.L−1 (Figure 8a). Consumption rate may have increased exponentially with colony density (Figure 8b).
3.3 Relative Selectivity for Animal Prey Categories
The mean selectivity values (as Chesson's α) of B. major for the various overall prey categories are shown in Figure 9. The R3 and the R1 & R2 data had to be treated separately because of the different range of prey categories present. For the R3 data n is thus only 3, and in this case the ability of the t tests to detect differences between the mean values and the value for random selection is very weak. ‘Rotifers’, ‘Clad’ and ‘Cal N’ were significantly positively selected in R1 & 2 but in R3, only the mean selectivity for ‘Cal N’ was significantly different from the value for random selection. ‘D lum’, ‘CI–III’, ‘Cyc N’, ‘Cyc, C’ and ‘Other’ were all selected in proportion to their abundance in R1 & 2, and in R3 this was true for ‘CI–III’, ‘Cyc N’, ‘Cyc, C’, ‘Rotifers’ and ‘Other’. ‘D car’ was significantly negatively selected in R3, as was ‘CIV–VI’ in both R1 & 2 and R3. There were significant negative linear relationships between selectivity and prey length in both R3 and R1 & 2 and in both instances the slopes were very similar (Figure 10). The high selectivity for ‘D lum’ in R1 & 2 is an outlier has been omitted in calculating the regression line. It appears that there is some characteristic of ‘D lum’ that results in a higher selectivity than expected from its length.
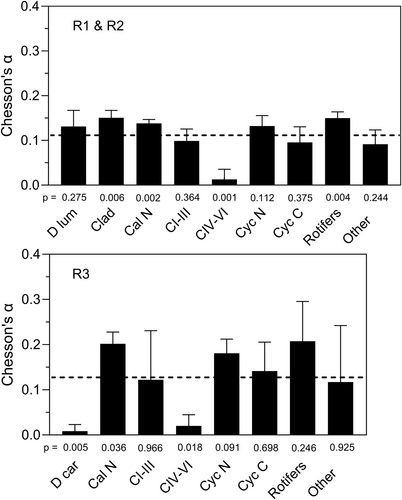
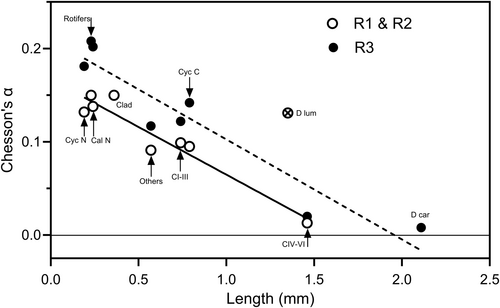
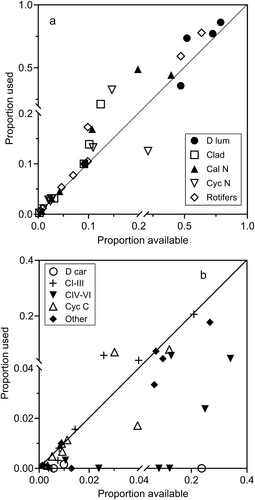
Figure 11 presents the data in the format of Murdoch (1969) that is conventionally used to indicate whether switching between prey types occurs. Most of the data points for those prey categories that had significant positive α values (‘Rotifers’, ‘Cal N’, ‘Clad’) lie above the diagonal line in Figure 11a, while those categories with significant negative selectivities (‘D car’, ‘CIV–VI’) lie mainly below the diagonal line in Figure 11b. The trend of the data in Figure 11a shows the characteristic sigmoid pattern expected of switching behaviour. Below an available proportion value of c. 0.1, prey is used in proportion to availability, but above this a switch occurs to utilisation in excess of availability with most data points lying above the line.
3.4 Attack Pattern on Daphnia lumholtzi
A greater number of Daphnia lumholtzi corpses were found in Experiment 2 (3388 corpses) than in Experiment 3 (107). This may reflect the higher densities of ‘D lum’ in Experiment 2, in both R1 and R2 (Figure 2). However, Experiment 2 was of shorter duration than Experiment 3 (1 day cf. 3 days) and the results may indicate that B. major did not necessarily completely consume a daphnid after an initial attack, and that corpses were completely consumed only over a longer period. The proportions of corpses in the three injury states (A, minus the tail spine; B, minus the head and antennae; C, minus the tail spine, head and antennae) were similar in both R1 and R2 in both experiments, and overall values were: A = 12.3%, B = 61.5%, C = 26.2%.
3.5 Potential Impact of Predation by B. major Adults
Estimates of the doubling times (DT) of prey categories and their half-lives (HL) at various densities of B. major are shown in Table 5. Clearance rates on ‘D car’ and ‘CIV–VI’ were negative, so for them HL was always greater than DT, indicating that they will be unaffected by B. major predation. None of the other prey categories were safe from predation at or above B. major densities of 10.L−1. At a B. major density of 5.L−1 ‘Other’ and ‘CI–III’ just become safe, but at a B. major density of 1.L−1, all prey categories other than ‘Clad.’ are predicted to be safe from predation.
| Prey | DT | Prey half-life (days) | ||||
|---|---|---|---|---|---|---|
| 1 | 5 | 10 | 15 | 20 | ||
| Category | (Days) | Bm.L−1 | Bm.L−1 | Bm.L−1 | Bm.L−1 | Bm.L−1 |
| Clad | 6.93 | 3.58 | 0.72 | 0.35 | 0.24 | 0.18 |
| Rotifers | 0.99 | 3.83 | 0.77 | 0.38 | 0.26 | 0.19 |
| Daph lum | 2.04 | 4.94 | 0.99 | 0.49 | 0.33 | 0.25 |
| Cal N | 2.57a | 5.51 | 1.10 | 0.55 | 0.37 | 0.28 |
| Cyc N | 2.57a | 5.74 | 1.15 | 0.57 | 0.38 | 0.29 |
| Cyc C | 2.57a | 11.46 | 2.29 | 1.15 | 0.76 | 0.57 |
| Cal CI–III | 2.57a | 12.91 | 2.58 | 1.29 | 0.86 | 0.65 |
| Others | 2.57b | 13.10 | 2.62 | 1.31 | 0.87 | 0.66 |
| Daph car | 2.04 | — | — | — | — | — |
| Cal CIV–VI | 2.57a | — | — | — | — | — |
- Note: Half-lives (HL) of the various prey categories (the number of days required to clear 50% of the population) at different densities of B. major are compared to estimates of prey doubling times (DT). The shaded area indicates HL < DT and that the prey is susceptible to elimination by predation. The DT values are calculated from values of rmax for high food levels at 20°C summarised by Nero and Sprules (1986) from literature values. Half-life estimates are based on the mean clearance rates presented in Figure 5 and prey categories are ranked in order of clearance rate. — clearance rates are negative. The B. major densities of 5, 10 and 15 adults.L−1 are similar to the natural range of densities of B. major (3.2–15.3, mean 7.7.L−1) in Ryan's 3 billabong during August 1991.
- a Based on values for adult calanoids.
- b Based on values for Chydorus.
3.6 Effects of Predation on Zooplankton Size Distribution and Community Composition
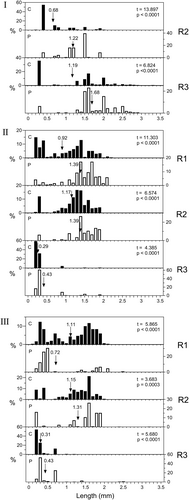
Size frequency distributions of the total zooplankton in the control and predation treatments are shown in Figure 12. In all instances, except R1 in Experiment 3, the mean length of the zooplankton community was significantly greater in the predation than the control treatments. Predation means exceeded control means by 0.142–0.543 (mean 0.317) mm. In most cases, there appeared to be little impact on zooplankton larger than c. 1.5 mm. In R1 Experiment 3, by contrast, the predation mean was 0.393 mm less than the control mean, even though there had been marked removal of zooplankton in the 0.8–1.5 mm size range. The mean value in the predation treatment dropped despite this because of large increases in numbers of animals in the 0.4–0.6 mm size classes, mainly small Alona and Graptoleberis. Both these taxa were probably mainly associated with the surfaces of the bags, which may have protected them from B. major predation.
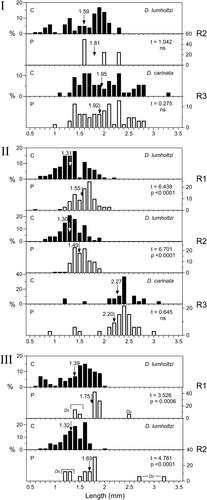
Daphnia length-frequency distributions are shown in Figure 13. Mean lengths of D. carinata in R3 Experiment 1 and R3 Experiment 3 were not significantly different between control and predation treatments, but in all instances, except R2 Experiment 1, mean lengths of D. lumholtzi were significantly larger in the predation treatments. In R2 Experiment 1, the mean length of D. lumholtzi was also larger, but not significantly so because in the predation treatment so few animals remained that variance was high. In Experiment 2, with a duration of 1 day, there did not appear to be predation on any D. lumholtzi longer than c. 1.4 mm, but in Experiments 1 and 3 (durations of 2 and 3 days, respectively) those with lengths of up to 2 mm or more were eaten. In D. carinata, especially in Experiment 1, animals shorter than 1.5 mm did not suffer any predation even though there were considerable numbers of them. This suggests that some feature of D. carinata, other than simply its larger size, makes it less susceptible to predation than D. lumholtzi. In R1 and R2 in Experiment 3, a few D. carinata were present in the predation treatments (shown in Figure 13 as ‘Dc’) although none were found in the controls. Some of these were early instars, shorter than 1.5 mm.
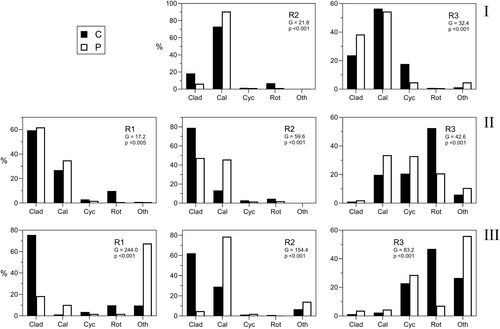
Community composition, as mean proportions of the overall groups, in control and experimental treatments is shown in Figure 14 and in all cases there were significant differences between predation and control proportions. The differences were generally in line with the predictions based on comparisons of HL and DT for the various prey categories (Table 5) at the densities of B. major in the experiments (15.L−1 in Experiment 1 and 8.L−1 in Experiments 2 and 3). In R3, the proportions of cladocera (‘Clad’—predominantly Daphnia carinata) always increased, whereas in R2 and R3, where the main cladoceran was D. lumholtzi, ‘Clad’ proportions decreased in all but one instance (Experiment 2, R1). Proportions of calanoid copepods (‘Cal’) increased markedly in all instances except Experiment 1 R3, where there was a slight decrease in proportions. In this case, the calanoid population was more than 50% nauplii, which are predicted to be markedly affected by predation. Rotifer (‘Rot’) proportions were always lower in the predation treatments as predicted. Cyclopoid copepods (‘Cyc’) were predicted in Table 5 to be unsafe from predation at the prevailing densities of B. major, yet their proportions increased in three out of eight of the predation treatments (37.5%). In these cases, however, their densities were significantly reduced (Figure 2), and their proportions increased because their density was less affected than densities of other categories (i.e., rotifers and cladocerans). The proportions of Other (‘Oth’) always increased, even though its densities were sometimes significantly reduced (Figure 2), and for this category it seems likely that the predicted DT (based on r values for Chydorus only, whereas the ‘Other’ category usually contained large proportions of testate amoebae) is too low.
| Site/experiment | Control | Predation | % Reduction | t | p | ||
|---|---|---|---|---|---|---|---|
| Mean | SD | Mean | SD | ||||
| Expt 1 | |||||||
| Ryan's 2 | 8.6 | 1.14 | 4.4 | 1.14 | 48.8 | 5.824 | < 0.001 |
| Ryan's 3 | 4.4 | 1.14 | 4.2 | 0.45 | 4.6 | 0.365 | 0.362 |
| Expt 2 | |||||||
| Ryan's 1 | 14.2 | 1.48 | 9.8 | 1.30 | 31.0 | 4.982 | < 0.001 |
| Ryan's 2 | 10.1 | 0.71 | 7.6 | 1.52 | 24.0 | 3.207 | 0.006 |
| Ryan's 3 | 18.6 | 2.30 | 13.6 | 1.14 | 26.9 | 4.352 | 0.001 |
| Expt 3 | |||||||
| Ryan's 1 | 12.8 | 0.84 | 6.4 | 2.61 | 50.0 | 5.226 | < 0.001 |
| Ryan's 2 | 10.0 | 1.58 | 7.8 | 1.48 | 22.0 | 2.269 | 0.027 |
| Ryan's 3 | 16.0 | 2.12 | 9.2 | 2.95 | 42.5 | 4.185 | 0.002 |
- Note: Percentage reduction of species number (difference between control and predation means as a percent of the mean control value) and results of t-tests comparing the mean values are also given. In all cases, n = 5.
Mean numbers of species in control and predation treatments are shown in Table 6. In all cases, except in R3, Experiment 1, there were significantly fewer species in the predation treatments. Percentage reduction of species number ranged from 4.6% to 50.0% (mean 31.2%).
4 Discussion
This study largely confirms the conclusions of Green et al. (1999) by showing that in fishless Australian billabongs Boeckella major is a top predator that can markedly influence the structure of the zooplankton community by reducing total densities and altering community composition. The size distribution of the zooplankton community is altered in favour of larger sizes and species diversity (as measured by the numbers of species present) is reduced. These effects are those expected of invertebrate predators of zooplankton and like those reported for a range of other predatory calanoid and cyclopoid copepods, Chaoborus and juvenile notonectids (see summary by Gliwicz and Pijanowska 1989; Hampton et al. 2000). However, the effects of B. major on zooplankton size distributions are the opposite of those for fish planktivores, which usually cause decreases in mean size of zooplankton (e.g., Brooks and Dodson 1965; Carpenter and Kitchell 1993; Schabetsberger et al. 2009; Iglesias et al. 2011; Jeppesen et al. 2024).
In the experiments, densities of rotifers (when considered as a group), various cladocerans (e.g., Daphnia lumholtzi, Bosmina meridionalis, Ilyocryptus spinifer) and copepod nauplii were all markedly reduced, while densities of Daphnia carinata, late stage copepodites of calanoid, and perhaps cyclopoid copepods, and surface-associated taxa (e.g., chydorids, ostracods, testate amoebae) were little affected or unaffected. Both the overall percentage reductions (range c. 33%–92%) and mean daily reductions (range c. 5%–14%.copepod−1.L−1) of total zooplankton densities were very marked in all experiments. The overall % values are similar to cropping rates by natural densities of Mesocyclops edax on rotifers (13.5%–23.9% of standing crop) and crustaceans (5.7%–9.9% of standing crop) (Brandl and Fernando 1979), to daily % reductions of various rotifers by small Chaoborus (1%–44%) (Rodusky and Havens 1996), although daily % reductions of calanoid and cyclopoid copepodites, small cladocerans (e.g., Bosmina) and Daphnia spp. (all mostly in the range 20%–100%) by small Chaoborus were higher than by B. major. For Polyarthra vulgaris and P. dolichoptera, Plaβmann et al. (1997) found daily reductions of between 6% and 36% by Cyclops vicinus, similar to values for rotifers in this study, but markedly higher values than in our study for Synchaeta oblonga and S. pectinata (30% and 90% of the population cleared daily). The large impact of B. major on zooplankton densities is also consistent with long-term field studies of the predatory effects of other similar-sized large freshwater calanoids which demonstrate that such copepods can markedly reduce or eliminate prey populations of small and medium-sized zooplankton. For example, McNaught et al. (1999) found that after reintroducing Hesperodiaptomus arcticus to Snowflake Lake following trout removal, even a small population of H. arcticus was able to rapidly suppress population densities of rotifers and copepod nauplii, and O'Brien (2001) showed that in fishless arctic ponds, introduction of predatory Heterocope septentrionalis caused the extinction of Daphnia pulex within 1 year and reduced the density of Bosmina meridionalis to extremely low levels after 4 years.
The effects of B. major predation are due to a combination of high clearance rates on some prey types and differential selectivity for prey, associated mainly with prey size.
4.1 Clearance Rates on Animal Prey
Clearance rates on total zooplankton were c. 80–120 mL.copepod−1.day−1. For individual overall prey types values were highest for rotifers, small cladocerans (Bosmina, Ilyocryptus) and Daphnia lumholtzi (c. 140–190 mL.copepod−1.day−1). For calanoids feeding on rotifer prey, values in the literature range from < 10 mL.copepod−1.day−1 (Boeckella triarticulata [length ca. 2.1 mm] feeding on Keratella tecta; Couch et al. 1999) to 100–190 mL.copepod−1.day−1 (Skistodiaptomus pallidus [length ca. 1.2 mm] feeding on Synchaeta oblonga; Williamson and Butler 1986). In our study clearances on individual rotifer species show a similar range (61–215 mL.copepod−1.day−1, Table 4). For small cladoceran prey, literature values range from 120 to 240 mL.copepod−1.day−1 (Epischura lacustris [length ca. 2 mm] feeding on Bosmina; Chow-Fraser and Wong 1986) to 875–1800 mL.copepod−1.day−1 (Parabroteas sarsi [length ca 3.5–4.5 mm] feeding on Ceriodaphnia dubia juveniles; Vega 1997). By contrast, values for the cyclopoid copepod Mesocyclops edax (length ca. 1.6 mm) fall in the range 4–46 mL.copepod−1.day−1 in the field and 48–110 mL.copepod−1.day−1 in the laboratory (Williamson 1984). For Daphnia prey, values range from 16 to 36 mL.copepod−1.day−1 (Heterocope septentrionalis [length ca 3.8–4 mm] feeding on D. middendorffiana; Luecke and O'Brien 1983) to 190–1640 mL.copepod−1.day−1 (H. septentrionalis feeding on D. pulex; Luecke and O'Brien 1983).
B. major clearance rates were intermediate for copepod nauplii and cyclopoid copepodites (c. 60–125 mL.copepod−1.day−1). Similar ranges were reported by Schulze and Folt (1989) for Epischura lacustris feeding on nauplii (45–135 mL.copepod−1.day−1) and by Hada and Uye (1991) for Sinocalanus tenellus (length ca. 2.1 mm) feeding on its own nauplii of 63–155 mL.copepod−1.day−1. These values are, however, an order of magnitude lower than reported for the marine calanoid Labidocera trispinosa (length ca. 2.8 mm) feeding on nauplii of a range of calanoid species (300–2700 mL.copepod−1.day−1) (M. R. Landry 1978).
Lowest clearance rates of B. major were for calanoid copepodites I–III and surface-associated taxa (c. 50 mL.copepod−1.day−1). Daphnia carinata and calanoid copepodites IV, V and adults were unaffected by B. major predation. By comparison, M. R. Landry (1978) reported a range of 300–1500 mL.copepod−1.day−1 on CI–II of five marine calanoid species by Labidocera trispinosa. Feeding rates of Heterocope septentrionalis on Diaptomus pribilofensis ranged from 166 to 254 mL.copepod−1.day−1 (Luecke and O'Brien 1983).
Clearance rates in this study appeared to be largely independent of prey concentration over the range of concentrations examined but dropped to zero at very low prey concentrations (cf., Williamson 1983; Williamson and Butler 1986; Schulze and Folt 1989). For total zooplankton this effect was most noticeable below c. 20 prey.L−1 and can be seen as providing a refuge from predation for prey. This was true also of rotifers and calanoid copepodites I–III, but at lower concentrations. As is usually found with invertebrate predators (e.g., Luecke and O'Brien 1983; Hampton et al. 2000), clearance rate declined with increasing prey size and fell to zero at lengths of c. 2.5 mm in cladocerans, and 1.5 mm in copepods. The upper limit of prey size for B. major thus appears to be c. 2 mm, which is also the case in the similarly sized Heterocope septentrionalis (Luecke and O'Brien 1983). The size frequency data show, however, that predation effects on D. lumholtzi can extend into size groups larger than 2 mm at longer exposure times, which may be a starvation effect.
4.2 Differential Selectivity for Prey
The main difference between this study and that of Green et al. (1999) is that in our earlier study nauplii were negatively or neutrally selected and copepods were neutrally selected, although the mean value for copepods was slightly negative. In the present study, nauplii were positively or neutrally selected, late-stage calanoid copepodites (CIV–CVI) were negatively or neutrally selected, while the remainder appeared to be selected in proportion to their abundance. These differences may arise because fewer diet categories were recognised in our earlier study than here (e.g., all calanoid and cyclopoid copepodites were treated together in the field study, as were calanoid and cyclopoid nauplii) and because of the wider variance of the estimates of Chesson's α in the field study, which meant that even though there were often differences between mean values of α and the value for neutral selection these were rarely statistically significant.
Differences in selectivity between prey seem largely to be determined by prey size, with selectivity dropping below the neutral values at a prey size of approximately 1 mm in both R3 and R1 & 2. Selectivity for D. lumholtzi appears to be higher than expected from its mean size, suggesting that some feature(s) make it particularly vulnerable to predation. Prey vulnerability is determined by the probabilities of encounter, attack, capture and ingestion (e.g., Luecke and O'Brien 1983; Williamson 1986). For D. lumholtzi, encounter probabilities could be raised if it is a particularly ‘noisy’ swimmer, or perhaps if it forms high density patches that can be exploited by B. major. Attack probabilities could be raised if it is easily caught, perhaps because it has a weak escape reaction. Capture probability of D. lumholtzi may be high because it is easily grasped, and some laboratory observations by us support this suggestion. Despite Engel et al. (2014) finding that long spines in D. lumholtzi protect against predation by fish and Chaoborus, we have observed B. major feeding on juvenile D. lumholtzi to grasp the prey by the extended tail spine and feed on this as if on a candy stick, successively chewing off pieces from the posterior end of the spine while holding the prey with the maxillipeds and maxillae. Similarly, Williamson (1983) reported a few instances in which Mesocyclops edax caught Daphnia by the tail spine. Another possibility is that the carapace may be relatively weak, compared with that of D. carinata. This has been found for D. pulex, which has a weaker carapace than D. middendorffiana and so is much more likely to be captured by Heterocope septentrionalis (Luecke and O'Brien 1983).
Although we have not calculated Chesson's index for individual rotifer species, because of the small number and variation of species in the individual experiments, the differences in clearance rates suggest that the species varied in their vulnerability to B. major predation. On this basis, Keratella procurva and Synchaeta oblonga were the most vulnerable, Trichocerca similis, Polyathra dolichoptera, Lecane bulla and K. slacki of lower vulnerability and Lecane quadridentata and Testudinella elliptica the least vulnerable. In rotifers, the escape and protection characteristic of each species determine the extent to which it is vulnerable to predation—soft-bodied species (such as Synchaeta in this study) are usually more vulnerable than those with spines (e.g., T. similis, K. slacki and L. quadridentata in this study) or hard loricas (K. slacki, T. elliptica in this study) (Brandl 2005). Other species show well developed escape movements that enable them to avoid being entrained in the predator's feeding currents. For example Gilbert and Williamson (1978), Gilbert (1985) and Williamson (1987) found that species of Polyarthra use rapid movements of their lateral appendages to suddenly jump up to 15 body lengths away from their original position while Williamson (1987) and Gilbert and Kirk (1988) found that Keratella cochlearis and K. testudo can escape by a rapid increase in swimming speed for ca. 2 s that causes an active displacement of up to 18 body lengths. By contrast, Williamson and Vanderploeg (1988) found that K. cochlearis did not respond in this way to the feeding currents of Diaptomus pallidus and was easily captured, although then rejected by the copepod. In our study it is unknown why the apparent vulnerability of K. procurva is as high as for the soft-bodied Synchaeta, despite it being larger than K. cochlearis and possessing anterior and posterior spines. Possibly its lorica is softer than other Keratella species.
Other factors that may affect selectivity of prey by B. major are the types of functional responses shown for different prey types, and the possible presence of switching behaviour. Over the ranges of prey densities examined, there were weak indications that the functional response curves for most prey could have been the rising left-hand portions of either Holling Type I or II relationships, which are typical of most invertebrate feeding responses. Some, however, were possibly Type III responses which are interesting because here the relative intensity of predation increases with prey density, so that the predator's functional response alone (as opposed to a numerical response) can act as a controlling influence on prey numbers. Conversely, the effects of predation relax disproportionately as prey densities drop, contributing to a prey refuge at low densities. This response may be tied in with the possibility of switching behaviour in B. major. It appears that above an available prey proportion of c. 0.1 prey become positively selected, and this may be the mechanism contributing to a Type III functional response. The causes of switching in B. major are unknown, but possible mechanisms by which a predator may discriminate prey types when faced with alternatives include: (a) rejection of less abundant prey, (b) forming a search image for the most abundant prey, (c) learning to capture the most abundant prey with greater efficiency, and (d) locating and spending most time in high density patches of prey (various sources, summarised by M. R. Landry 1981). A shift from a suspension feeding mode at low prey densities to an ambush and jump mode at higher prey densities (e.g., Kiørboe 2016; Ryderheim et al. 2023) may also be involved.
4.3 Attack Modes on Daphnia lumholtzi
The handling of daphniid prey by B. major resembles very closely the patterns observed in Parabroteas sarsi preying on Daphnia ambigua by Vega (1995). In 60% of attacks by P. sarsi, the head was severed (cf. 61.5% in B. major attacks), 10% were posterior attacks, lacking the tail spine (12.3% in B. major), and a further 10% were both head and tail attacks (cf. 26.2% in B. major). The proportions of attack modes found in B. major may indicate that the prey was attacked initially by grasping either the head and/or antennae or the tail spine, with the former being the most common, and that in some instances, the prey was then manipulated so that both ends of the body were attacked. Such suggestions are in accord with a few direct laboratory observations we made of prey handling by B. major. These showed that captured D. lumholtzi were held upright (i.e., with their dorsoventral axis at right angles to the copepod's ventral surface) between the second maxillae and maxillipeds and that these appendages could rotate the prey, apparently until it was in the correct orientation for the mandibles to be able to chew pieces off. Kerfoot (1978) has described similar manipulation of prey by Epischura nevadensis.
4.4 The Role of B. major Predation in the Ecology of Ephemeral Billabongs
Our experiments make it clear that B. major predation can markedly affect zooplankton community structure in Australian ephemeral billabongs and that the main effects to be expected are an increase in the mean length of the zooplankton community and a marked reduction in species richness. However, such effects are likely to be temporally restricted because of the rapid and short life cycle of B. major. It develops to maturity and reproduction within one to 3 weeks of flooding of the habitat but then disappears (Green et al. 1999). The densities of B. major may also be important. The HL/DT comparison suggests that at densities near 1 B. major.L−1 its predation effect will be minimal, although natural densities are probably usually greater than this. For example, during August 1991 in Ryan's 3, we found that total densities of adult B. major ranged from 3.2 to 15.3.L−1 (mean 7.7, n = 7).
Boeckella major is just one in a likely sequence of invertebrate predators in fishless temporary billabongs (cf. Lake et al. 1989). We have found a diverse suite of predators in surveys of ephemeral billabongs on the upper R. Murray floodplain (Shiel et al. 1998; Green and Shiel 1999) including large protists (e.g., Bursaria), Hydra, flatworms, naiidid oligochaetes, a wide range of cyclopoid copepods, ostracods, odonate and beetle larvae and adults and notonectids. Such invertebrate predators are probably significant organisers of biodiversity in these habitats as they are in some North American ponds (e.g., Black II and Hairston Jr 1988). Their predation is likely to be a significant selective factor favouring certain organisms, life cycle strategies etc. that are best able to avoid or minimise the predation occurring at a particular stage of billabong succession. Thus during B. major phases, larger species are likely to have higher r values and will dominate, while most small species will be weeded out. The impact of B. major predation is so marked that it may be a selective force great enough to favour emergence of larger species from the egg bank early in pool development, when B. major is present, and conversely a mainly later emergence of smaller species. Also, predation may play a role in filtering the species that develop from the incoming rain of dispersal propagules. Langley et al. (2001) have shown that a suite of rotifers are aerially dispersed between habitats on the R. Murray floodplain, although the extent of this dispersal input is uncertain for other taxa. Other predators (e.g., dytiscids), which occur later in the development of ephemeral billabongs (e.g., Lake et al. 1989), probably have opposite effects to B. major, removing larger species. Because of their differing influences, such predators are likely to modify the outcomes of any competitive interactions between other members of the billabong community by removing one or more competitors (e.g., as described by Lynch 1979; Arnér et al. 1998). Predation may thus indirectly favour certain species at some times more than others and so increase the overall biodiversity of these habitats.
Author Contributions
The authors take full responsibility for this article.
Acknowledgements
The study was partly funded by a sabbatical leave grant to J.D.G. from the University of Waikato Leave Committee. J.D.G. is also grateful for logistic support from the Murray-Darling Freshwater Research Centre and the encouragement of MDFRC Directors Drs David Mitchell and Terry Hillman. R.J.S. acknowledges joint fare support from the Cooperative Research Centre for Freshwater Ecology and the Department of Biological Sciences, University of Waikato to enable travel to New Zealand for the completion of this study. Open access publishing facilitated by The University of Waikato, as part of the Wiley - The University of Waikato agreement via the Council of Australian University Librarians.
Conflicts of Interest
The authors declare no conflicts of interest.
Open Research
Data Availability Statement
Data are available from the authors upon reasonable request.


