The behavior of anisotropic fatigue short crack initiation and propagation for a directionally solidified superalloy CM247LC at room temperature
Abstract
The effects of mechanical and microstructural anisotropy on short fatigue crack initiation and propagation behaviors of a directionally solidified superalloy have been studied. An unusual result was found where the fatigue lives of specimens with grains longitudinally aligned along the loading direction fail at lower lifetimes than specimens with transversely loaded grains when the applied stress is close to the yield stress. This is mainly attributed to the lower Young's modulus of the longitudinal specimen, which induces more local plastic strain (at stress concentration features) leading to earlier crack initiation and faster crack propagation under the applied test stress.
Highlights
- Different types of fatigue specimens are designed to study the anisotropic short fatigue crack growth behaviors.
- The anisotropic total fatigue life is mainly affected by the Young's modulus.
- Local plastic strain achieved in the low-Young's modulus specimens results in the much earlier crack initiation.
- The short crack growth behavior is under the co-effects of Young's modulus and microstructures.
1 INTRODUCTION
Directionally solidified (DS) and single-crystal (SX) superalloys have largely replaced polycrystalline superalloys for gas or aircraft turbine blades, serving under high temperatures and complex stress states. Their use in such applications is due to their superior high temperature mechanical properties (i.e., creep) deriving from reducing the grain boundary (GB) area. However, with the associated decrease in the number of grains, the mechanical properties move from isotropy to anisotropy,1-4 which means the relationship between grain orientation and loading direction plays a much more important role in DS or SX superalloys than in polycrystalline superalloys. As a result, many studies5-7 have been carried out to understand the role of these anisotropic mechanical properties, in an attempt to explore the optimum relationship between the grain orientation and loading direction to prolong the service life of DS and SX superalloys.
Initially, researchers have mainly focused on the elastic and plastic anisotropy of the DS and SX superalloys, which are the fundamental mechanical properties. It was found that the Young's modulus is the lowest when DS grains (parallel to <001> direction) are aligned with the loading direction, while it is highest when the loading direction is 45 degrees inclined to the <001> grain elongation direction.6, 8, 9 Similar results have been found in SX superalloys that the Young's modulus is the lowest in the [001] direction. However, it is found that the yield stress of the [001] direction is the highest, which is due to it having the lowest maximum Schmid factor (SF), increasing the difficulty in activating the slip systems.10-12 A recent study performed by Pei and Yuan13 obtained similar results in additively manufactured superalloy where a specimen with loading direction parallel to the building direction (where columnar grains grow parallel to the building direction) exhibits the highest tensile stress but lowest fracture strain. In comparison, the specimen with loading direction transverse to the building direction shows the lowest tensile stress but highest fracture strain. They also thought the anisotropy in strength is attributed to the average SFs for the different loading directions.
With the developing knowledge of the elastic and plastic anisotropy of the DS and SX alloys, the effects of the anisotropy on the materials' more complex creep and fatigue behaviors have incurred significant research interest, because these are closely associated with the service life of the DS and SX superalloys. Reed et al.14, 15 designed a series of tests to study the orientation effects (with respect to loading and crack propagation direction) on long fatigue crack propagation behavior. They found that the fatigue propagation behavior is not only affected by the crystal orientation aligned with the loading direction but also influenced by the “secondary crystal orientation,” which is perpendicular to the loading direction but parallel to (and defining) the overall crack growth direction. Cervellon et al.16 also noticed the effects of anisotropy induced by grain orientation. They carefully compared the high-cycle fatigue behaviors of a SX superalloy with [001], [011], and [111] orientation aligned with the loading direction, under different maximum stress. It was found that [001] orientation sample only shows a longer fatigue life at very low (elastic) stress levels (around 250 MPa). The same results have been found in the work of Yu et al.,17 where the [111] loading direction exhibits the highest fatigue strength. This was mainly attributed to the different movement modes of dislocations which cut through γ and γ′ for the [001] and [011] directions, forming superlattice stacking faults for the [111] direction. Lindström et al.18 found anisotropic fatigue behaviors for an additively manufactured superalloy tested under low-cycle fatigue (LCF) and thermal mechanical fatigue (TMF) at elevated temperatures. The fatigue crack initiation life is obviously decreased when loading direction is transverse to the building direction in both LCF and TMF tests. All these results indicate that significant effects have been induced by the material anisotropy on the fatigue resistance of DS and SX superalloys. These effects should clearly be considered when manufacturing blades with DS or SX superalloys.
Although the above results clearly reveal anisotropic fatigue behaviors, most explain the results by primarily considering the different dislocation slip mechanisms. However, this explanation is only based on considering the anisotropic plastic deformation modes, neglecting the potentially more significant effects brought in by the strong elastic anisotropy,19, 20 since most of these materials operate under conditions where the overall loading stress is lower than their yield stress, thus elastic anisotropy dominates the far-field stress state. In addition, the studies of fatigue anisotropy are mostly focused on SX superalloys where it is easy to control the relationship between loading direction and crystal orientation.21, 22 For DS superalloys, another very important industrial material system, related research is much less, partly due to the difficulty in aligning a specific crystal orientation to the loading direction. In a DS system, columnar grains grow along [001] direction (the solidification direction),23, 24 while the direction perpendicular to the solidification direction has a random secondary crystal orientation. The grain sizes are also large, often in the order of millimeters. The anisotropic Young's modulus and yield stress are dependent on the relationship between the grain elongation direction and the loading direction. Therefore, the current work is carefully designed to systematically assess the effects of elastic modulus anisotropy on the fatigue short crack initiation and propagation behaviors in a DS material, in addition to the expected effects of slip system orientation with respect to the loading axis.
2 METHODOLOGY
2.1 Materials and tensile testing assessment
The DS superalloy CM247LC was provided by the General Electric Power Company, with the composition listed in Table 1. Subsequently, the block received a commercially proprietary heat treatment comprising a solution heat treatment at time steps of 1221°C, 1232°C, and 1246°C, respectively, followed by dual aging heat treatments at 1080°C and 870°C.25
| Cr | Co | Al | Ti | W | Mo | Ta | Hf | C | Zr | B | Ni |
|---|---|---|---|---|---|---|---|---|---|---|---|
| 8.25 | 9.23 | 5.31 | 0.75 | 9.50 | 0.51 | 3.20 | 1.46 | 0.75 | <0.02 | <0.02 | Bal |
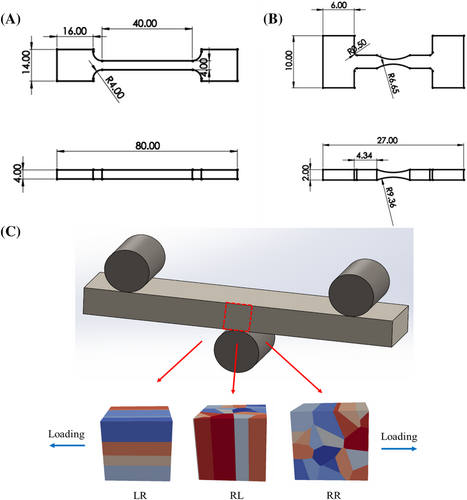
To obtain the Young's modulus and yield stress data for specimens with columnar grains aligned with and transverse to the loading direction, tensile tests were performed for the specimens shown in Figure 1A at a strain rate of 1 × 10⁻⁴ s−1. The sample with columnar grains aligned along the loading direction is termed as the longitudinal (L) sample, while the other with grains transverse to the loading direction is termed as transverse (T).
2.2 Tension–tension and three-point bending fatigue tests
Tension–tension fatigue tests were performed for dog-bone specimens with the geometry shown in Figure 1B, on an Instron ElectroPuls testing machine with a 20 Hz sine waveform and a load ratio of 0.1 at room temperature. The applied loads were chosen to produce a maximum nominal stress of 85% of yield stress of the L specimen at the narrowest cross-section of the gauge.
Three-point bending fatigue tests were carried out for plain bend bars (PBBs) with dimensions of 55 mm × 10 mm × 10 mm (as shown in Figure 1C). One roller was placed at the bottom center of the PPB, while the other two were respectively placed at the ends of top surface with 20 mm to the center line. Three types of specimens were evaluated: (1) termed as LR with columnar grains parallel to the loading direction and perpendicular to the normal direction of the PBB top surface, (2) termed as RL with columnar grains aligned perpendicular to the loading direction but parallel to the normal direction of the PBB top surface, and (3) termed as RR with columnar grains both perpendicular to the loading and normal directions of the PBB top surface. The schematic diagram in Figure 1C shows the relationship between the loading direction, grain elongation direction, and top surface normal direction for these three loading orientations. The tests were conducted using an Instron 8501 hydraulic testing machine with a 20 Hz sine waveform and a load ratio (R) of 0.1. The load was applied to produce a maximum total stress equal to 90% and 95% of the yield stress of the L tensile test specimen on the top central surface, calculated using simple elastic beam theory. To monitor the crack initiation and propagation behavior, replicas were firstly made at the top surface at intervals of every 5000 cycles until crack initiation, then at intervals of every 1000 cycles to observe the crack propagation. The crack initiation is defined as being when the crack length is over 20 μm. Beyond this observed crack length, the change in crack length with number of cycles is defined as crack propagation. In addition, to assess the cyclic response of the three different specimen orientations, a strain gauge EA-13-120LZ was placed at the center area of the top surfaces, for example, LR, RL, and RR specimens. Each specimen was cyclically loaded for 50 cycles at 95% of their yield stress at the top center surface with an R of 0.1, and then the load was increased to produce 105% of the yield stress for another 50 cycles. Finally, the load of the RL and RR specimens was increased to produce the maximum stress equal to 105% of LR-specimen yield stress for the last 50 cycles.
2.3 Post-test characterization
The replicas which record the crack initiation and early propagation behaviors were observed by optical microscopy (Olympus BH2 OM). A JEOL JSM 7200F field emission gun (FEG) SEM was employed for fractography and observation of the primary and secondary cracks on the top surface of tested PBBs (imaging parameters are shown in Table 2).
| Imaging mode | Acceleration voltage | Probe current | Imaging time | Working distance |
|---|---|---|---|---|
| SEI | 15 kV | 8 mA | 20 s | 9.9 mm |
Electron backscatter diffraction (EBSD) was also conducted on the top surface of the LR and RL specimens, at the vicinity of the primary crack to analyze the effects of local grain orientation and the localized strains. The top surface of the specimens were repolished using acidic alumina—OPAA suspension and OPUS noncrystallizing colloidal silica suspension, obtaining a smooth surface of 0.04 μm roughness. EBSD data were obtained using a JEOL JSM 7200F FEG SEM equipped with the Oxford Instrument C-NANO EBSD detector run with Aztec software. The microscope was operated at 20 keV and 15 nA with step size of 3 μm. A GB tolerance angle of 10° was employed to distinguish the neighboring grains. The indexing data were analyzed by the commercial software Aztec Crystal and Matlab-based open-source software MTEX.
3 RESULTS
3.1 Anisotropic mechanical response for DS CM247LC
Figure 2A clearly shows the differences in the stress–strain curve for the L and T specimens in the tensile test. The Young's modulus of the L specimen is 150 GPa, clearly lower than that of T specimen at 177 GPa, while the L yield stress is 932 MPa, higher than that of the T sample at 820 MPa. These results are consistent with Zhang et al.26 and Yang et al.27 who also found that in SX Ni base superalloys the [001] direction always exhibited lower Young's modulus but higher yield stress compared with other directions. The mechanical responses to cyclic loading under bend exhibited similar behavior to the monotonic loading under tension in the elastic regime for the LR, RR, and RL specimens in Figure 2B. The Young's modulus of the LR specimen (columnar grains aligned with the loading axis) is 138 GPa, lower than that of RR (187 GPa) and RL (175 GPa). It should be noted that although the columnar grains are both perpendicular to the loading direction, Young's moduli are somewhat different for the RR and RL specimens. These results indicate that the anisotropy of mechanical response for three-point bending is not only dependent on the relationship between columnar direction and loading direction but also is affected by the columnar direction with respect to the normal direction of the top surface.
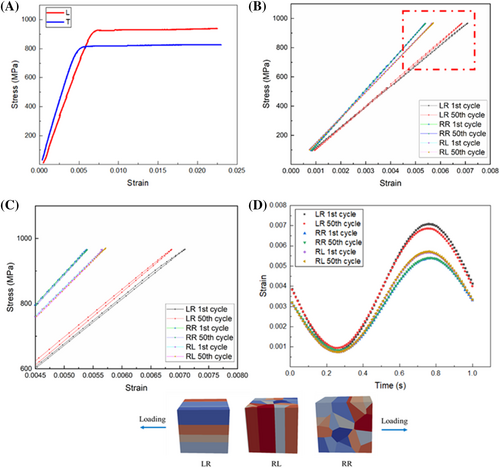
Figure 2C presents the elasto-plastic response of the three PBBs subjected to the different levels of cyclic loading, corresponding to the red rectangle in Figure 2B. The loading and unloading curves are distinct for the LR sample, showing that the specimen yields (as expected) when subjected to the cyclic loading at a maximum stress 105% of the expected yield stress. In addition, cyclic strain hardening was observed for the LR sample, as the maximum strain decreases from the 1st cycle to the last cycle (50th cycle). It is expected28 that the piling-up of dislocations will lead to strain hardening, and this also confirms plastic deformation is occurring in the LR specimen. However, plastic deformation does not seem to occur for the RR and RL samples, even though the maximum stress produced by the loading is expected to be 117% of the expected yield stress (i.e., the same applied maximum stress as the LR specimen). This is confirmed by the coincident loading and unloading curves in Figure 2C. In addition, the curves of strain variation against time in Figure 2D are identical for the first and last cycle, also indicating minimal plastic deformation for RL and RR specimens under bend loading. Therefore, the plastic deformation behaviors are quite different for T and RR (RL) specimens, when subjected to monotonic (uniaxial) tensile and cyclic bending (where a stress gradient is expected) loads, although the grains are all oriented perpendicular to the loading axis.
3.2 Comparison of the short fatigue crack growth behaviors
All the fatigue tests performed and corresponding lifetimes of the tested specimens are summarized in Table 3. The notional maximum strain measured from tensile tests (Figure 2A) and cyclic loading tests (Figure 2B,C) is plotted against cycles in Figure 3A. The large gap of notional maximum strain between L and T or LR and RR (RL) is mainly attributed to the anisotropy in Young's modulus (materials are not yielded according to Figure 2). The increase in notional maximum strain for L and LR specimens is more remarkable than T and RR (RL) specimens with the increase in applied maximum stress. Accordingly, the decrease in fatigue life of L and LR specimens are much more significant, compared with T and RR (RL) specimens. Particularly, when the notional maximum strain is increased to 0.0064 for LR specimen (corresponding to 95% of the L-specimen yield stress), the fatigue lifetime is lower than that of RR and RL specimens. As stated in the Section 1, the SX superalloy with (001) direction shows the longer fatigue life at low applied stress, and with the increase in the applied stress, the (111) direction exhibits a higher fatigue life. Current work is consistent with the research, though the material is DS system. To reveal the mechanism, following parts are focused on the crack initiation and propagation behaviors of the DS materials at an applied maximum stress of 95% of L-specimen measured yield stress.
| Maximum stress (loading mode of test) | L (LR) | T (RR, RL) |
|---|---|---|
| 792 MPa (tension–tension test) |
180,041 cycles (L) 152,611 cycles (L) |
75,896 cycles (T) 75,554 cycles (T) |
| 838 MPa (three-point bending test) |
101,352 cycles (LR) 70,432 cycles (LR) |
66,604 cycles (RL) 53,894 cycles (RL) |
| 885 MPa (three-point bending test) |
50,819 cycles (LR) 37,500 cycles (LR) |
77,125 cycles (RL) 78,540 cycles (RR) |
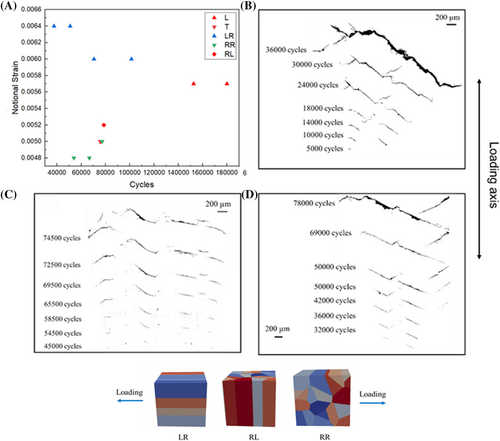
The primary short crack initiation and propagation behaviors of LR, RL, and RR specimens under the maximum stress of 95% L-specimen yield stress are compared in Figure 3B–D, recorded by replicas. For LR and RR specimens, the primary (main) cracks originate from two small cracks (termed sub-cracks). The two sub-cracks both initially grew straight with the angles close to 40° inclined to the loading direction (following the expected slip systems with maximum resolved shear). Some deflections occurred during the later crack propagation. Finally, the two sub-cracks coalesced to become a longer main crack and propagated until the final failure of the specimen occurred. Completely different crack propagation behaviors occurred in the RL specimen, where the main crack initiated from five different sites. These small sub-cracks propagated in different directions and did not coalesce to a long crack until close to the final failure stage, as recorded in Figure 3C. Therefore, the final failure is controlled more by the crack propagation of a single relatively “long” crack for LR and RR specimens, while lifetime was controlled more by the coalescence of several small cracks for the RL specimen. Although the total fatigue life in these tests is not obviously influenced by the grain elongation direction difference with respect to the normal direction of the top surface, in the RL and RR specimens, the propagation behavior is significantly affected.
Quantitative information on the crack initiation and propagation behaviors has also been obtained from the replicas. The variation on the sub-crack numbers as a function of number of cycles (Figure 4A) clearly shows that the LR sample has earlier crack initiation, compared with RL and RR samples. In addition, the much higher number of sub-cracks that evolve in the RL sample during the whole fatigue process confirms that the final failure is formed predominantly by crack coalescence rather than any substantial period of long crack propagation. The total cycles until the first crack initiation and number of cycles after the first crack initiation (i.e., when crack propagation is occurring) until the final failure are compared in Figure 4B. For the LR sample, the fatigue life is controlled by the crack propagation, as the cycles for crack initiation is only around one sixth of the crack propagation cycles. In comparison, the cycles needed for crack initiation and propagation are quite equivalent in the RL and RR samples. Strain amplitudes measured from the strain-gauge tests for these specimens (when they are subjected to the same applied maximum stress) are also compared in Figure 4B. The highest strain amplitude corresponds to the shortest crack initiation and propagation phases, as seen in the LR sample. With the decrease of strain amplitude, the relative number of cycles in crack propagation accordingly increases, which is consistent with the Coffin–Manson relationship. However, an unexpected drop in cycles to crack initiation was found comparing RL to RR specimens, even with the decrease of strain amplitudes. This is mainly attributed to the difference caused by the microstructural features, as the difference of strain amplitudes between the two types of specimens is quite small.
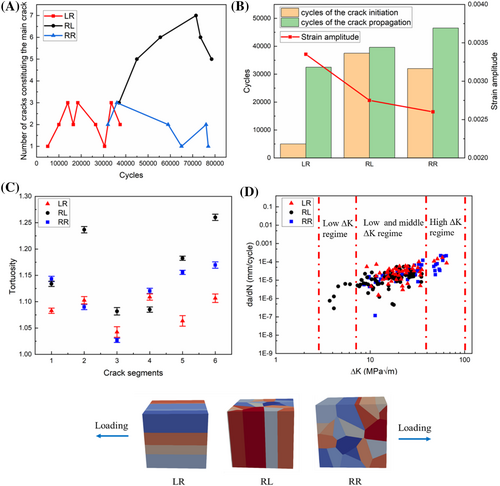
Further analysis of crack propagation behavior is presented in Figure 4C,D. The whole primary crack (which led to final failure) in these specimens has been considered by being divided into six segments, and then, the tortuosity of each segment is measured using the distance ratio.29 Most of the crack segments in the RL specimen are seen to be more tortuous than those in the LR and RR specimens, indicating greater deflection of cracks. However, the short crack growth rates do not show any noticeable difference between LR, RL, and RR specimens in the low and mid ΔK regimes (7 to 40 MPa√m) as marked in Figure 4D. At high ΔK regime (over 40 MPa√m), the crack growth rates of LR and RR samples are similar, while no crack growth data of the RL sample is recorded, due to the non-formation of a final long crack. At the very low ΔK regime (4 to 7 MPa√m), most of the crack growth data are from the RL specimen, attributed to the greater number of crack initiation sites resulting from more records being taken of the early stages of small crack growth.
3.3 Characterization of the crack initiation and propagation
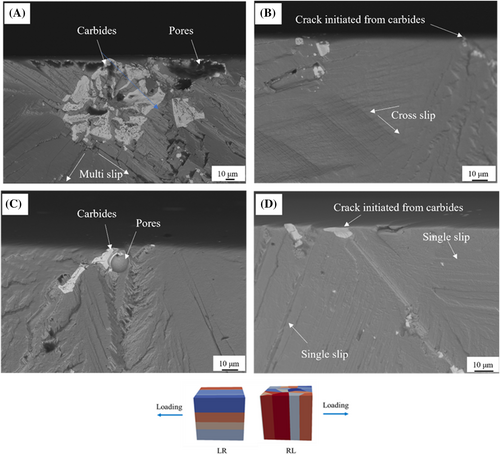
Previous research25 shows that the DS superalloy studied contains large amounts of carbides and pores co-segregated at the inter-dendritic regions. To clearly determine the interactions between these microstructure features and crack initiation behaviors, the fracture surface was carefully examined under SEM, using a Robinson-type backscatter detector (BED-C). Crack initiation sites (recorded by replicas) are mostly located at broken carbides and pores for both LR and RL specimens, presented in Figure 5A–D. Visible slip bands emanated from these microstructure features, indicating the crack growth following slip systems (i.e., slip-band crack growth). Nevertheless, multi-slip and even cross slip are activated in the vicinity of crack initiation sites in the LR specimen, while mostly single slip is found in the RL specimen. The results suggest a higher local strain at the crack initiation sites in the LR specimen, consistent with the higher strain amplitude experienced by the sample. The crack initiation sites of the RR specimen are similar to the RL specimen, as already reported in Tan et al.25
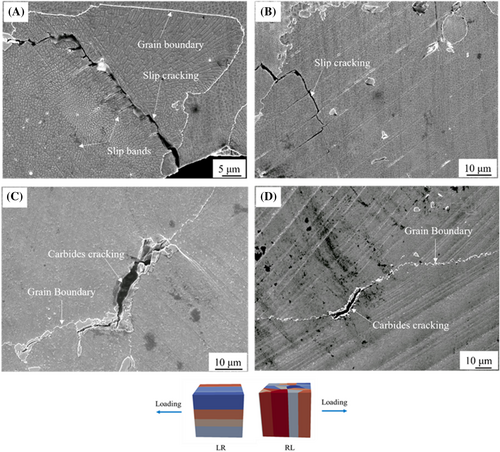
The secondary cracks on the top surfaces of the LR and RR specimens are compared in Figure 6. Transgranular slip-band cracking is largely observed in the vicinity of the main crack of the LR sample (Figure 6A,B), while more intergranular cracks are initiated from the large carbides at the GBs of the RL specimen. For the RR specimen,25 the secondary crack initiation behaviors are closely related to the plastic zone of the main crack. With the increase of the main crack length, the plastic zone of the crack tip is enlarged and the secondary crack initiation sites transfer from large carbides or pores to the slip bands. Therefore, the large amounts of slip-band cracks are potentially due to the larger plastic zone caused by the higher strain amplitude for LR specimen. One long primary crack is not formed during the fatigue life of the RL specimen, resulting in few slip-band cracks and more carbide initiated cracks. It is interesting that although cracks initiate from the large carbides at GBs, the following propagation is not along the GBs for the RL specimen. The same results were found in the RR specimen, attributed to the tiny chain-like carbides at GBs inhibiting crack propagation.
4 DISCUSSION
The current work aims to illustrate the effects of anisotropy on the fatigue behavior of a DS superalloy. According to previous research,30-33 the anisotropic effects are derived from two aspects, of which one is mechanical anisotropy, including Young's modulus33, 34 and yield stress,35, 36 and the other one is microstructural differences, like textures.37 The monotonic tensile tests (Figure 2A) and cyclic strain-gauge tests (Figure 2B,C) confirm that all the fatigue specimens are under bulk elastic strain, and hence, the anisotropic effects brought by gross yield stress differences are not considered here (although local slip-band processes will be operating).
4.1 The effects of Young's modulus on the fatigue life
is the Young's modulus, is the maximum applied stress, while is the minimum applied stress. The calculated is listed in Table 4. For specimens (L and LR) with lower Young's modulus, the resultant higher leads to a higher elastic energy accumulation for each fatigue cycle and finally results in a shorter fatigue life. With the further reduction of the maximum applied stress, the difference of is decreased from 0.49 to 0.26 MJ/m3 between LR (L) and RL (T). Hence, the effects of Young's modulus are minimized, and variation might not be the main factor controlling fatigue life at lower applied stress levels.
| Maximum stress | L (LR) | T (RR, RL) |
|---|---|---|
| 792 MPa | 1.69 MJ/m3 (L) | 1.43 MJ/m3 (T) |
| 838 MPa | 2.06 MJ/m3 (LR) | 1.52 MJ/m3 (RL) |
| 885 MPa | 2.29 MJ/m3 (LR) | 1.70 MJ/m3 (RL) |
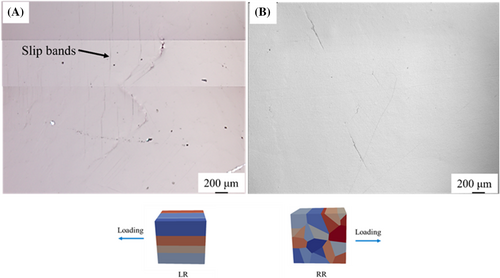
Although the effects of Young's modulus on the whole fatigue life can be understood for LR, RL and RR specimens by considering the PESED model, its specific influence on the crack initiation or propagation behaviors are not described or evaluated in the PESED approach. The replica record of crack growth behavior shows a strong correlation between the cycles to first crack initiation and the Young's modulus. The subsequent fracture surface characterizations do not show any significant differences in the main crack initiation process. Thus, the crack initiation is mainly influenced by Young's modulus rather than differing microstructures. Another strong evidence supporting the hypothesis is presented in Figure 7. It clearly shows the emergence of slip bands in the vicinity of the main crack at initial stage of fatigue (5000 cycles) for LR specimen, while few slip bands are observed in RR specimen even at 32,000 cycles. As the microstructural features such as carbides and pores (acting as crack initiation sites) are the same for the two specimens, the localized plastic strain indicated by the slip bands are most likely induced by the higher level of globally applied elastic strain.
CTOD is the crack tip opening displacement, which acts as the driving force for crack propagation; E is the Young's modulus; and σY is the initial yield stress. In this work, all the specimens are subjected to the same stress. Given that only the driving force for the same length of crack is considered, K would then be the same for LR, RR, and RL specimens. The ratio of CTOD of LR, RR, and RL are calculated to be 1.19:1:1.07. Based on this hypothesis, the driving force of crack propagation (at any given K level) for the LR specimen is the highest, which does correlate to the shortest crack propagation lifetime. However, the lowest driving force predicted for the RR specimen does not corresponded to the longest crack propagation lifetime. This might be caused by the different crack propagation behaviors, as many cracks propagated simultaneously for the RL specimen, accelerating the total failure process, with coalescence being an important contributor to early failure.
4.2 The effects of microstructural features on crack propagation behaviors
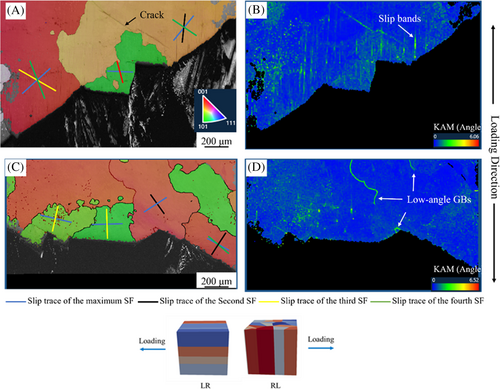
The results in Figures 3 and 4C show the difference of crack propagation behaviors between RL and LR (RR) specimens. Linking to the previous discussion, this should be attributed to the anisotropy of microstructures rather than the global mechanical property differences. To further understand the microstructure effects, EBSD mapping was performed on the regions of the top surface containing the crack initiation sites in Figure 8. The inverse-pole-figure (IPF, projected along the loading direction) colored map is overlayed with band contrast maps (Figure 8A,C) to show the interaction between the grain orientation and the main cracks. The slip traces which the cracks always propagate along are also drawn in the grains alongside the main crack. The study of Jiang et al.46 shows that the short fatigue cracks only grow along the slip traces of high SF at room temperature. Hence, only the slip traces with top four SFs are picked in Figure 8. The main cracks follow the slip traces of maximum SF for most of the grains in both LR and RL specimens, except in the grains containing crack coalescence. Apparently, the deflections occur when the crack encounters GBs, due to the misalignment of slip systems between neighboring grains for both LR and RL specimens.47 Kernel average misorientation (KAM) maps are performed on the same area, which could be used to analyze the localized strain48 in Figure 8B,D. The results are consistent with the records from the replicas that show large amounts of localized strain bands are emerging from the main crack for the LR specimen. In comparison, a few low-angle GBs are observed instead of strain bands in the RL specimen. These kinds of low-angle GBs are always formed at the end of columnar grains during directional solidification, due to the deviation in the growth of dendrites.49 Numbers of studies50, 51 have been carried out to study the effects of the low-angle GBs on the fatigue cracks. They report that the cracks preferentially initiate at high-angle GBs rather than low-angle ones, due to their effective impeding of dislocations slipping between neighboring grains. However, most of these studies are performed for LCF tests, where significant plastic deformation occurred in the initial stages of loading, which differs to the current work. Hansson and Melin52, 53 thought the low-angle GBs could also induce the piling-up of dislocations and hence cause the crack initiation. Therefore, for the RL specimen, the existence of many more low-angle GBs potentially may lead to crack initiation simultaneously at a few sites, which then subsequently grow along the slip trace with the maximum SF. In contrast, the main crack initiates and grows along the slip bands of the highest SF for the LR specimen.
refers to the normalized vector of intersection between the slip plane of one grain and the plane of the GBs. is another normalized vector of intersection between the slip plane of the neighboring grain and the plane of the GBs. M is the parameter to assess the misalignment. So the higher the M, the smaller the misalignment between the grains. For the more curved GBs, misalignment is more likely to be higher than at the straight GBs, causing higher strain localization. Therefore, cracks are initiated at several sites in the RL specimen. The formation of multiple short cracks shortens the crack propagation process (shown in Figure 4B). The crack propagation rate of the individual crack is slower in the RL specimen (shown in Figure 4D); therefore, the reduction in the cycles for crack propagation is attributed to the coalescence of the multiple short cracks. This result is also consistent with the findings in Schackert and Schweizer.55
5 CONCLUSION
- The specimens with columnar grains aligned with the loading direction exhibit higher fatigue lives than the specimens with transverse grains when subjected to the lower applied stress (85% of L-specimen yield stress). With an increase in applied stress, the fatigue lives of specimens with parallel grains decrease dramatically, failing at lower lifetimes than specimens with transverse grains.
- The shorter fatigue life of the LR specimen is attributed to the lower Young's modulus. Particularly, when the applied stress is increased to 95% of the yield stress, the higher associated global elastic strain will induce plastic localized strain more easily in the LR specimen, leading to earlier crack initiation at stress concentration features and faster crack propagation rates (when considering effective CTOD at similar K levels).
- Crack initiation behaviors are the same for these specimens, as they all initiated from microstructural features such as carbides and pores that act as stress concentration features.
- Crack propagation is mainly influenced by the microstructural orientations as it always follows the slip trace with the maximum SF. However, the low-angle or curved GBs in the RR specimen are inferred to provide more crack initiation sites, resulting in the final failure occurring by coalescence of several cracks (giving a shorter lifetime).
AUTHOR CONTRIBUTIONS
Yuanguo Tan: Writing—original draft; methodology; conceptualization; investigation. Sari Octaviani: Investigation. Nong Gao: Supervision; writing—review and edition. Philippa Reed: Supervision; funding acquisition; writing— review and editing; validation.
ACKNOWLEDGMENTS
The authors would like to thank the EPSRC (Grant EP/M000710/1) for funding support, the China Scholarship Council, China for financial support, and Dr. Gordon McColvin at GE Power for providing the materials.
Open Research
DATA AVAILABILITY STATEMENT
The data that support the findings of this study are available from the corresponding author upon reasonable request.


