A review on isothermal rotating bending fatigue failure: Microstructural and lifetime modeling of wrought and additive manufactured alloys
Abstract
The cumulative effect of many incidents that are brought about by an increase in temperature establishes an environment in which premature failure (including fatigue failure) becomes a challenging issue. Isothermal rotating bending fatigue (IT-RBF) testing may simulate industrial components' high temperatures and rotating environments. This state-of-the-art review paper covers the current research on IT-RBF failure in wrought and additive-manufactured alloys, focusing on microstructural and lifetime models. The article emphasizes the need of using microstructural information in fatigue life models to better represent complex material structure-failure behavior associations. Additive-manufactured alloys contain unique microstructural characteristics and processing-induced defects making fatigue modeling difficult. The paper concludes with implications for industrial fatigue-resistant alloy development. It emphasizes the necessity for a multidisciplinary approach that integrates materials science, mechanics, and data science to optimize these materials under cyclic loads. The review concludes by proposing future research and innovation in this subject.
Highlights
- Elevated-temperature RBF evaluates endurance and fatigue life for high-temp. applications.
- Cyclic loading induces crack formation and accelerated propagation at elevated temps.
- Surface, stress, and loading conditions are crucial in isothermal RBF crack initiation.
- Environmental and metallurgical phenomena influence high-temperature RBF failure.
- RBF at elevated temperatures aids modifying fatigue models for various applications.
1 INTRODUCTION
The development of fatigue data for materials and the validation of the structural integrity of new designs may be accomplished using fatigue testing, which is why fatigue test systems are intended to fulfill a wide range of criteria. Although the various fatigue test systems may have distinct outward appearances, the majority of them share functional components that are analogous to one another. These components include a dynamic load or force application mechanism, a control, and test monitoring or data acquisition unit, and so on.1, 2
The rotating bending fatigue (RBF) machine has been developed based on Euler and Bernoulli beam theories.3 According to this theory, we can apply a constant moment on the whole of the beam; therefore, this theory has been used for developing a test machine for investigating the elastic behavior of rotating components under cyclic load conditions. The rotating bending (RB) test is a unique form of fatigue test in which a circular cross-section specimen is exposed to an alternating bending force to assess bending fatigue strength. Due to the continual bending moment and rotation, the material's tensile and compressive stresses are permanently altered. During one rotation, each section of the shaft experiences tension once and compression a half revolution later.1, 4
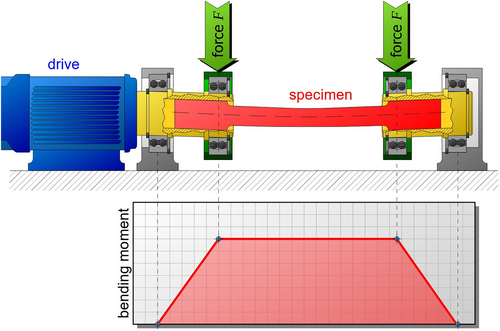
The initial model of the RBF testing system was developed by August Wohler in 1860 for investigating fatigue at room temperature (RT).5 It is unknown who developed the system for the elevated temperature testing; however, today it is possible to run tests under a non-ambient temperature with furnace-equipped machines. A schematic of the RB testing machine, also known as the four-point loading or R.R. Moore testing apparatus, is depicted in Figure 1. In this figure, two equal and simultaneous loads are applied to the specimen as a moment. Since the perpendicular force in this machine converts to a constant moment across the specimen, the surface stress will be at its highest over the entire specimen.6 With this capability, we can study a variety of rotating industrial components, many of which operate well in high-temperature environments, like wind turbine gearboxes, turbine blades, crankshafts, and mixer shafts. The closest simulation between the laboratory and industrial scales of rotary components is one of RB's most significant capabilities. This method is one of the best for studying crack behavior and surface-dependent phenomena like fretting7 and contact stress fatigue8 because the specimen's surface experienced the greatest amount of stress. Recognizing thermal and mechanical properties is fundamental to this method, which will be reviewed in this article.
Under normal operating conditions, the lifetime of a component could not be constrained by its strength as the major design parameter. Instead, the lifetime might be constrained by a variety of damage mechanisms, such as fatigue, creep, or oxidation, which might operate indecently when combined.9, 10 The majority of technical components, such as car engines, parts of aviation engines, and components of power plants, operate under conditions of mechanical fatigue at high temperatures.11, 12 Material fatigue responses can be categorized into three groups based on how temperature affects them: temperature-dependent deformation, temperature-dependent changes in microstructure, and temperature-dependent environmental effects.11, 13, 14 It is difficult to predict the life of a material when it is exposed to high temperatures because, as the temperature rises, many thermal effects, such as creep, oxidation, and metallurgical variations, will cause considerable influences on fatigue failure.15, 16 As a result, fatigue can be thought of as a combination of thermal and mechanical processes when it occurs in a non-ambient temperature environment.17 Thermomechanical fatigue (TMF) loadings, when applied to components in a particular temperature range with a changeable state of stress (tensile and/or compression), cause a localized concentration of plastic strains that ultimately lead to the initiation and propagation of cracks.18, 19
Because temperature directly affects both the yield stress and the elastic modulus of materials, it has an indirect impact on the fatigue strength of the material (both yield stress and elastic modulus decrease with an increase in temperature). In addition, an increase in temperature enhances the cyclic plasticity at the crack tip.21 The increased thermal energy at higher temperatures facilitates the activation of dislocations. Thermal activation allows dislocations to overcome energy barriers and move more readily within the material, making it easier for fatigue cracks to initiate and propagate. Finally, yet importantly, an increase in temperature under fatigue loading might induce cyclic softening to occur. The primary causes of this are grain growth and the dissolution of strengthening precipitates in the matrix, both of which lead to a decrease in the material's toughness.11, 19 The significance of examining fatigue at high temperatures and how it relates to other metallurgical phenomena are brought into focus by the repercussions that have been explored so far.
The study of fatigue in conventionally produced materials has advanced well, but it is becoming more prevalent in additively manufactured (AM'd) materials as approaches for additive manufacturing (AM) advance in industrial applications. It is now vital to look into the fatigue properties of this material, particularly at high temperatures, because of the increasing use of AM'd materials in the industry. As a result, it is crucial to classify fatigue behavior according to temperature and use a simpler yet more efficient method of investigation when determining the effect of temperature on the fatigue behavior of this material. Rarely have investigations been conducted on the fatigue properties of AM'd alloys at elevated temperatures employing the RBF testing method. Many industrial parts operate in high-temperature, rotating conditions, such as turbine blades, aircraft engines, gear and bearing components, and automobile components. Consequently, fatigue analysis of rotating components at high-temperature conditions would be of paramount importance to the industry, particularly for AM'd materials, which are expanding quickly across the board. Fatigue damage in industrial settings can potentially result in large financial losses, both directly and indirectly. We may find multiple examples of monetary losses that were caused by fatigue in a variety of industries, ranging from traditional ones like steel alloys and the production of metals to high-tech ones like the aeronautical industry and power plants.17, 22 In high-technology fields such as aerospace, aeronautics, power plants, and so on, we have a greater awareness of the situation. As a result, the effects of fatigue are frequently a hidden factor in industrial damages; thus, fatigue is a powerful phenomenon that must be thoroughly investigated before major financial losses occur.
- Thermal fatigue (TF): In this case, the component is only under the heat wave condition, without mechanical load. Usually, incoherent heating causes this kind of fatigue.
- Isothermal fatigue (ITF): It is a special case of thermo-mechanical fatigue. In this kind of fatigue, we have a mechanical load and a heating wave with a constant temperature.
- Thermomechanical fatigue (TMF): In this case, both heat waves and mechanical waves can apply to the component in phase and out of phase.
2 FATIGUE LIFE MODELS
Numerous publications are available on the fatigue life prediction method, which utilizes a wide variety of statistical, mechanical, and metallurgical approaches to describe the behavior of metals in their fatigue lives.17, 24, 25 The most prevalent high-temperature approaches, notably those employed in RBF testing, have been extracted from related publications and are provided here in a condensed manner. In this article, three models of fatigue life prediction methods that are more commonly used in ITF investigations have been presented. Additionally, some new concepts and certain postulates for future research have been stated here.
2.1 Basquin and Chaboche equation in high temperature
The Basquin equation (Equation 1) was utilized for the fatigue life prediction in most of the ITF test papers. This equation is not only straightforward but also provides a significant fit with the majority of fatigue research. Liu et al.28, 29 demonstrated that the Basquin equation is well-fitted by the steel-alloy fatigue data in the ITF test. Similar findings have been reported by Wiriyasaroj et al.30, 31 about steel, as well as on Ni-alloys,32 Ti-Al alloys,33 and copper alloys.34
The Basquin equation was established for RT based on statistical data and the behavior of fatigue in all metals; nevertheless, the applicability of this equation at high temperatures is debatable. Even if the Basquin equation can be used to predict the behavior of fatigue with rising temperatures, it is still necessary to conduct fatigue tests in high temperatures. The main question is whether it is possible to modify the Basquin equation by including a temperature dependence coefficient. This is one of the primary issues that it faces, and it is precisely the fact that if the Basquin equation can be developed based on some static mechanical test data in high temperatures, then it may be possible to estimate fatigue strength in elevated temperatures based on RT data.
In terms of metal behavior at high temperatures, it appears that a modifier coefficient as a representative of changes in microstructure and properties would modify the fatigue life prediction models at high temperatures. The Chaboche model (Equation 2)35, 36 is regarded as being among the most effective models since it takes into account a conservative coefficient for the Basquin equation. In this particular model, the fatigue behavior of the material has been modeled as a kind of ultimate tensile strength (UTS) factor by considering how it behaves in low-cycle and high-cycle regimes.
In Equations 1 and 3, under the conditions of a fully reversed fatigue test (R = −1), the maximum stress and amplitude will be the same. As a result, the Basquin equation (Equation 1) and the Chaboche equation (Equation 3) will be a coefficient of each other. As a consequence of this, the term of can be regarded as a modifier of the Basquin equation in the RBF test. For the Chaboche model to provide an accurate estimation of fatigue in high temperatures, it requires UTS data to be conducted at high temperatures. It would appear that the Chaboche model provides a more accurate estimation in elevated temperatures because it uses at least one factor as a reflection of the temperature effect on the fatigue test.
2.2 Murakami's model
MPa, HV: Kg.f/mm2
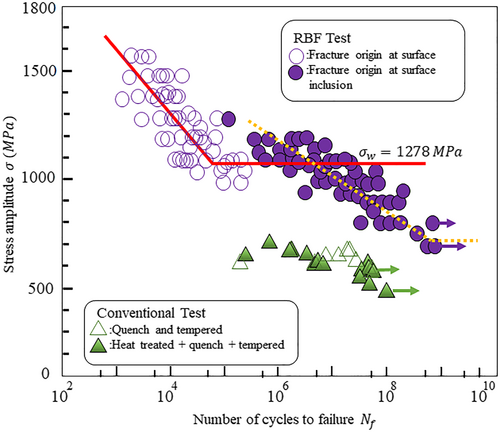
The modified equation of Murakami demonstrates that the fatigue limit is dependent on two significant factors. The first of these is the surface quality, which correlates with the material's mechanical properties, which can be represented as hardness. The second of these is the surface and interior defects of the material, which have the potential to play the primary role of stress concentration sites.38 Accordingly, in Murakami's model, as the size of the defect increases, the fatigue limit will decrease, or, in other words, the fatigue strength will decrease. This is something that would happen due to the rise in the stress intensity factor around the defects. The S-N curve of SAE 52100 bearing steel, which was researched by Murakami,38, 39 can be seen in Figure 2. Using this diagram as a reference, the fatigue life increased when the stress amplitude was decreased until it was close to the fatigue limit of hollow circles (fractured specimen via the origin of the surface). However, in the end, crack initiation and propagation occurred from surface inclusions. Recently, several researchers have applied Murakami's model to different alloys.40 For instance, Masuo et al. have demonstrated that Murakami's model can be used for titanium alloys with an estimation precision of more than 90% for fatigue limit.41
Substituting the y value obtained here in Equation 11 for Equation 9, is estimated, and this value is used as in Equation 5.
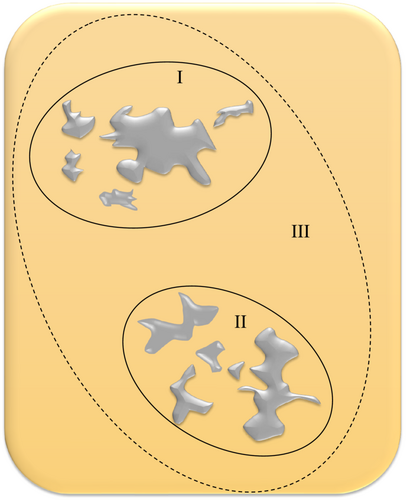
The approach developed by Murakami contains a weakness that manifests itself whenever the distribution of inclusions is relatively near to one another. In the study that Tajiri et al.43 conducted, the author improved the Murakami model by enhancing the computation of the effective magnitude of defects in the material. They demonstrated that when the distance between defects I and II is less than the of either I or II, the algorithm developed by Murakami treats both of the defects as a single defect III. They updated the “ estimation” and considered defect and defect to be independent defects for crack initiation when the distance between defect a and defect in area and was greater than the of one of the areas (Figure 3).
The Murakami model is a powerful tool for calculating the fatigue limit at RT, yet it suffers from two significant weaknesses. First, the Murakami model only takes into account the physical properties of inclusions without paying any regard to the type of defect. Second, it is modeled for the RT cases and not necessarily the non-ambient temperature conditions. In the most recent study on carburized 316L austenite stainless steel done by Liu et al.,28 the researchers reported that crack initiation begins from oxide inclusion while there are also carbides. As a result, it could be postulated that Murakami's model does not consider inclusion properties such as strength, brittleness, and coherence. With these two causes in mind, Murakami's model can be considered for developing at high temperatures with consideration of inclusion qualities as a modifier coefficient.
H (D, T): Hardness function of temperature and grain size in high temperature.
K: empirical constant of maximum defect toughness in Murakami's model.
: effect of defect type.
A: constant of the equation.
3 RBF OF AM'D MATERIALS
In the last century, a great deal of study has been conducted on a variety of topics, including fatigue properties at high temperatures. However, the development of the AM process as a new form of production has increased concerns over the mechanical properties of the finished product. As a result, the investigation into the properties of AM'd materials ought to become more comprehensive as the field of AM'd materials expands. AM processes and products have gained popularity recently because the materials are immediately produced in the shape of mechanical components by AM with no additional procedures.22, 48 Furthermore, AM can generate complicated structures that are impossible to create using traditional manufacturing techniques.49 However, using AM materials to create mechanical components has a serious disadvantage. Defects like porosity that result from the manufacturing process are an issue with AM materials and considerably affect fatigue behavior.50
The primary question that needs to be answered is whether or not it is feasible to conduct a traditional fatigue theory on wrought material using AM'd material. We need to have a comprehensive understanding of AM and fatigue behavior to answer this question. At RT, many fatigue life prediction methods have been developed51, 52 because the mechanical properties of materials remain constant and crack behavior can be studied as a physical feature of that. Fatigue investigation in high temperatures is not very simple due to a combination of microstructure changes and creep phenomena. This makes fatigue investigations at high temperatures quite difficult. Although various prediction models, such as Basquin and Murakami's models, have been established at high temperatures, these models do not take into account how temperature influences fatigue behavior. These models concentrated on the physical data of the experimental results without considering any aspect of temperature, changes in microstructure, creep, or anything else of the sort.
A great number of mechanical and metallurgical parameters are involved in the behavior of the fatigue fracture surface and cracks. The majority of cracks that appear during RBF emanate from the surface.17 However, there are situations in which crack initiation can take place from beneath the surface of the material. This could happen when there are inclusions close to the surface or any form of residual tension stress beneath the surface. The surface and interior of AM'd materials include a lot of inclusions and defects; therefore, these materials are particularly sensitive to the initiation and propagation of cracks. The existing methods inevitably result in the production of defects in the materials used for AM due to the presence of unmelted powders and gas that is used in the production of powders.53, 54 It is well-known that defects in the material can harm the mechanical properties, most notably the fatigue strength. The effect of surface quality, defects, and metallurgical characteristics in high temperatures on the fatigue behavior of materials, particularly AM'd ones, is discussed in this section.
Since the majority of fatigue tests on the AM'd materials have been conducted using a uniaxial pull-push test configuration, the existing uniaxial fatigue data could be converted to RBF provided that one can establish a correlation between RBF and uniaxial fatigue tests. For this ultimate objective, the fundamentals of the RBF test and the stress gradient difference between the RBF and uniaxial fatigue tests must be thoroughly investigated. The purpose of this paper is to review the IT-RBF microstructural and empirical S-N data behavior of AM'd metals; however, some fundamentals of the stress gradient effect will also be examined. As depicted in Figure 4 in this response letter, the normal stress owing to axial loading is distributed uniformly across the cross-sectional area of the gage; in contrast, the stress gradient is present in the RBF specimen starting from a maximum at the surface to zero in the neutral axis.17, 55
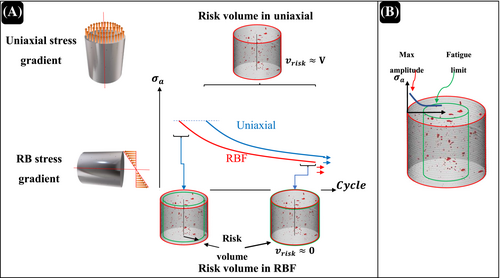
Since there are few published research in RBF of AM'd materials at high temperatures, we present our overview on how AM'd metals would behave in RBF at non-ambient temperature conditions by discussing the fatigue behavior of AM'd materials in RT and some fundamental metallurgical features of wrought materials in high temperature.
3.1 S-N data behavior
Direct comparisons between the fatigue data of AM'd and conventional materials as reported in the literature are challenging54 because of variations in post-manufacturing processes, material feedstock, different internal and surface defects, and so on. However, some fatigue data related to AM'd materials, such as Ti-6Al-4V,40, 41 316L stainless steel,55 Inconel 718,62 and Al-alloy,63 at room and elevated temperatures have been shown in Figure 5. As seen in this figure, compared to the similar wrought material form, AM'd materials have significantly shorter fatigue lifetimes and lower HCF strengths. Slip bands and microstructural weak areas, such as grain boundaries and microstructural defects, frequently cooperate to cause local plastic deformation in materials under cyclic loading. Surface voids make it easier for a crack to start at a lower number of fatigue cycles by concentrating stress. Location, shape, and size of porosities are the main reasons why HCF data for AM'd materials are more scattered. The failure mechanism of AM'd materials is more affected by void location as opposed to its shape or size, as crack initiation sites are observed to be closer to the specimens' surface.63, 64
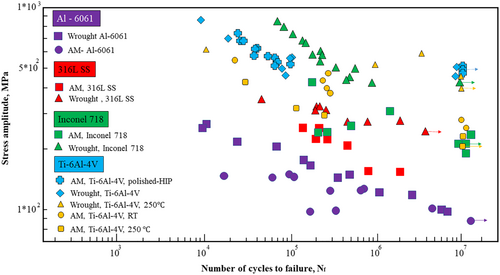
The micro-notches (any kind of defect) at the surface were determined to be the origin of all fatigue cracks in the RBF, which is typical for AM'd materials without any post-processing machining. Due to a stress reduction (i.e., a stress gradient in the RB test specimen from surface to center) when fractures expand away from the surface, cracks in specimens under RB loading do not spread as quickly once they begin at the surface, providing superior fatigue performance at greater stress amplitudes than the axial specimens. It is also crucial to note that the specimens may undergo significant plastic deformation at larger stress amplitudes because of the considerable ductility that they have by nature (e.g., 316L SS).55 Therefore, the stress may be mostly uniform in the vicinity of the surface; however, as cracks propagate away from the surface, the nominal stress is expected to be gradually reduced.
Shrestha et al.55 have stated that the stress is not evenly distributed throughout the specimen subjected to RBT, surface roughness and the distribution of volumetric defects in AM parts may have a significant impact on stress intensity factor and how well AM parts withstand fatigue. In other words, the effect of stress gradient and surface roughness in correlation with surface metallurgical defects in IT-RBF of AM'd steel alloys were not comprehensively studied.67 A recent IT-RBF investigation on carburized 316L SS by Liu et al.28 revealed that fatigue behavior was highly dependent on changes in surface characteristics caused by temperature increases. Microstructural changes in high-temperature conditions would be correlated with the porosities and surface inclusions of AM'd materials, just like they would be with other alloys. Therefore, a competitive crack initiation process could result from the interaction of high temperature-affected phenomena with the surface characteristics of the material under stress gradient in RBF. According to Shrestha et al.55 and Liu et al.'s28, 29 research on AM'd and wrought 316L SS, surface defects and roughness at ambient temperature as well as changes in surface quality at high temperatures might be regarded as the primary causes of the lesser fatigue strength in AM'd specimens compared to wrought ones.
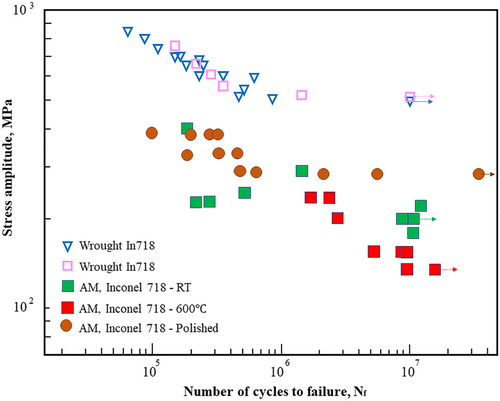
It has been demonstrated by Balasubramanian et al.32 that the fatigue properties of AM'd Inconel 718 are lower than those of wrought ones, but after post-processing, the fatigue behavior became a little closer to wrought ones. The comparison diagram of the various types of manufactured Inconel 718 has been shown in Figure 6. Nickel alloys, just like titanium alloys, revealed their fatigue limits when subjected to high temperatures. There is a good chance this phenomenon is connected to the phase and its rafting, which can affect the persistence of slipping bands and twining in certain alloys.68, 69 The fatigue limit in AM'd Inconel 718 was published by Radhakrishnan et al.62 in the RBF test, and Nezhadfar et al.70 reported results that were comparable to those in the conventional fatigue test. During the aging treatment of the Ni-based superalloy at temperatures between 850°C and 950°C in wrought material, Yu et al.71 found that the segregation of carbon, chromium, and molybdenum at the grain boundaries promoted the development of M23C6 carbides. The element has a poor diffusion rate when the alloy is aged at 850°C, and the carbide particles tend to congregate and form chains during this process. The presence of carbide chains not only breaks the continuity of the matrix structure of the alloy but also causes a high number of dislocations to pile up during the process of local plasticity of the alloy. The carbide chains prevent the matrix structure from moving freely. The accumulation of severe dislocations can cause an excessive stress concentration around the carbide chains, which in turn encourages the initiation and spread of microcracks, which ultimately fail the alloy. Radhakirishnan et al.62 evaluated the fatigue behavior of AM'd Inconel 718 in the RBF test, but they did not verify the effect of carbides on the microstructure. Because of the greater possibility of precipitation at high temperatures, it is fair to expect that the impact of carbides will be visible in AM'd materials, just as it is in wrought materials.
Due to the existence of inclusions and porosities in the AM'd material throughout the specimen, particularly on the surface, most cracks in RBF tests start at these locations. Inclusions and porosities on the surface where the largest stress amplitude in the RBF test was experienced would result in stress intensity and crack initiation. Some voids in grain boundaries may emerge at high temperatures because of microstructural changes, and these locations may serve as crack initiation sites, particularly if they are close to the surface.
3.1.1 Crack modeling
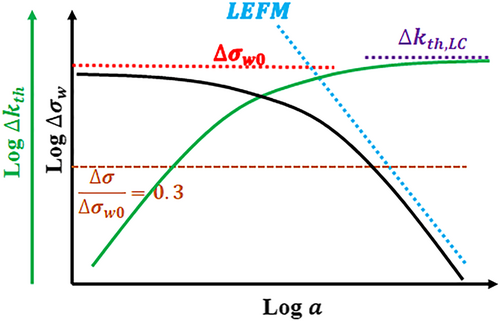
The advantage of these formulations is that they describe the smooth transition between short cracks long cracks, which corresponds to for 78
Titanium alloys
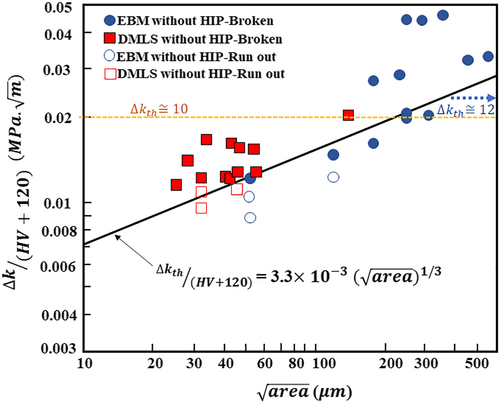
As briefly mentioned in Sections 1 and 2, the parameter model can be used to evaluate how a small defect affects the fatigue limit.39 According to a study by Murakami, the parameter model can be used to forecast the fatigue limit for machined specimens with artificial surface roughness. The maximum height values in that literature ranged from 20.5 to 74 μm while in some other papers, it could be bigger than the mentioned range. For instance, in a study by Nakatani et al.79 on the AM'd Ti-6Al-4V, the maximum amount reported by area measurement is 88 μm. As a result, it is important to confirm the application range of the “ parameter model.” Some writers41 explored the relationship between and as depicted in Figure 8 and conducted fatigue tests on specimens without HIP that were made by EBM and DMLS following Nakatani's work.79 A crack with any shape was given a value, which was determined using Equation 15. Here, is the stress range (MPa), and is the square root of the projection area of the defect observed at the crack initiation site ( ). As a result, the threshold could be computed using the defect model; in Figure 8, Masuo et al.41 have published the threshold of Ti-6Al-4V AM'd alloy depending on defect size.
The fatigue strength of the AM'd Ti-6Al-4V was lower than the CM'd Ti-6Al-4V at both RT and ET, according to the difference in materials at each temperature, as shown in Figure 5. But at ET, the difference between the AM'd Ti-6Al-4V and the CM'd Ti-6Al-4V was a little less significant than it was at RT. Focusing on the impact of temperature on the same material, both showed a decrease in the fatigue limit from RT to ET; however, the AM'd Ti-6Al-4V decrease was less significant than the CM'd one. For AM'd Ti-6Al-4V, the ratio of the change to the RT fatigue limit (300 MPa) was 17%, and the difference between the RT and ET fatigue limits was 50 MPa (=300–250 MPa). The difference for the CM'd material was 150 MPa (=625–475 MPa), with a 24% ratio to the fatigue limit at RT (625 MPa). This shows that the CM'd Ti-6Al-4V fatigue properties were somewhat sensitive to temperature, but the AM'd ones were rather insensitive to temperature. The mechanism of the fatigue failure in the AM'd Ti-6Al-4V is attributed to this. The defect is the primary component of the AM'd materials. The increase in ductility of the material, which is often shown by the decrease in hardness, causes the stress concentration sensitivity to be less sensitive at ET.50
The low fatigue strength of the AM'd Ti-6Al-4V is attributed to the initial defects that are unavoidably created during the AM process based on the results of the fatigue tests and the inspection of the fracture surface. Murakami proposed Equation 5, which is empirically demonstrated to correspond well with experimental results, taking into account the aforementioned and determining constant coefficients in the equation to fit the experimental results. The applicability of Equation 5 at both RT and ET was reported in the limited papers. Hardness (HV) and the largest defect size inside the sample's risk volume ( are the two quantities needed for Equation 5. Using the extreme value statistics from Murakami's study, it is possible to calculate the .
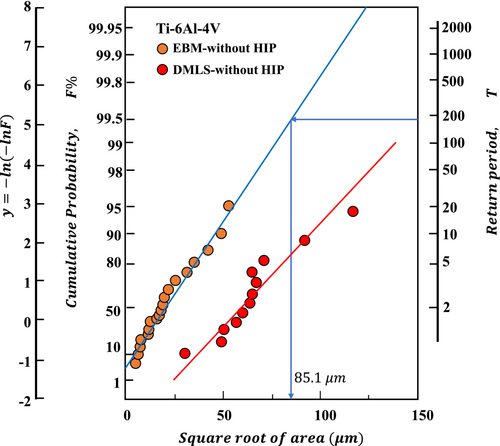
Based on the S-N data (Figure 5) of AM'd Ti-6Al-4V in the IT-RBF test by Kakiuchi et al.50 and Masuo et al.,41 Figure 9 depicts the estimation for the using the extreme value statistics mentioned in Section 1 and 2. The greatest defect size in the AM'd Ti-6Al-4V fatigue specimen was calculated from this method to be 85.1 μm. Using hardness at each temperature and the area obtained as shown in Figure 9, Equation 5 projected fatigue limits at both ET and RT. The outcomes of the anticipated fatigue limit values are displayed in Table 1. The ratio of the difference to the experimental value was 7%, and there was a discrepancy of 21 MPa between the anticipated value and the experimental value. Similarly, for the predicted and estimated ET fatigue limits, the ratio of the difference to the experimental value was 2%, and there was a 6-MPa difference between the anticipated value and the observed value. The error ratio was under 10% at both temperatures, and the predicted and experimental fatigue limits closely matched each other. This demonstrates unequivocally that Murakami's Equation 5 applies to both the fatigue limit prediction at RT and ET if hardness is evaluated at the same temperature.
| Item | RT | ET |
|---|---|---|
| Vickers hardness | 351 | 256 |
| Experimental fatigue limit | 300 MPa | 250 MPa |
| Predicted fatigue limit | 321 MPa | 256 MPa |
In the extensive work that Beretta and Romano81 have done about Kitagawa diagrams, the fatigue limit for wrought and AM'd Ti-6Al-4V based on the size of defects has been determined. Even though the studies that were used did not focus on high-temperature RBF, they do provide a good viewpoint on the trend of material fatigue limits based on the size of defects. Unfortunately, there are relatively few resources for AM'd metals in IT-RBF. As a result, by referring to the work published by Beretta and Romano,81 it is possible to forecast that the behavior of AM'd metals in high temperatures will follow the same pattern.
The Kitagawa diagram can explain the significant amount of scatter that is present across the various fatigue datasets and provides a very excellent overview of the trend in the fatigue parameters concerning the defect size for both materials (as seen in Figure 10). In addition, the outcomes of the AM procedures are extremely comparable to those of conventional manufacturing techniques (such as casting and forging), and in certain cases, they are even superior.
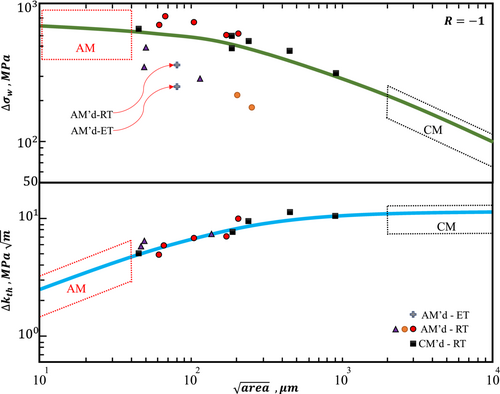
When applying the El-Haddad formulation, which was presented in Equations 19 and 20, and taking into account a microstructural length of roughly 200 μm for Ti-6Al-4V, it is possible to provide an accurate description of the mean trend of the diagram. The few pieces of data that can be found in the scientific literature on the size below which the defects are considered to be harmless82 are in agreement with the Kitagawa diagrams that can be found in Figure 10.
About Murakami's model (Equation 15), Figure 10 illustrates the range of defect sizes across which a slope of 1:3 best characterizes the behavior. In the case of Ti-6Al-4V, the range for this is between 80- and 600- area. It is important to note that the scatter along the the diagram is less than along the diagram as a direct result of the accurate calculation of the SIF using Equation 15 for the various data points. The strong influence that defects have on AM parts is supported by other data found in the scholarly literature.
Nickel alloys
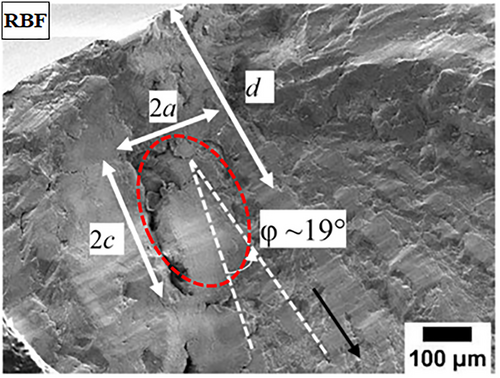
Radhakrishnan et al.62 recently researched the behavior of AM'd Inconel 718 in IT-RBF. Figure 11A is a representative image that was obtained by X-ray micro-computed tomography (XRMCT) that shows the porosity distribution in three dimensions in the bulk material. The size distribution of the pores is depicted in Figure 11B, along with their respective aspect ratios ( ). An aspect ratio is defined as the ratio of the smallest ellipsoid diameter (2a) to the largest ellipsoid diameter (2c). The majority of the pores have (2c) that varies between 8.1 and 80 with ( ) range of 0.7–0.9. The presence of an irregular morphology leading to a value of ( ) less than 0.5 in pores that are larger than 80 is evidence that the pores are lack of fusion (LOF). In Figure 11A,B, the pores that have (2c) that are greater than 100 are anticipated to be important for fatigue life are highlighted.
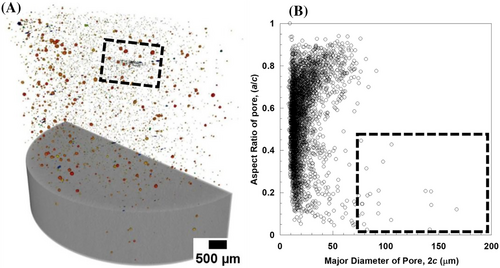
Figure 5 shows the stress amplitude ( ) versus number of cycles to failure ( ) plots for the results of the HCF tests performed at RT and ET. At RT, equals 325 MPa, or roughly one-third of (UTS strength), Solberg et al.85 reported for runout cycles in unnotched conditions. Similar to this, Wan et al.86 linked a low MPa to the existence of large, localized pores created during the LB-PBF process. However, utilizing ultra-high frequency (1 kHz) resonance-based fatigue testing, Yang et al.87 reported substantially higher MPa. The achieved in the work by Rahakrishnan et al.62 and those previously published are significantly lower than 480 MPa, which may be due to the fact that metals' can be increased by fatigue loading at extremely high frequencies, especially if tests are conducted in an oxidizing atmosphere.62 The S-N curve shown in Figure 6 reveals that at ET is approximately 250 MPa. For comparison, there is only one reported experimental data on the of AM Inconel 718 at high temperatures (about 600°C).88 in Figure 6 is only 30 MPa lower than σf of peak-aged DED Inconel 718 specimens that has been reported by Yu et al.88 Using ultrasonic resonance-based fatigue testing (20 kHz) at 650°C, of 450 MPa was found for the peak-aged LB-PBF Inconel 718 specimens. In the study by Radhakrishnan et al.,62 the observed decrease in at ET relative to RT coincides with the decrease in ; therefore, stays constant at 0.29. A lower strain hardening exponent (n = 0.19 at RT as opposed to 0.15 at 600°C) may make the beginning of short fatigue cracks (SFCs) at high stress concentration sites like pores easier, even when (yield stress) does not decrease considerably at ET.
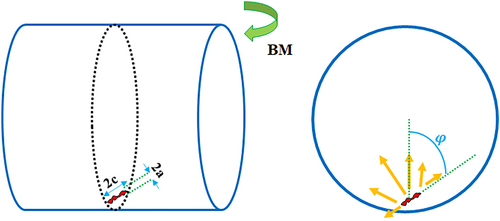
(as the driving force for crack growth) controls the propagation rate of fatigue cracks. The crack may be stopped by plasticity, roughness, oxidation-induced closure, or a combination of some or all of those mechanisms if is less than a critical threshold value, which is typically attained for a crack development rate ( ) of . This suggests that even in the stress-life strategy, where the components already have preexisting defects that make crack nucleation simple, the proximity of crack tip to might result in an extended fatigue life (such as the LOF pores in the alloy examined here). Figure 12 provides schematic representations of applied bending fatigue load concerning pores.
3.2 Effect of microstructure
3.2.1 Nickel alloys
It can be considered that the phenomena that occur in nickel-based alloys are comparable to those that occur in titanium and aluminum, even though nickel-based alloys have unique properties such as rafting, the carbide effect, and gamma phase behavior. Because chromium is particularly sensitive to the reaction with oxygen and carbon, the behavior of Inconel alloys as Ni-Cr-based alloys is very intriguing when they are heated to high temperatures. The structure of Inconel 718 is a face-centered cubic (FCC) solid solution of nickel combined with iron, chromium, and molybdenum. The precipitate phases that occur in Inconel 718 are denoted by the symbols γ′ and γ″, respectively. Fine-scale precipitates like γ′ and γ″ allow for high strengths to be maintained even at high temperatures. γ′ is a metastable phase with a body-centered tetragonal structure of Ni3Nb, whereas γ″ is an ordered FCC structure of Ni3(Al,Ti).91
The grain size of the superalloy is determined by the grain boundary precipitation phase. At high temperatures (1290–1830°C), the metastable γ″ phase transforms the γ′ phase, which results in the formation of thin plates that elongate into the stable phase of orthorhombic Ni3Nb. Precipitated at the grain boundary are boron, carbon, and zirconium, all of which have atomic radii that are significantly lower than that of nickel.49 In materials that contain many phases and allotropies, the fatigue behavior and, as a consequence, the S-N curve will look different at RT and higher temperatures depending on the history of the material's heat treatment.
The majority of the carbides found in Ni-based superalloys are MC carbides that are rich in titanium and molybdenum: M6C carbides that contain Ni, Co, Mo, and Cr, as well as M23C6 carbides that are rich in Cr. The eutectic MC carbides that are created during the casting solidification of the superalloys often have the shape of irregular blocks and have incoherent interfaces with the matrix.92 In addition, the MC carbides tend to break down at high temperatures (more than 800°C) as MC + γ → (M6C, M23C6) + γ′.
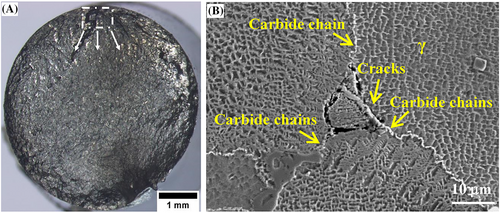
In most cases, the two carbides M6C and M23C6 will precipitate at the borders of the grains. Grain boundary carbides that have the right size and the right shape can effectively prevent the sliding of grain borders, which in turn helps to improve the strength of the alloys. However, continuous carbide chains have the potential to encourage the development and propagation of microcracks, which can ultimately result in an early failure of the alloys.
As can be seen in Figure 14A, the source of the crack was situated beneath the surface.62 The crack propagation resulted in the formation of a significant number of fatigue stria patterns. As illustrated in Figure 14, instantaneous fracture occurred when the crack propagation went beyond a particular extent. This was caused by a sharp increase in stress in some parts of the alloy, which led to the crack. It was found (Figure 14B) that the cracks in the alloy were most prevalent at the eutectic boundary and the trifurcate grain boundaries of the wrought alloy. In addition, it was discovered by Yu et al.71 that there was a significant quantity of carbide chains in the area surrounding the fractures in wrought materials, and we expect the same phenomenon in AM'd materials. This finding suggested that the continuous distribution of carbides along the grain boundaries played a role in the beginning and spread of the cracks.
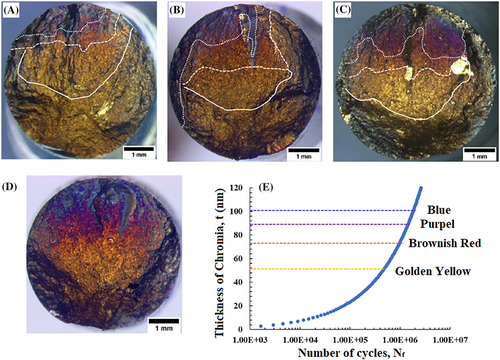
Even though Radhakrishnan et al.62 did not mention the presence of carbides in AM'd Inconel 718 IT-RBF, we anticipate precipitates to be present at the material's grain boundaries given the quick solidification process of AM. As a result, the main crack initiation sites in RBF would be these carbides and surface defects as well. It could be a good hypothesis to consider that in high-temperature RBF, the crack will initiate from inclusions and porosities, especially those that are surrounded by carbide chains (or at least connected to brittle carbides). Considering the stress gradient from the surface to the neutral center of the specimen in the RBF test, as well as the effect of porosities and inclusions in the crack initiation sites, these carbide chains in the surface might operate as localized brittleness points for dislocations to accumulate, which will accelerate crack initiation from inclusions and porosities at high temperatures.
Titanium alloys
It has been proven that even in heavily porous structures, in the RBF test, the fracture began from the surface or beneath the surface.96 This information can be found in the study that Horke et al.97 have conducted on the effect of sintering conditions on the fatigue behavior of titanium alloy. The fracture surfaces of both AM'd and wrought materials have been shown in Figure 16. In both cases, the crack starts near the surface because of surface inclusions and porosities. Similar results in the AM'd specimen have been found by Masuo et al.,41 and they refer to this figure and the fact that the porosities and inclusions in the surface (and beneath the surface) act as the fracture starting locations. They investigated two different kinds of AM'd Ti alloys using EBM and DMLS to study their fatigue behavior and found that surface inclusion is where cracks begin to form.
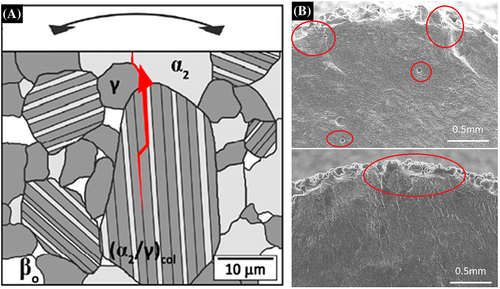
In the AM process, the process is not in an equilibrium situation; as a result, it has some residual phases, which were discussed earlier. This can be shown by referring to the Ti-Al phase diagram.99 Intermetallic phases such as Ti3Al, TiAl, and others would be produced at temperatures distinct from one another as the temperature rose and fell. In higher temperatures, it has more time and energy; therefore, the dissolved aluminum would have to precipitate on the border of the grain in phases with a large amount of Al to reduce its structural distortion energy. Also, Yang et al.12 demonstrated that as the temperature rose, the phase underwent recrystallization at the grain's boundary. This occurred because the border of the grain is the center of energy when the temperature is high, and all of the dissolved atoms attempt to immigrate there. Therefore, Al concentration would be different in two phases of the lamellar structure of colonies. As it has been stated previously, a difference in the structure parameters (coherency) could be a center of stress intensity as well as the site where cracks first start to form. Burtscher et al.98 demonstrated that the lamellar colonies are the site where the crack first begins, and the micro-crack would progress along the lamellar interface until it reached the eutectic grain boundary (Figure 17A), which is the interface between three distinct phases.
In a different study by Nakatani et al.79 and Kakiuchi et al.,50 they reported that in the RBF test of an AM'd titanium alloy (Ti-6Al-4V), crack initiation had been caused by surface defects (porosities beneath the surface and inclusions). Accordingly, from the perspective of AM, surface defects are the sites where cracks begin to form, whereas, from the perspective of wrought metals, some colonies and secondary phase boundaries may be initiation sites. Since there is competition and sometimes intensification of lamellar colonies microstructural crack initiation sites (Figure 17A) and porosities sites (Figure 17B), it is impossible to precisely categorize the crack mechanism in AM'd titanium alloys with colonies microstructure in high-temperature RBF tests. However, referring to the discussed reports, generally speaking, it would be a good assumption that in high-temperature RBF tests, the crack would initiate from the surface (or beneath the surface) from porosities and inclusions, especially those that have an interface with lamellar colony structures.
Similar results have been published by Wu et al.33 and could be seen in Figure 18A that shows that the crack initiation in the tensile mode (perpendicular to the crack mode) has been initiated from colonies and grain boundaries. A schematic of the structure that is identically comparable to the one reported by Yang et al.12 could be found in Figure 18B. The behavior of the micro-cracks and the growth of the cracks followed the theory that was presented.
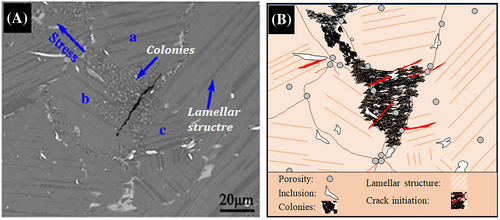
According to the schematic in Figure 18B, porosities and inclusions, particularly those that are located in the colony microstructure of eutectic points in the grain boundary, are more preferred sites for crack initiation in AM'd titanium alloys. The starting crack from preferred locations in the surface may spread in the interlamellar direction in transgranular mode, according to Burtscher et al.98 mechanisms for crack propagation in RBF tests of titanium alloys in wrought materials. Therefore, if the crack were to develop in a transgranular manner, a lamellar structure might be preferred. As a result, in AM'd titanium alloys, internal lamellar structures in grains would be crucial for crack propagation direction, while the involvement of colony microstructure would be crucial for crack initiation in the presence of surface inclusions and porosities.
Aluminum alloys
Crack initiation, crack propagation, and final fracture are the three regions that make up a fracture surface in aluminum alloys, just as they do in other kinds of materials. Although in most RBF papers the fatigue behavior is only investigated based on S-N curves and crack behavior based on fracture mechanics, here, it would be discussed a little more based on phase diagrams and allotropies during elevated temperatures. In Figure 19, a portion of the phase diagram for aluminum as well as other materials that are primary solutions has been displayed. Let us look at the 7075-T7351 aluminum alloy that Yang et al.100 researched and found to have a chemical composition (in wt.%) of 5.89 zinc, 2.48 magnesium, 1.59 copper, 0.22 chromium, 0.06 iron, 0.02 titanium, and the remaining weight in Al. Concerning Figure 19, the representation of our material in each diagram is represented by a green line. Following the AM process, the first solid nucleation will have the largest amount of Al since the cooling rate of the melt pool is high. Subsequently, as the solidification layer thickens, the percentage of impurities (soluble metals, Mg, Zn, etc.) will increase.
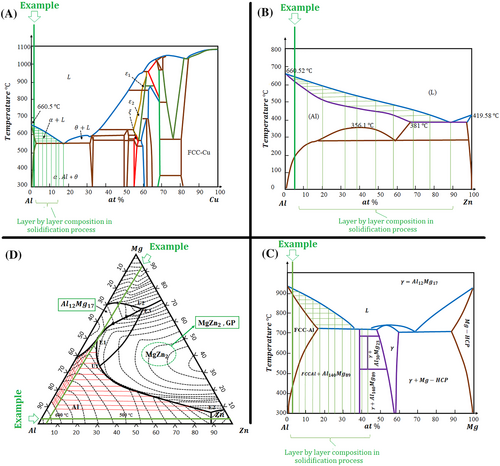
As a result, throughout the AM process, the melting point will always be a function of the solidification face, and after the process is complete, the microscopic structure will have a modest segregation and impurity profile.101-103 Assuming that the melt pool is in the melting zone at 680 and that rapid cooling has taken place, it could be predicted that the final thin layer of the solidified crust will have close to 10% copper (Figure 19A). The final thin layer probably will have close to 12% zinc, and the final thin layer will have close to 0.1% magnesium (Figure 19C if we neglect the interaction effect of the activity of these elements). These predictions are based on the assumptions that the melting zone is at 680°C and that rapid cooling has taken place. In light of the preceding, concerning the equilibrium phase diagram, it can be deduced that under conditions of non-equilibrium solidification (such as the AM process), the material structure will have the concentration variety of a solid solution. We make an approximation of the ultimate structure by referring to two different phase diagrams, but this is not a completely accurate method because the impurities influence one another's activities. Therefore, in the three-phase diagram shown in Figure 19D, the intersection of the green lines represents the alloy composition, and the intersection of the red lines represents the eutectics that follow thin layers in the solidification process. It would appear that the final structure will contain both intermetallic phases, such as AlMg4Zn11 and Al6Mg11Zn11, as well as precipitants containing Fe. In most cases, after homogenizing and performing any other kinds of heat treatment, it would be reheated and given some time to allow the composition to return to normal. Figure 20 is a schematic of the effect of solidification segregation and passing heat processing on final AM products. The fact that the specimen undergoing the RBF test at a high temperature will go through heat treatment once again is demonstrated in Figure 20.
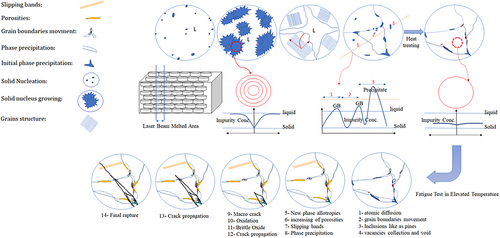
Referring to Figure 20, when the material is subjected to an IT-RBF test, it would heat up again and have time (for example, 106 cycles until fracture), so as a result of the presence of temperature and mechanical stress, atoms can migrate as well as the time and energy to do so. Because the solid solution has a profile concentration during the AM'd sample, the material will attempt to reject the saturated solid solutions impurities to lower the lattice distortion energy. As a result, depending on the phase diagram, the impurities will migrate to the grain boundaries as the temperature is raised. According to the phase diagram (D) in Figure 19, GP zones (MgZn2) can form in Al-7075 when the temperature in the RBF test is increased. The presence of these GP zones in the Al alloy has been associated with resistance against fatigue propagation as well as an improvement in the way fatigue behaves when exposed to high temperatures.104, 105
- Solidification and gas porosities, typical fatigue crack initiation features in cast alloys,114 play significant roles in defining the fatigue behavior of AM'd alloys at increased temperatures. Awd et al.115 demonstrated that increased porosity in Scalmalloy generated by DED techniques caused a 30% decrease in fatigue strength compared to LPBF-processed material. Moreover, modeling of fatigue by Haridas et al.116 in AM Al–Cu–Mg–Zr showed that the amount and size of porosity strongly influenced the fatigue life, with a distribution of larger irregular-shaped porosities decreasing component lifetime. AM-induced keyhole porosity, if present, could also create potential challenges for high-temperature alloys containing volatile Mg, Zn, and/or Mn, whose vaporizations are expected to increase the tendency for keyholing.113
- Inadequate solidification of metal powder can lead to the creation of agglomerates, which can become stress raisers that cause fatigue cracks.116
- When the common strain localizing features such as porosity is eliminated by post-processing treatments such as hot isostatic pressing, other microstructural defect precursors that form during cyclic loading of AM'd alloys, such as persistent slip bands, are predicted to initiate fatigue cracks.112
According to the research of Radhakrishnan et al.95 on Inconel, Kakiuchi et al.50 on Ti-6Al-4V, and the hypothesis stated in Equation 13, it is conceivable that Murakami's model might include the extreme value statistics technique with high-temperature parameters to predict fatigue. The for an AM'd sample could be calculated at RT using the extreme value statistic. A hardness test at various temperatures would be used to estimate the hardness-temperature relation for Equation 13. Using this strategy, we took into account the fact that, while it would affect the grain size, the temperature did not affect the size of the surface defects. The hardness function, which depends on temperature and is more easily quantifiable than the fatigue test, would take into account the only effect of temperature on the fatigue test.117 The Arrhenius equation typically describes the relationship between hardness and temperature, and a high-temperature nano-indentation test can be used to assess the precise amount of that relationship. Utilizing Table 1 and the Arrhenius equation for hardness, we were able to approach the fatigue limit at high temperatures using experimental data. The fatigue limit estimation would therefore be performed using the conventional Murakami's model (even though it has been developed for steel) based on defect size data (at RT) and the hardness-temperature function. Figure 22 is a summary of the mentioned method for fatigue limit estimation and validation of experimental data from the IT-RBF test of Ti-6Al-4V (Table 1).
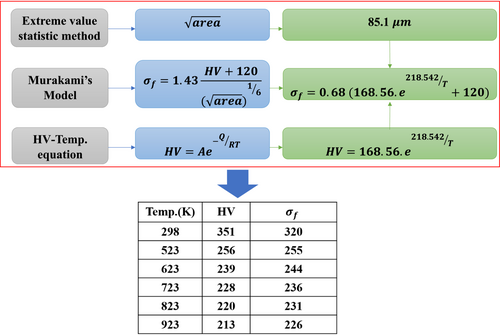
Even though this approach has been shown to accurately predict the Ti-6Al-4V fatigue limit at high temperatures, further testing is still required for AM'd metals. In our opinion, AM'd metals' fatigue behavior at high temperatures would entirely match Murakami's equation's general form, but for the most accurate estimation, some of the equation's constants would need to be changed by data fitting. Also, we employed the conventional estimation of the hardness-temperature equation in our first hypothesis, even though it would be more accurate if it were to be developed based on additional experimental data fitting. In reality, we are optimistic that by adapting Murakami's technique for steel alloys at RT to elevated temperatures, we will be able to do so.
4 RBF IN DIFFERENT WROUGHT/CAST ALLOYS
4.1 Steel
4.1.1 S-N data behavior
The two factors that have the greatest impact on fatigue life are temperature and surface (mentioned before), especially in the RBT. Figure 23 presents the S-N curve that was determined in the investigation for untreated and carburized 316L specimens tested at various temperatures. The effect of temperature and surface treatment on S-N curves is made abundantly clear by these data, which were recorded by RBF under ITF conditions.
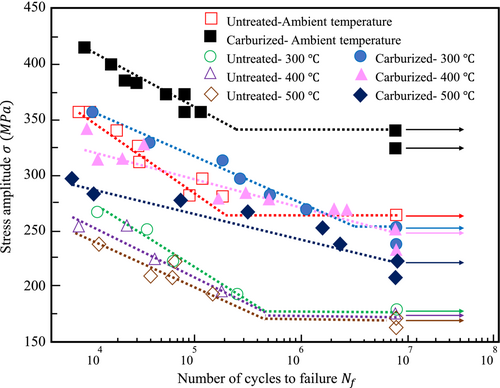
- The surface of the material became harder because of carburizing, and according to Murakami's model, this led to an increase in fatigue life.
- The decrease in fatigue strength is caused by thermomechanical processes, and it occurs as the temperature rises. Temperature can also affect the material's hardness. It's possible to lower the fatigue limit by decreasing the material's hardness (Murakami's model).
- An increase in temperature could potentially obfuscate the fatigue limit of life. At high temperatures, especially those that are greater than 500°C, it would appear that the diagram's solid signals would not show a fatigue limit.
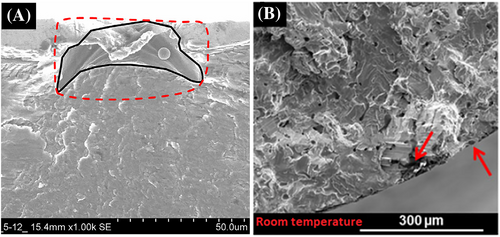
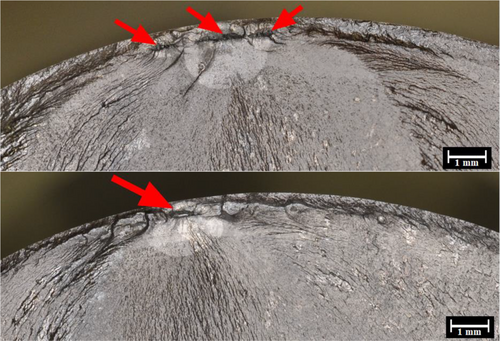
The most intriguing element of the RBF investigation is the surface, both as a concentration of the highest stress that can be measured with the RBF test and as an indication of crack start caused by defect distribution. One of the examples of an unexpected fracture surface in simple steel alloys is shown in Figure 24, which depicts the RBF test carried out at RT. Because the material in this specimen has been subjected to a surface hardening technique (laser cladding), the crack that developed in the specimen started in two separate places before it finally broke in the middle of the specimen.118, 119 In Figure 24, the red arrows point out the fusion line discontinuity as well as the oxide layer that has become trapped in the melt pool. Referring to the previous section, these inclusions are the stress concentration zone. Furthermore, according to Murakami's model, this defect may affect fatigue strength because of the parameter.
4.1.2 Carburizing effect
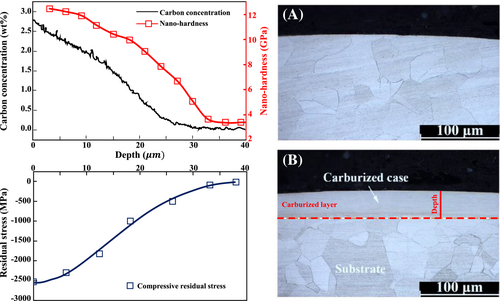
Another study conducted by Liu et al.28 on carburized 316L austenite stainless steel indicated that the improvement in fatigue endurance brought about by carburizing was close to 15% even when the material was kept at RT. Figure 25 illustrates the distribution of carbon content, residual stress, and nano hardness in the depth of the specimen surface. Carburizing causes the surface of the specimen to become harder than the inside. Because of the different carbon solutions in the solid state of the structure, the residual stress would increase as the depth increased, even though the carbon content and hardness were shown to decrease with increasing depth (referring to diffusion Fick's law, the carbon content would decrease). Because of this, it is anticipated that the surface's fatigue qualities would improve as the hardness of the surface increased, thanks to Murakami's model. Furthermore, as the residual compressive stress increases, the fatigue limit is expected to improve. These two assumptions are accurate up until the point when inclusion is present; once inclusion is present, the behavior of the material becomes competitive in terms of stress concentration and local yielding. Results have demonstrated that an increase in carburizing time and temperature, concerning Fick's low, will cause a rise in the diffusion depth of carbon, which, in turn, will cause an increase in the probability that impurities will precipitate. Because there is a significant amount of chromium at high temperatures, chromium carbides have the potential to form. However, because chromium carbides have a low coherency with the base material, the stress concentration around them would eventually reach the threshold stress for the initiation of cracks. This is especially correct in austenite 316L stainless steel. Figure 26 displays the scanning electron microscopy (SEM) of the fracture surfaces of both untreated and carburized 316L stainless steel. It is abundantly visible that carburizing caused all of the cracks to start forming beneath the surface and at a distance of more than one hundred microns from the surface (exactly after the carburized layer Figure 25). According to the findings of the EDS analysis, the commencement of the crack in the carburized sample did not take place due to the presence of any carbides; rather, it took place due to the presence of oxide impurities. Because of this data, it could be deduced that the stress concentration around the carbides is lower than that surrounding the oxides.120 To put it another way, we can suppose that the coherence of the carbides is higher than that of the oxides.121
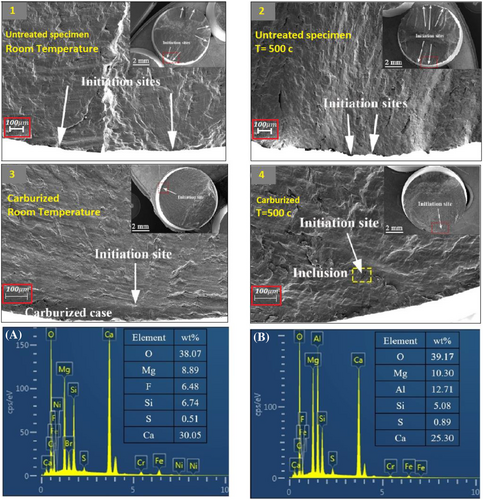
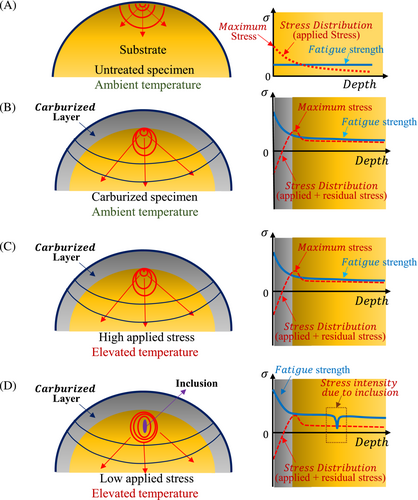
The fatigue strength of carburized specimens has been improved by the presence of carburized case at the surface region. In addition to this, when the high compressive residual stress is generated in the carburized case, the tension stress that is self-balanced with the compressive residual stress is generated at the substrate near the boundary between the carburized case and the substrate. This is because the tensile stress is the result of the carburized case being subjected to high compressive residual stress. After the superposition of residual stress and applied stress, the area of the subsurface that is closest to the boundary between the carburized case and the substrate experienced the greatest amount of stress (for an illustration of this, see Figure 27, the dashed line of stress distribution). This is where the fatigue crack will begin to form. In addition, it has been reported that at RT, there is a significant difference in the elastic–plastic properties of the base material and the carburized case. This difference in properties may be responsible for the strain inconsistency that occurs near the boundary during the fatigue loading process. It is clear from looking at Figure 27 that the process of fracture for the untreated specimen at the increased temperature is the same as the mechanism for the specimen at the ambient temperature. Even still, the region of highest stress appears to be close to the interface between the carburized casing and the substrate. The local fatigue strength is readily exceeded by the stress when it is applied at a reasonably high level, which results in the onset of fatigue cracks near the boundary as well. Because the carburized layer has a strengthening effect on the whole specimen, it is difficult to surpass the local fatigue strength of the material even when it is subjected to the maximum amount of stress. This is because the applied stress is relatively low. However, there are inclusions in the materials, and Figure 26 demonstrates that these inclusions are more brittle than the base material. At higher temperatures, the difference in mechanical properties between the carburized case and the substrate narrows, while the difference in mechanical properties between the substrate material and the inclusion widens. This creates a stress concentrator and results in lower local fatigue strength at the location of the inclusion. Because of this, cracks caused by fatigue start at the internal stress concentrators, which are brittle inclusions, even when there is a little amount of external stress and a high temperature.
4.1.3 Effect of microstructure
Inclusions and defects can have a significant impact on the behavior of fatigue. From both Murakami's and fracture mechanics' points of view, inclusions are the stress intensity site that can cause the crack initiation threshold strength to be exceeded. This means that the inclusions may exert their impact in a variety of different ways. When viewed from a metallurgical perspective, inclusions can be thought of as a point of incoherence in the structure, which causes some distortion in the way energy is distributed throughout the structure. The resistance of metals to fatigue can be adversely affected by any kind of deformation in the structure's configuration. Impurities such as oxides, carbides, nitrides, and other similar compounds caused a second phase to form in the base metal. This indicates that the impurities distorted the configuration and energy of the metal structure. Because of this, depending on the viewpoint and the application, the impacts of inclusion on fatigue would be explained, and efforts would be made to optimize them. Some of these configuration discontinuities generate beneficial effects, while others make the properties of the metal worse. There is a complex relationship between crack initiation, crack propagation, and the effects of defects on the material.
- Porosities-vacancies-voids (a lack of material that can be termed vacancies, porosities, lack of fusion, etc.)
- Inclusions, which comprise all of the impurities, inclusions, precipitates, and so on.
4.1.4 Porosities-vacancies-voids
Murakami demonstrated that the size and shape of an inclusion (regardless of whether it was a porous or second phase) affected the fatigue behavior of the material. That is, the Murakami model considers the net area of inclusion to be an effective parameter on fatigue, whereas fracture mechanics consider stress intensity around porosity to be an effecting parameter on fatigue strength.38
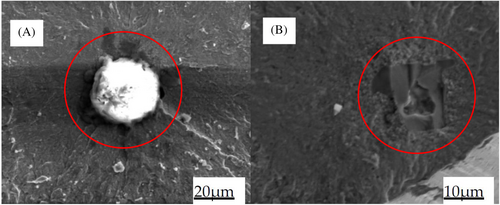
In the other investigation, conducted by An et al.,122 the oxide inclusion and the titanium nitride inclusion in SAE52100 bearing steel were found to be the places where the fracture first began. The crack nucleation site around the inclusion is seen in Figure 28. Porosities can be found in a variety of areas on the fracture surface. It was previously mentioned that the porosities created during the manufacturing process of the material can serve as an initiation site for the crack nucleation process. Additionally, porosities can be found in the area of the final fracture. Porosities have the potential to develop in this scenario because of the micro void coalescence (MVC) mechanism that occurs during fracture.17, 123, 124 Figure 29 illustrates some of the final voids that can be found in the coarsened final fracture area of bearing steel.123
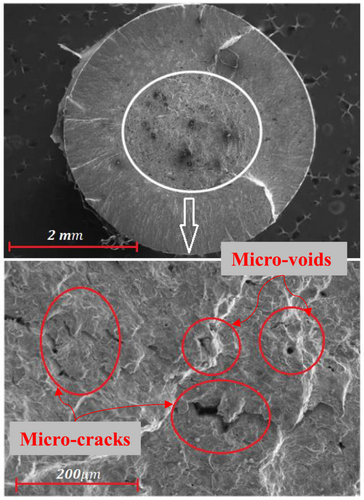
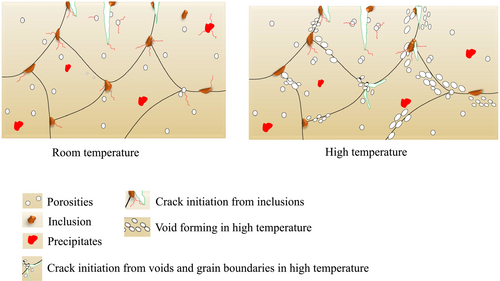
Vacancy creation in crystalline structures is an additional phenomenon that frequently occurs in studies of high-temperature fatigue.125 The rise in temperature causes an increase in these vacancies, and their movement and accumulation at grain borders, where they cause macro-voids, also contribute to this increase (in porosities). This process is the primary cause of the formation of porosity in the area surrounding the ultimate fracture when the temperature is high.126
4.1.5 Inclusions
The fracture mechanics and the Murakami model both have a fair description of the influence that the shape and size of inclusions have on fatigue. On the other hand, the second phase has a different effect on the mechanisms of fatigue and cracking. It has been noted that certain inclusions, such as second-phase precipitates, can affect fatigue properties. In the situations that were discussed in the previous sections, it was demonstrated that carbides, nitrides, bromides, and other elements in steel alloys all displayed various effects. Crack initiation and propagation can be affected by certain lamellar structures that evolved as components of secondary phases,12, 15 certain allotropies such as GP zones in aluminum alloys,104, 127 or the gamma phase in titanium alloys,33 and the perlite structure of steel. The phases, grain boundaries, structure and dislocation slippage system, and inclusion coherency all have very complex correlations with one another. In the investigation of the fatigue of steel alloys, the secondary phase effects are not separately significant when compared with memory-shaped alloys and Ti, Ni, and Al alloys. This is because there are not many phases of allotropy or very strong ductile inclusion in common steels, and the majority of the effect of inclusion is studied based on the hardness and model. Comparatively, the memory-shaped alloys and Ti, Ni, and Al alloys are more sensitive to secondary phases than steel alloys.
4.2 Titanium alloys
4.2.1 S-N data behavior
It has been demonstrated by Horke et al.97 that the fatigue strength and limit of Ti-6Al-4V alloy decreased by close to 30% in standard casting samples as the temperature increased from 25°C to 450°C. Additionally, the fatigue behavior of metal injection molded (MIM) components made of the same alloy and subjected to higher temperatures were examined. The findings of the S-N curves of the cast specimen and the MIM manufactured specimen at increased temperature are given in Figure 30.

Wang et al.34 found the same outcomes in their investigation of the effects of high temperature on the Ti-6Al-4V alloy. They demonstrated that an increase in temperature on an untreated specimen, as well as on a specimen that had been rolled or subjected to some other form of surface treatment, resulted in a decrease in the fatigue strength, and every S-N curve demonstrated a different fatigue limit (Figure 30).
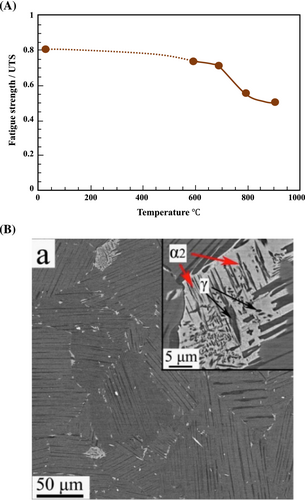
The normalized fatigue strength data by UTS of titanium alloys at various temperatures are shown in Figure 31 of Heneff's comprehensive review paper.15 The diagram demonstrates that both of the fatigue strength and UTS reduce simultaneously until , after this temperature the fatigue strength decreases dramatically more than UTS. This occurrence happened because of phase allotropy in high temperatures. Wu et al.33 demonstrated that the lamellar phase of colonies and the , γ phase are responsible for the reduction in fatigue life with increasing temperatures, and similar results have been reported by other authors.12, 128
4.2.2 Effect of microstructure
Masuo et al.41 have shown that the Murakami model may be utilized for titanium alloys with an estimation precision of more than 90% for the fatigue limit. In the research carried out by Tajiri et al.,43 the author improved the Murakami model by boosting the computation of the effective magnitude of defects in the material. They demonstrated that the algorithm developed by Murakami treats both of the defects as if they were a single defect whenever the distance between defects I and II is less than the area of either defect I or defect II. This occurs when the distance between the two defects is less than the area of either defect I or defect II. They upgraded the estimation, and they deemed defects I and II to be independent defects for the commencement of cracks whenever the distance between defect a and defect b in areas I and II was higher than the of one of the areas (Figure 3).
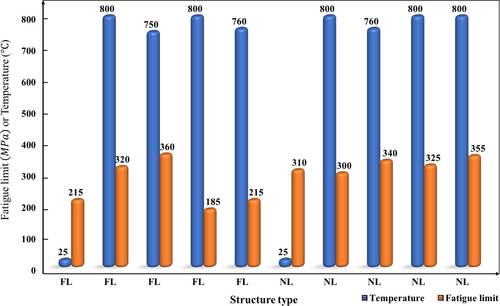
A comparison has been made using a summary of various experiments that have been reported, which can be found in Table 2 as evidence of the microstructure effects of lamellar colonies in Ti alloys. According to Table 2, the fatigue limit does not appear to be significantly affected by variations in temperature, which is not what one would anticipate. It is concluded the effect of temperature on fatigue is a driver of changes in microstructure. It would appear that the microstructure would have a varied lamellar structure and size depending on the temperature. As a result, the microstructure will vary as a direct result of the temperature, which will affect fatigue behavior.
| No | Material | Microstructure | Temperature ( ) | Fatigue limit (MPa) | Ref |
|---|---|---|---|---|---|
| 1 | Ti-46Al-8Nb | Fully lamellar (>1000 ) | RT | 215 | Zhou et al.129 |
| 2 | Ti-45Al-8Nb-(W, B,Y) | Nearly lamellar (90 | RT | 310 | Wu et al.130 |
| 3 | Ti-46.5Al-3-Nb-2.1Cr-0.2-W | Fully lamellar (300 | 800 | 320 | Kumpfert et al.131 |
| 4 | Ti-47.5Al-2.5V-1Cr-0.2Zr | Fully lamellar (260 | 750 | 360 | Edwards132 |
| 5 | Ti-44.2Al-7.8-Nb-0.7Cr-0.2Zr | Nearly lamellar | 800 | 300 | Kruml and Obrtlík91 |
| 6 | Ti-48Al-1V-0.2-C | Fully lamellar | 800 | 185 | Chan92 |
| 7 | Ti-48Al-2Cr-2-Nb | Fully lamellar | 760 | 215 | |
| 8 | Ti-47Al-2Mn−2-Nb-0.8TiB2 | Nearly lamellar | 760 | 340 | |
| 9 | Ti-43Al-8-Nb-0.2W-0.2B | Nearly lamellar (80 | 800 | 325 | Wu et al.33 |
| 10 | Ti-43Al-8Nb-0.2W-0.2B | Nearly lamellar (80 | 800 | 355 | Yang et al.12 |
| 11 | Ti-6Al-4V | Fully lamellar (53 ) | RT | 460 | Sun et al.133 |
| 12 | Ti-6Al-4V | Fully lamellar | 250 | 500 | Kakiuchi et al.50 |
According to Table 2, fully lamellar (FL) structures exhibited significant shifts in their fatigue limits when the temperature rose from RT to 800 , whereas nearly lamellar (NL) structures did not demonstrate any significant shifts in their fatigue limits. This phenomenon demonstrates the effect of the microstructure type and its effect on the initiation and propagation of cracks, both of which have been discussed in various parts of this state of the art.
The graphical comparison shown in Figure 32 is based on the presented data in Table 2, which indicates that as the temperature rose, the FL structure exhibited a higher level of temperature sensitivity. In other words, it is possible to make the hypothesis that a change occurred in the microstructure of these alloys as the temperature increased to roughly 800 (referring to Figure 31). Therefore, Murakami's model, which has been applied to other alloys (instead of steel), should be anticipated to have a modifier coefficient that depends on the features of the microstructure. Since the requirement of some prediction models based on the microstructural features of the materials is important for fatigue strength prediction, this quotation might serve as a guide for subsequent research.
4.3 Aluminum alloys
4.3.1 S-N data behavior
The fatigue behavior of aluminum alloys when subjected to high temperatures is shown to have a very close association with phase allotropies.134 The fatigue behavior of this material, in addition to its other mechanical properties, is significantly influenced by the supersaturated solid solutions (SSSS) allotropies that exist in this alloy.135 Additionally, in this alloy, a heat treatment applied to the samples before the fatigue testing can have a significant impact on the alloy's fatigue life. In the study that was done by Tian et al.,104 they demonstrated that the fatigue behavior of an alloy under 420°C is better than 350°C by using a re-aging process. This is contrary to what would be expected, which is for the structural properties to decrease as the temperature rises, and for the fatigue behavior to become more apparent. They were able to demonstrate that the nano-phase was stable at the high temperature of treatment by demonstrating that the phase continued to exist both before and after the fatigue test. In the context of alloys based on the Al-Cu system, the precipitation sequence is typically understood to go as SSSS → GP zones → θ″ → θ′ → Al2Cu.136
Strzelecki and Tomaszewski16 investigated Philip and Esin,59, 61 Lee et al.,60 Esin,61 Manson,138 and Manson and Muralidharan139 and their four-point model for finding the best relationship between the axial fatigue test and RBF. Some researchers attempted to find a relation between the results of conventional fatigue tests and those of RBF tests. They indicated that the Lee technique is the best model for describing the relation between axial and rotational fatigue, but they also mentioned that the data on RBF is more scattered than the data from axial tests that can provide us a sign concerning aberrant phenomena regarding fatigue behavior due to certain conditions such as the temperature effect and re-aging phenomena while being tested.100 In a different study conducted by Kruml et al.,140 the fatigue behavior of a TiAl alloy containing 48% aluminum was studied at an elevated temperature. The authors employed the Basquin model, the Coffin–Monson model, and a combination model to describe the S-N curve. When the effect of Nb on fatigue behavior is studied, it shows an improvement in fatigue behavior, which could be because of the microstructure allotropies that have been mentioned in Table 2 before.
4.3.2 Effect of microstructure
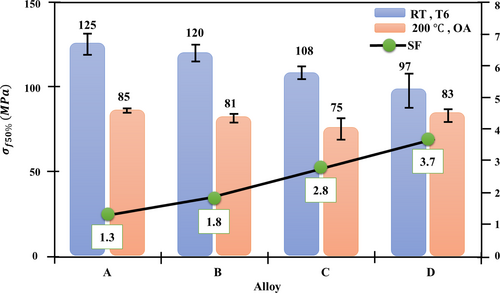
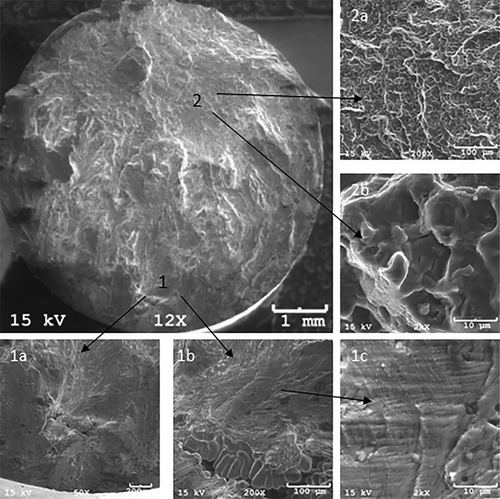
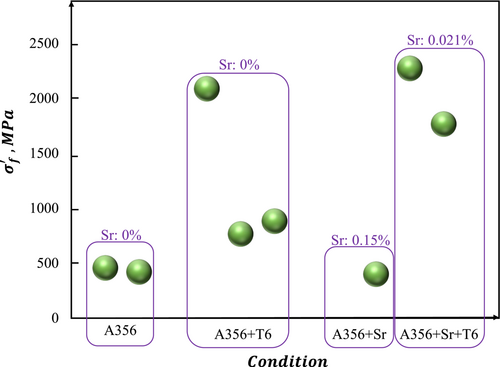
Due to the low melting point and the high vapor pressure of aluminum, porosity is one of the most common defects found in aluminum alloys and especially in AM'd materials.141 As a result, throughout the manufacturing process, micro porosities in the solid will behave as crack-starting sites in fatigue tests. At RT, the development of pores does not take place during the fatigue test; nevertheless, the pores that were already there as a result of earlier processes will still have an effect. Porosities, also known as voids, form in a material subjected to a fatigue test when it is at an elevated temperature. Porosity can be controlled by temperature and the mechanism of diffusion; in addition, it has a relationship with the composition of the material. The effect of strontium on A356 Al alloy in fatigue behavior has been mentioned in Table 3, based on references. The researchers were able to demonstrate conclusively that the addition of strontium caused the microstructure dendrite to become larger and more rounded (Figure 34) form in both A356 and A356+T6 (heat-treated) specimens and that the addition of strontium caused porosities to become larger and more rounded. Figure 35 shows SEM images of fatigue fracture surfaces from different samples. It was feasible to distinguish between three separate regions: crack initiation, crack propagation, and fast fracture (final rupture). The presence of porosity near the sample surface can be seen in region 1 of Figure 35, which corresponds to the initiation and propagation of cracks (Figure 35A,B). This porosity has most likely served as a site for the nucleation and propagation of cracks, which ultimately resulted in early failure. Observations in nearby areas at higher magnifications revealed the presence of deformation bands and fatigue striations (Figure 35C). Porosity was discovered near the sample's surface, as shown in Figure 35A,B. Based on the findings made so far, it appears that the existence of porosity was the primary factor in the onset of early fatigue failure. It is possible to see cross-cycling marks in these locations, which are what distinguish the fatigue region from other parts.
| No. | Material | Additive (%) | Condition | (MPa) | Ref | ||
|---|---|---|---|---|---|---|---|
| Si | Mg | Sr | |||||
| 1 | A356 | 7.18–7.41 | 0.30–0.31 | 0.000 | As cast | 457 | Haskel et al.127 |
| 2 | A356+Sr | 6.95–7.44 | 0.28–0.32 | 0.014–0.017 | Sr-modified | 400 | |
| 3 | A356+T6 | 7.18–7.41 | 0.30–0.31 | 0.000 | T6 unmodified | 2085.2 | |
| 4 | A356+T6+Sr | 6.95–7.44 | 0.28–0.32 | 0.014–0.017 | T6 Sr-modified | 2270.9 | |
| 5 | A356+T6 | 7.40 | 0.29 | 0.00 | T6 unmodified | 765.7 | Zeng et al.142 |
| 6 | A356+T6+Sr | 7.1 | 0.33 | 0.021 | T6 Sr-modified | 1764.6 | Özdeş et al.143 |
| 7 | A356 | 6.6 | 0.383 | 0.00 | As cast | 420 | Tajiri et al.43 |
| 8 | A380+T6 | 7.5 | 0.3 | 0.00 | T6 unmodified | 882.6 | Kisheh et al.144 |
| 9 | A380+T0 | 7.5 | 0.3 | 0.00 | T0 unmodified | 932.1 | |
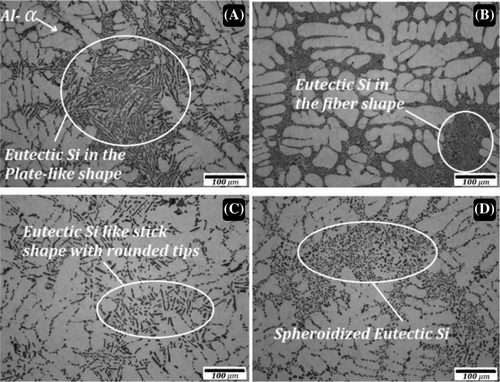
It would appear, regarding Table 3, that strontium can, in general, increase fatigue properties; yet it demonstrates an opposite response when subjected to heat treatment. In Figures 34 and 36, strontium at high temperatures can improve the microstructure and turn the needle microstructure into a rounded microstructure. As a result, crack initiation will decrease due to a decrease in the amount of stress intensity in the microstructure. However, as demonstrated by the findings, without undergoing heat treatment, strontium is unable to demonstrate a significant change in its fatigue properties; this is the case even though increasing the eutectic area has a negative impact. In addition, as shown in Figure 36, the influence of temperature on the A356 alloy is significantly greater than the effect of Sr; hence, the effect of Sr on fatigue parameters can be disregarded.
Ceschini et al.137 have shown that some intermetallic precipitates in the presence of Si in Al alloys can be crack initiation sites in a high-temperature fatigue test. Of course, the effect of inclusions in this alloy is dependent on the properties of the inclusions, and sometimes they have a positive and sometimes a negative effect on fatigue behavior. As it has been mentioned in the previous section, the influence of inclusions or, on the other hand, the second phase depends on the coherency between the base metal and the precipitates. The fracture surface SEM has shown that the crack started initiating from the inclusion that was close to the surface of the specimen. This is depicted in Figure 37. The propensity of magnesium to oxygen is greater than that of other impurities in aluminum alloys, which means that the sites at which cracks first begin to propagate are more likely to be dependent on secondary phases in the presence of magnesium when the temperature is high. The magnesium oxides are extremely brittle, and because the grain boundaries of the material at an elevated temperature are constantly being attacked by oxygen, the magnesium oxides are constantly produced in the crack tip.

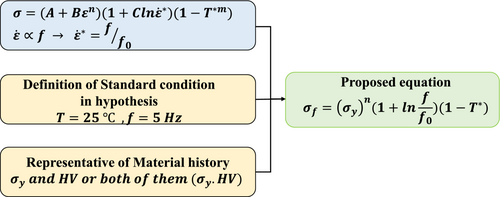
equivalent plastic strain.
dimensionless plastic strain rate.
homologous temperature.
room temperature.
For the hypothesis made in Equation 30, the distance from the standard condition has been taken into account by the frequency and temperature coefficients, and the material history has been taken into account by the power n that should be calculated by data fitting. Reaching the yield point was used as the basis for determining the fatigue criterion. In Table 4, some of the findings from papers have been provided, and the results of our analysis can be seen in Figure 38. The subsequent study work will be devoting its attention to investigating this possibility. To use Equation 30, it will first refer to Table 4 and perform the calculations necessary to determine the temperature term and the frequency term as summarized in Table 5. The value of n can then be found by applying the logarithm to Equation 30. Table 5 presents the results of the calculations based on assertion Equation 30 that has been used to reference data in Table 4. The yield stress power, denoted by n, can range anywhere from 0.76 to 1.18. However, in the first phase, this n would be utilized for Equation 30 to try to estimate the existing data in Table 5. The correctness of n and the suggested model should be evaluated with tests.
| Material | Temperature ( ) | (MPa) | f (Hz) | History | T ( | (MPa) | Description | Ref | ||
|---|---|---|---|---|---|---|---|---|---|---|
| Austenitic stainless steel | RT | 420–250 | 15 | Untreated | 25 | 220 | The effect of surface hardness and residual stress on fatigue strength and initiation site has been investigated. All of the cracks initiated from beneath the carburized layer from defects. | Liu et al.29 | ||
| Carburized | 25 | 325 | ||||||||
| 316L austenitic stainless steel | 300, 400, 500 | 420–170 | 15 | Untreated | 300 | 185 | Carburization improved the hardness and fatigue limit, but in high temperatures, data are more scattered due to decarburization. | Liu et al.28 | ||
| 400 | 170 | |||||||||
| 500 | 165 | |||||||||
| Carburized | 300 | 250 | ||||||||
| 400 | 240 | |||||||||
| 500 | 225 | |||||||||
| EN-GJS700-2 ductile cast iron | RT | 415–188 | 100 | Crankshaft | 25 | 200 | Crankshaft (cast Iron) has been studied, and all of the graphite in the material are responsible for crack initiation points. | Khameneh and Azadi146 | ||
| Boronized austenitic stainless steel AISI 304 | 350, 550, 650 | 360–220 | 5 | Untreated | 25 | 300 | The boronizing caused reducing in fatigue strength in the LCF regime due to brittle precipitates. Also, in high temperatures due to de-boronizing and brittle precipitates, the fatigue strength dropped. | Wiriyasaroj et al.30 | ||
| 350 | 270 | |||||||||
| 550 | 280 | |||||||||
| 650 | 270 | |||||||||
| Boronized | 25 | 330 | ||||||||
| 350 | 270 | |||||||||
| 550 | 260 | |||||||||
| 650 | 240 | |||||||||
| S355J2 + C and C45 + C steel | RT | 550–350 S355J2 | ---- | ------ | 25 | ------- | In this paper, the different fatigue life models and data distribution have been investigated. | Strzelecki31 | ||
| 610–350 C45 | ||||||||||
| Laser cladding AISI-SAE 4140H alloy steel | RT | 380 | 8 | Laser cladding | 25 | ----- | The effect of surface hardening and quality on the crack initiation sites in the RBF test has been investigated. | Bell118 | ||
| LZ50 axle steel | RT | 310 | 50 | ------ | 25 | ----- | In this paper, crack behavior and fatigue properties has been investigated by replica test. | Yang et al.147 | ||
| Forged EA4T steel | RT | 630–440 | 50 | Initial Forged Temp | 1050 | 25 | 480 | The effect of initial forged temperature on fatigue strength and crack mechanism has been investigated. | Li et al.148 | |
| 1150 | 25 | 515 | ||||||||
| 1,250 | 25 | 530 | ||||||||
| High carbon chromium bearing still—SUJ2 and SNCM 439 | RT | 1200 | 52 | SUJ2 | Grinding | 25 | 1200 | The effect of surface finishing and also residual stresses has been investigated. This is one of the rare papers that has reported the Fisheye in the RBF test. | Ochi et al.124 | |
| El.Polishing | 25 | 1100 | ||||||||
| Residual 433–625 | SNCM439 | Grinding | 25 | 1000 | ||||||
| El.Polishing | 25 | 900 | ||||||||
| PH-42 steel plasma nitrided and non-nitrided | RT | 800–440 | 50 | Untreated | 25 | 440 | The effect of the surface hardening process has been investigated. Nitridation causes improved fatigue behavior. | Bressan and Kohls149 | ||
| 1300–710 | Nitrided | 25 | 700 | |||||||
| 30MnB5, 41CrS4, and 30MnVS6 Steels | RT | 325–800 | ---- | 30Mn B5 | 25 | 326 | García-Diez et al.123 | |||
| 30Mn VS6 | 25 | 233 | ||||||||
| 41CrS4 | 25 | 310 | ||||||||
| Lasers clad hard-facing alloys on AISI 4130 steel | RT | 400–200 | 47.5 | Lasers clad | 25 | ---- |
The laser cladding effect as a hardening layer producer can affect the beneath layer and fatigue strength. The result has shown that by reducing the coating thickness in the cladding-coating process fatigue properties will improve. |
Hutasoit et al.119 | ||
| Ti-43Al-8Nb-0.2W-0.2B | 800 | 325–370 | 83 | ---- | 800 | 325 | All samples survive in 107, but microstructural investigation showed that with increasing amplitude in high temperature, delamination, and recrystallization will increase. | Yang et al.12 | ||
| Ti-6Al-4V | RT | 700–200 | 52 | CM | 25 | 600 | Fatigue limits of AM'd Ti-6Al-4V were lower than those of CMed Ti-6Al-4V because the defects acted as fatigue crack starters. Roughly 30–40% of the fatigue limit of CM'd materials is AM'd fatigue limit. | Uematsu et al.128 | ||
| AM | 25 | 200 | ||||||||
| Powder injection molding Ti-6Al-4V | RT, 250, 450 | 450–250 | 150 | Wrought | 250 | 600 | This paper also is about powder injection molding but due to porosity and defects distribution can be a close case to AM; also referring to the results, it is clear the fatigue limit is around 30% of the fatigue limit of CM'd case. With increasing temperature, fatigue strength dropped in CM'd case. | Horke et al.97 | ||
| Sintering | 250 | 200 | ||||||||
| Wrought | 450 | 420 | ||||||||
| Sintering | 450 | 200 | ||||||||
|
AM – (EBM & DMLS) Ti-6Al-4V |
RT | 700–200 | 60 |
EBM DMLS |
As built | HIP | 25 | 195 | The effect of surface quality and defect size on fatigue strength, and Murakami's model has been investigated. | Masuo et al.41 |
| Non | 25 | 140 | ||||||||
|
Polished As built |
HIP | 25 | 590 | |||||||
| Non | 25 | 240 | ||||||||
| Polished | HIP | 25 | 220 | |||||||
| Non | 25 | 155 | ||||||||
| As built | HIP | 25 | 610 | |||||||
| Polished | Non | 25 | 370 | |||||||
| SLM Ti-6Al-4V | RT | 600–300 | 50 | SLM | As built | 25 | 340 | With increasing surface hardness referring to Murakami's model, the fatigue limit increases. This postulate has been studied in this paper | Kumar and Ramamurty150 | |
| Heat treated | 25 | 370 | ||||||||
| Shot peened | 25 | 450 | ||||||||
| Ti-Al | RT | 650–400 | 50 | Ti-43Al-8 Nb | HIP (800) | 25 | 355 | The effect of HIP temperature and lamellar microstructure has been investigated. | Wu et al.33 | |
| Ti-46Al-2Nb-2Cr | Forge(600) | 25 | 480 | |||||||
| Ti-47.5Al-2.5 V | HIP (750) | 25 | 350 | |||||||
| Ti-46Al-8Nb | HIP (600) | 25 | 220 | |||||||
| Ti-45Al-8.5Nb | HIP (RT) | 25 | 200 | |||||||
| Ti-6Al-4V | RT | 600–400 | 50 | AM | 25 | 460 | In this paper, the fatigue limit in RBF and ultrasonic test of AM'd material has been compared with CMed materials. | Sun et al.133 | ||
| Ti-6Al-4V | RT, 250 | 625–300 | 60 | AM | 25 | 250 | The fatigue test on AMed material has been done and the fatigue limit investigate by Murakami's model prediction | Kakiuchi et al.50 | ||
| 250 | 220 | |||||||||
| CM | 25 | 600 | ||||||||
| 250 | 500 | |||||||||
| Ti-43Al-8Nb-0.2W-0.2B | RT, 800 | 600–350 | 83 | ----- | 800 | 355 | Yang et al.12 | |||
| Al-Si-Cu alloy - EN AC-46000 | RT, 200 | 130–70 | 50 | CM | 25 | 97–125 | In this study, the effect of microstructure and sludge factor on fatigue limit at room and elevated temperature has been investigated. | Ceschini et al.137 | ||
| 200 | 75–85 | |||||||||
|
7075-T7351 Al Alloy |
RT | 110–210 | 55 | CM | 25 | 120 | The fatigue limit and prediction model based on the stress intensity factor has been investigated. | Yang et al.100 | ||
|
7075-aluminum alloy Coated and uncoated |
RT | 280–200 | 50 | CM - Uncoated | 25 | 220 | Baragetti et al.105 | |||
| CM - Coated | 25 | 230 | ||||||||
|
Burnished and Unburnished 7075.T6 aluminum alloy |
250–350 | 120–350 | 20 | Burnished | 250 | 215 | The effect of temperature on fatigue behavior and crack initiation sites has been investigated | El-Nasr9 | ||
| 350 | 200 | |||||||||
| Unburnished | 250 | 185 | ||||||||
| 350 | 165 | |||||||||
| AW 6063 T6 aluminum alloy | RT | 200–100 | ----- | AW 6063 T6 aluminum | 25 | 100 | In this paper, the relation between RBF and conventional fatigue test on Al and steel alloy has been studied | Strzelecki and Tomaszewski16 | ||
| 1.4301 acid-resistant steel | 25 | 400 | ||||||||
| Al6061-T6 alloy | RT | 120–20 | 33, 50 | Frequency 33 | 25 | 43 | The frequency increase in room temperature caused increasing in fatigue strength. | Govindaraju et al.65 | ||
| Frequency 50 | 25 | 55 | ||||||||
| A356 aluminum | RT | 300–100 | 60 | A356 | 25 | 98 | In this study, the effect of heat treatment and Sr additive has been studied. Although the fatigue limit did not show a considerable variation, fatigue strength coefficient in the Basquin equation has a great change. | Haskel et al.127 | ||
| A356+Sr | 25 | 105 | ||||||||
| A356+T6 | 25 | 105 | ||||||||
| A356+T6+Sr | 25 | 105 | ||||||||
| A356 aluminum | RT | 160–50 | 60 | Fast cooling | 25 | 65 | The effect of cooling rate (dendrite size) on fatigue limit has been investigated, and also, they proposed a modifier method for Murakami's defect size measurement. | Tajiri et al.43 | ||
| Moderate cooling | 25 | 80 | ||||||||
| Slow cooling | 25 | 75 | ||||||||
| K417G nickel-base superalloy | 900 | 370–310 | 83 | Aged sample in 950°C (the best fatigue properties) | 900 | 310 | In this paper, the effect of the aging processor before the high-temperature fatigue test and microstructural changes has been investigated. They proved that with increasing aging temperature, fatigue properties in high temperatures have been improved. | Yu et al.71 | ||
| Inconel 718 | RT | 700–450 | 52.5 | 25 | 500 | Govindaraju et al.65 | ||||
| Inconel 718 | RT, 300, 500, 600 | 850–450 | 55 | Inconel 718 | 25 | 450 | In the short-life region, the fatigue strength decreases with the increase in temperature. In the long-life region, however, the fatigue strength is much higher at elevated temperatures than at room temperature. | Chen et al.151 | ||
| Inconel 718 | 300 | 600 | ||||||||
| Inconel 718 | 500 | 680 | ||||||||
| Inconel 718 | 600 | 620 | ||||||||
| Inconel 718 | RT | 850–100 | 100 | Conventional heat treatment (AMS 5662) | 25 | 347 | The effect of post-processing on the AM'd Inconel fatigue limit has been investigated. | Kaletsch et al.152 | ||
| HIP with fast cooling + aging in the ambient atmosphere | 25 | 528 | ||||||||
| HIP with fast cooling + aging under pressure | 25 | 497 | ||||||||
| HIP with fast cooling + aging in the ambient atmosphere | 25 | 165 | ||||||||
| HIP with fast cooling + aging under pressure | 25 | 434 | ||||||||
| Inconel 718 | RT, 500, 600 | 850–450 | 50 | Inconel 718 | 25 | 480 | Fracture morphological features are characterized by a striations-dominated and surface-originated failure under stresses higher than horizontal step stress and by intergranular cracking like internal cracks under stresses lower than horizontal step stress at each elevated temperature. | Kawagoishi et al.153 | ||
| Inconel 718 | 500 | 600 | ||||||||
| Inconel 718 | 600 | 480 | ||||||||
| No | History | Temp, | Frequency, Hz | (melting) | MPa | Temp. term | Frequency term | T.F term | n | Predicted | Ref | ||
|---|---|---|---|---|---|---|---|---|---|---|---|---|---|
| 1 | Carburized | 300 | 15 | 250 | 1400 | 265 | 0.80 | 2.10 | 1.68 | 0.8967 | 220.62 | Area 1 | Liu et al.28 |
| 2 | Carburized | 400 | 15 | 240 | 1400 | 265 | 0.73 | 2.10 | 1.53 | 0.9065 | 200.56 | ||
| 3 | Carburized | 500 | 15 | 225 | 1400 | 265 | 0.65 | 2.10 | 1.37 | 0.9138 | 180.51 | ||
| 4 | Non treated | 300 | 15 | 185 | 1400 | 275 | 0.80 | 2.10 | 1.68 | 0.8372 | 227.88 | ||
| 5 | Non treated | 400 | 15 | 170 | 1400 | 275 | 0.73 | 2.10 | 1.53 | 0.8391 | 207.16 | ||
| 6 | Non treated | 500 | 15 | 165 | 1400 | 275 | 0.65 | 2.10 | 1.37 | 0.8525 | 186.44 | ||
| 7 | Boronized | 25 | 5 | 330 | 1400 | 190 | 1.00 | 1.00 | 1.00 | 1.1052 | 387.98 | Area 2 | Wiriyasaroj et al.30 |
| 8 | Boronized | 350 | 5 | 270 | 1400 | 190 | 0.76 | 1.00 | 0.76 | 1.1184 | 296.28 | ||
| 9 | Boronized | 550 | 5 | 260 | 1400 | 190 | 0.62 | 1.00 | 0.62 | 1.1514 | 239.84 | ||
| 10 | Boronized | 650 | 5 | 240 | 1400 | 190 | 0.55 | 1.00 | 0.55 | 1.1600 | 211.62 | ||
| 11 | Non treated | 25 | 5 | 300 | 1400 | 190 | 1.00 | 1.00 | 1.00 | 1.0871 | 387.98 | ||
| 12 | Non treated | 350 | 5 | 270 | 1400 | 190 | 0.76 | 1.00 | 0.76 | 1.1184 | 296.28 | ||
| 13 | Non treated | 550 | 5 | 280 | 1400 | 190 | 0.62 | 1.00 | 0.62 | 1.1656 | 239.85 | ||
| 14 | Non treated | 650 | 5 | 270 | 1400 | 190 | 0.55 | 1.00 | 0.55 | 1.1825 | 211.63 | ||
| 15 | Forged | 25 | 50 | 480 | 1400 | 545 | 1.00 | 3.30 | 3.30 | 0.7902 | 476.64 | Area 3 | Li et al.148 |
| 16 | Forged | 25 | 50 | 515 | 1400 | 610 | 1.00 | 3.30 | 3.30 | 0.7873 | 520.96 | ||
| 17 | Forged | 25 | 50 | 530 | 1400 | 620 | 1.00 | 3.30 | 3.30 | 0.7898 | 527.69 | ||
| 18 | Grinding | 25 | 52 | 1200 | 1400 | 415 | 1.00 | 3.34 | 3.34 | 0.9760 | 986.04 | Ochi et al.124 | |
| 19 | Electroploshing | 25 | 52 | 1100 | 1400 | 415 | 1.00 | 3.34 | 3.34 | 0.9616 | 986.04 | ||
| 20 | Grinding | 25 | 52 | 1000 | 1400 | 470 | 1.00 | 3.34 | 3.34 | 0.9266 | 1108.88 | ||
| 21 | Electroploshing | 25 | 52 | 900 | 1400 | 470 | 1.00 | 3.34 | 3.34 | 0.9095 | 1108.88 | ||
| 22 | Nitride | 25 | 50 | 700 | 1400 | 600 | 1.00 | 3.30 | 3.30 | 0.8373 | 886.67 | Bressan and Kohls149 | |
| 23 | Non treated | 25 | 50 | 440 | 1400 | 600 | 1.00 | 3.30 | 3.30 | 0.7648 | 514.21 | ||
| 24 | Carburized | 25 | 15 | 325 | 1400 | 265 | 1.00 | 2.10 | 2.10 | 0.9037 | 405.57 | Area 4 | Liu et al.29 |
| 25 | Non treated | 25 | 15 | 220 | 1400 | 283 | 1.00 | 2.10 | 2.10 | 0.8241 | 234.18 | ||
| 26 | Non treated | 25 | 5 | 326 | 1400 | 850 | 1.00 | 1.00 | 1.00 | 0.8579 | 279.58 | García-Diez et al.123 | |
| 27 | Non treated | 25 | 5 | 233 | 1400 | 850 | 1.00 | 1.00 | 1.00 | 0.8081 | 279.58 | ||
| 28 | Non treated | 25 | 5 | 310 | 1400 | 850 | 1.00 | 1.00 | 1.00 | 0.8505 | 279.58 |
Concerning Figure 39, the n variable in Equation 30 is more sensitive to the multiple factors of frequency and temperature. Even though the overall trend of n has a narrow range, this parameter can have a significant effect on the prediction of material fatigue. It could be classified by the n behavior into one of three areas (Figure 39 and Table 5), and for the most accurate assessment, it should strive to use each n for material with a heat treatment history that is comparable to the others.
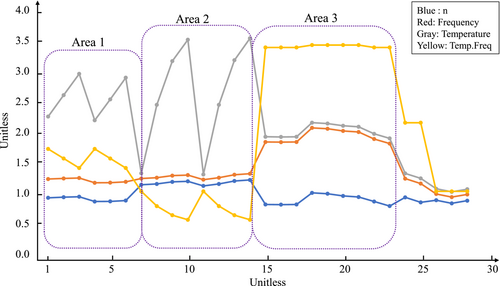
For instance, the quantity of n that is considered average in area 1 is 0.874; consequently, if it were applied to Equation 30 for each test in area 1 or any other condition that is analogous, the anticipated fatigue limit would be close to the data that was collected. The same pattern of behavior can be observed in other domains. The most significant objective of this claim is to determine the generalized value of n for each of the many sorts of steel materials.
Figure 40 presents the results of a comparison between the anticipated fatigue life and empirical data. This comparison was generated using Equation 30, which was based on data collected from Table 5. As can be seen, the anticipated data scattering is not that wide and is relatively close to the actual data (especially in a range smaller than 700 MPa). This claim is capable of being developed, and once it is, it will be able to anticipate the fatigue limit at a variety of temperatures and frequencies by using yield stress as a basis.
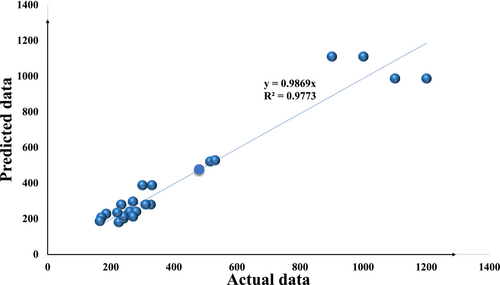
5 SUMMARY
In this review article, the focus is on mechanical phenomena and microstructure changes during elevated-temperature RBF. The goal of the test is to evaluate the material's endurance limit and fatigue life at increased temperatures, which is crucial for applications where the material will be subjected to high temperatures, such as aviation engines, gas turbines, and power plants. During the test, the material is exposed to cyclic loading, which induces the formation and growth of small cracks over time. Due to the generation of high-temperature oxidation products, the pace of crack propagation is often accelerated at extreme temperatures. These fissures may eventually spread to the point of catastrophic collapse. Due to the higher crack propagation rate and decreased material strength at rising temperatures, the S-N curve at elevated temperatures may have a different form and lower endurance limit than the S-N curve at ambient temperature. In RBF tests, crack initiation has been reported to occur from the surface or just beneath the surface, even at high temperatures.154 Therefore, it can be assumed that internal effects can be neglected in the RBF test, and the surface/subsurface plays the key role in the high-temperature RBF failure. Consequently, the determining parameters in crack initiation in the RBF tests can be summarized as the surface characteristics of the material, stress level, and cyclic loading parameters. Fatigue behavior at high temperatures appears to be highly dependent on the environment and correlated with internal metallurgical properties.23 Therefore, ITF, a combination of mechanical fatigue and temperature-activated processes, should be explored on a case-by-case basis. The behavior of the alloys under various situations cannot be compared; hence, each scenario must be evaluated independently. In addition to having a direct impact on fatigue properties, environmental factors such as stress amplitude, applied load function, frequency, temperature, and oxygen may also have an indirect impact on those factors through metallurgical phenomena. High–temperature fatigue tests involve a combination of metallurgical and mechanical phenomena; oxygen and frequency may influence the formation rate of oxide layers and the work–hardening rate, respectively. Therefore, it appears that one of the future research areas for establishing a relationship between fatigue properties in high temperature and RT mechanical properties is the hypothesis of Equation 30 as a type of Johnson–Cook development. This could be a technique for formulating fatigue behavior in high temperatures based on data collected at RT, which is like the hypothesis in the Johnson–Cook equation. If the high-temperature fatigue data diverge from a standard condition at RT, the deviation should be formalized using some mathematical and statistical information. The deviation from the norm will be visible with this method because of temperature, frequency, and structure changes. The variance of each parameter would be apparent if the RBF test had been performed under various constant conditions. Finally, distinct deviation from standard conditions could be calculated, and the effects of each parameter would be apparent if series testing has been done in one parameter condition (others keep constant). This hypothesis led us to an initial assumption stated in Equation 30.
As stated previously, performing an RBF test at elevated temperatures can be a useful starting point for modifying fatigue models for various fatigue-critical high-temperature applications. Although several models based on empirical data have been developed,23 there is no comprehensive model that considers numerous variables, such as frequency, temperature, oxidation, and microstructure properties. Murakami's model, which has been extended to other alloys and temperatures in studies, is a model that requires some development for elevated temperatures. It appears that a temperature-dependent coefficient can be used to develop Murakami's model. Although this model includes a few constants for steel, it has also been applied to other alloys with the same constant, which is not particularly logical. Therefore, it is preferable to alter the constant when using this model with other alloys. Although data fitting can be used to compute these constants, it is not practical for high temperatures. Murakami's model is a structure-dependence model (dependent on defect size); hence, it will become less accurate with changes in temperature and microstructure allotropies. Murakami's model requires two modifications to forecast the fatigue limit at elevated temperatures; the first is the temperature coefficient, which can consider structural changes and the impact of temperature on the hardness account. A second factor took the nature of defects into account. Although there are many various kinds of defects and inclusions in the material, as indicated in certain articles, some defects have been the source of crack initiation. As a result, it has demonstrated the necessity of a defects-type effect on Murakami's model.
Both isothermal uniaxial fatigue and isothermal RBF tests can be performed on AM'd materials. The stress distribution across the cross-sectional area, the risk volume, and therefore the involved defects in the bulk of the material are different in uniaxial and RB fatigue tests. However, it could be quite interesting to compare and correlate the fatigue results between uniaxial and RBF tests to develop fatigue prediction models and identify the key parameters in elevated temperature fatigue for each case. It is worth noting that, relative to isothermal axial fatigue testing, the RBF test system is significantly less expensive, less costly to function, and can be used to produce data more quickly. Therefore, it is especially advantageous to acquire relatively rapid fatigue experimental data for various AM metallic materials. Because AM'd alloys represent a new generation of materials (and microstructures), fatigue tests must be undertaken at high temperatures and under RB circumstances. Although the RB test is the most common method for determining fatigue, it has not evolved particularly well in the AM'd materials exposed to high temperatures.
One key consideration in fatigue characterization of AM'd metallic materials (at ambient and non-ambient temperature conditions) is to fundamentally assess the variations between fatigue response under RB and the servo-hydraulic uniaxial loadings conditions. The risk volume in RB and uniaxial (pull-push) fatigue tests are not the same. It is expected that the contribution of AM-induced volumetric and surface defects in fatigue failure (e.g., fatigue crack initiation) not be the same in these two fatigue testing methods. That is, the characteristics of the stated surface roughness and volumetric defects (size, distribution, location, and geometry) associated with the layer-wise nature of the metal AM process shall play key roles in the RBF performance of the AM materials considering the nonuniform distribution of stress over the cross-section of the test specimens exposed to the RBF tests relative to the uniaxial (pull-push) fatigue. The roles and contributions of the AM-induced defects might also be different between RBF and uniaxial fatigue tests. These topics are worth to be studied more in detail in the future among the AM and materials science communities.
Nomenclature
-
- AM
-
- additive manufacturing
-
- AM'd
-
- additive manufactured
-
- CM
-
- conventional manufacturing
-
- CM'd
-
- conventionally manufactured
-
- DRX
-
- dynamic recrystallization
-
- EDS
-
- energy dispersive spectroscopy
-
- ET
-
- elevated temperature
-
- FL
-
- fully lamellar
-
- GP
-
- Guinier–Preston zone
-
- HV
-
- Vickers Hardness
-
- ITF
-
- isothermal fatigue
-
- IT-RBF
-
- isothermal rotating bending fatigue
-
- LEFM
-
- linear elastic fracture mechanic
-
- LOF
-
- lack of fusion
-
- MIM
-
- metal injection molded
-
- MVC
-
- micro void coalescence
-
- NL
-
- nearly lamellar
-
- RB
-
- rotating bending
-
- RBF
-
- rotating bending fatigue
-
- RBT
-
- rotating bending test
-
- RT
-
- room temperature
-
- SF
-
- sludge factor
-
- SFC
-
- short fatigue crack
-
- SIF
-
- stress intensity factor
-
- S-N
-
- stress-number of cycles
-
- SSSS
-
- super saturated solid solution
-
- TF
-
- thermal fatigue
-
- TMF
-
- thermomechanical fatigue
-
- UTS
-
- ultimate tensile strength
-
- XRMCT
-
- X-ray micro computed tomography
-
- -N
-
- strain-number of cycles
Open Research
DATA AVAILABILITY STATEMENT
The data that support the findings of this study are available from the corresponding author upon reasonable request.


