Fretting fatigue tests and microstructure analysis of bridge stay cable wires
Abstract
Saddle systems are a popular method for supporting the cables at the pylons of cable-stayed bridges. Fretting fatigue failure of bridge stay cables is a major design consideration for saddle systems. Current design provisions require large-scale tests of these anchoring systems. However, such tests are costly and time-consuming. With this in mind, the current paper presents a small-scale fretting fatigue setup to evaluate the fretting fatigue behavior of bridge stay cable wires at saddle supports. In this paper, fretting tests are conducted on bare and galvanized wires. Hourglass samples are then used to evaluate the material properties and plain fatigue performance of the studied wires. Finally, the microstructure of the wires is evaluated, and the influence of defects on the fretting fatigue life of the wires is discussed.
Highlights
- A small-scale fretting fatigue test setup for bridge stay cable wires is designed.
- Fatigue and fretting fatigue performance of bare and galvanized wires are evaluated.
- The microstructure and properties of two typical bridge cable wires are explored.
- The effects of defects on fatigue and fretting fatigue life of wires are discussed.
1 INTRODUCTION
High-strength steel cables are primary components of cable-stayed bridges, which transfer the gravitational loads at the bridge deck to the pylons (or tower structures). There are different anchoring systems to support the cables in these bridges. The traditional approach is anchoring the cables directly to the bridge deck and the pylons. This approach requires big pylons, which increases the material costs and limits the architect's freedom in the design. Saddle systems are another popular anchoring method, which has been recently used in several projects. The dimensions of the pylons can be considerably smaller with saddles. In these systems, cables are anchored to the bridge deck on one side of the pylon, go over a radial surface, or saddle, at the pylon and are then anchored to the bridge deck on the other side of the pylon. Fretting fatigue failure of the stay cables at the saddle supports is a major issue for these systems.
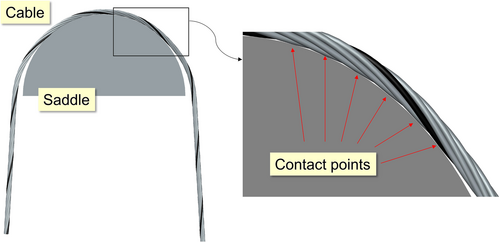
Fretting fatigue occurs “when two contacting components experience a small amplitude relative motion.”1 Several parameters can affect the fretting fatigue life of components; the most critical ones are coefficient of friction, contact force, relative displacement, and remote stress range. Based on the relative displacement, three different regimes are defined for two contacting components.2 First, a stick regime is observed at very small relative displacements with a very long fatigue life. Second, a stick–slip regime, is observed in which the center of the contact area sticks and generates a low volume of wear, while the borders of the contact area slip and leads to a high volume of wear. Third, a gross sliding regime occurs at higher relative displacements with a high volume of wear over the entire contact area. Fretting fatigue typically occurs at relative displacements lower than 50–200 μm in the stick–slip or gross sliding regimes. The exact limit changes according to other critical parameters and the geometry of the components. It should be noted that higher relative displacements in the gross sliding regime can increase the fatigue life, as the resulting wear can actually remove the small cracks initiated at the surface of the component. In saddle systems, the cables are in contact with the saddle at discrete points (see Figure 1). Small relative movements of the cables over the saddles, due to truck passages, and high contact forces between the cables and the saddles make the cables prone to fretting fatigue failure.
A few studies have been reported on large-scale fretting fatigue tests and numerical analysis of bridge cables at saddle supports. Full-scale fretting fatigue tests of cables at saddle supports were conducted at TU Berlin.3 These tests were costly and time-consuming. Therefore, an alternative smaller version of this setup was designed and used also at TU Berlin.4 The new setup enabled tests to be done at three saddle radii of 500, 1000, and 1500 mm. However, the newer setup was still very large. A 3D finite element (FE) model of the contact points between a cable and saddle is discussed, and a multiaxial stress analysis approach is employed in Mohareb et al.,5 along with the Smith–Watson–Topper parameter, to determine the fretting fatigue life of the cables. Chehrazi et al.6 extended this analytical approach to a probabilistic framework. Several studies7-9 developed closed-form equations to determine the critical parameters that affect the fretting fatigue life of the cables at saddle supports. These include contact force, slip displacement, and remote stress range.
Several experimental studies can be found in the literature on the interwire fretting fatigue behavior of high-strength steel cables. Périer et al.10 studied interwire fretting fatigue behavior of steel wires in aqueous environments. Wang et al.11 discussed interwire fretting fatigue performance of steel wires in low cycle fatigue. Several researchers12-15 investigated the performance of these cables in corrosive environments. Wang et al.16 and Guo et al.17 explored contact surface wear and crack propagation during interwire fretting fatigue tests. Winkler et al.18 employed a digital image correlation method to evaluate the relative movements between bridge cable wires under bending load. Several papers studied interwire fretting fatigue problem for mine hoisting ropes19, 20 and overhead conductors.21-23
Despite the existence of several works on small-scale tests for interwire fretting fatigue behavior of bridge cables, no work can be found on small-scale tests for evaluating the fretting fatigue behavior of wires at saddle supports. Also, there are a limited number of studies in the literature reporting large- or full-scale tests on these support systems. With this in mind, this paper first presents a small-scale setup for evaluating the fretting fatigue life of the wires at saddle supports. Following this, fretting fatigue test results are presented for bare and galvanized wires. Hourglass samples were then employed to evaluate the material properties of the studied wires. Finally, the microhardness and microstructure are evaluated, and the influence of defects on the fretting fatigue performance of the wires is discussed.
2 FRETTING FATIGUE TEST SETUP
There are several works on full-scale and small-scale test setups for evaluating the fretting fatigue performance of components in different engineering fields. Small-scale tests are typically simpler, quicker, more economical, and enable parametric studies by simply changing the effective parameters. In small-scale tests, the specimen is usually fixed at one end and cyclically loaded at the other. A fretting apparatus is required to apply the contact force to the specimen. There are three common types of fretting apparatuses. The first type consists of floating bridge-type pads with one actuator or a ring.24, 25 The second type consists of fixed pads with an actuator on one side of the contact point and a mechanism for transferring the load to the other side of the contact point.26, 27 The third type has a separate actuator on each side of the contact point.28 In the first two methods, instead of using an actuator, the contact load can be applied mechanically by tightening threaded rods. The main idea from the second type setup was employed for the fretting setup in this work.
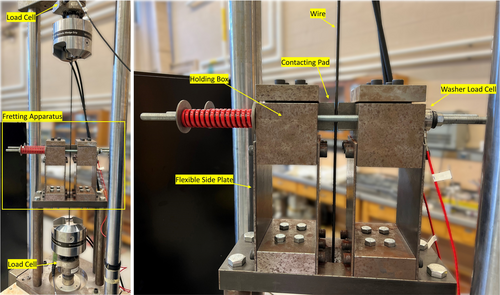
Figure 2 shows the test setup designed for the current study. At the contact points, two pads are in contact with the wire. Four bolts are used to clamp the pads to the holding boxes. The contact force is applied to the wire by tightening the two threaded rods that go through the boxes. The contact force is measured using two washer load cells. A spring is used on each rod to stabilize the contact force loading. Without springs, the contact force changes rapidly with tightening/loosening of the nuts. Therefore, reaching the target contact force can be challenging, and a very small amount of wear during the test can significantly decrease the contact force. Two thin plates are used to hold each box. These plates are designed to be horizontally flexible and do not attract significant lateral force with small amounts of wear during the tests. Two thick plates and four round bars are used to elevate the fretting apparatus and put it over the bottom jaw of the MTS machine. The bottom plate is bolted to the MTS frame. The MTS hydraulic testing machine is used to cycle the wire between the maximum and minimum stress. The top grip is fixed, and the axial load is applied to the wire at the bottom grip; one load cell at the bottom and another one at the top grip are used to measure the axial load. The difference between the measured loads at the top and the bottom can be later used to determine several parameters including coefficient of friction, frictional force, and slip displacement. Drawings of all test setup components can be found in Chehrazi.29
3 FRETTING FATIGUE TESTS
3.1 Test materials
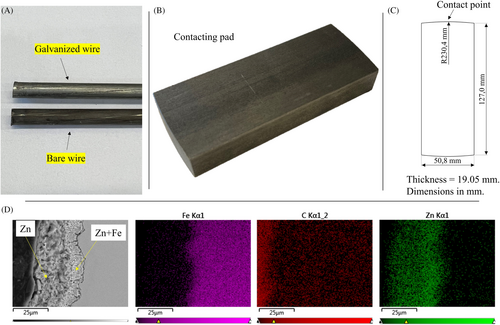
The straight central wires of seven-wire cable strands with and without galvanization were used for the fretting fatigue tests conducted in this study (see Figure 3A). The diameters of the bare and galvanized wires are 5.24 and 5.39 mm, respectively. The manufacturer reported guaranteed ultimate tensile strength (GUTS) of the strands is 1860 MPa. Two steel pads were used for each fretting fatigue test to simulate the saddle material. The steel pads (see Figure 3B) are machined from mild steel bars with a hardness of 89 HRB. Figure 3C shows the geometry of the pads. The pads have curvature at both ends and are in contact with the wire at the curved surfaces. The curved surfaces should be wear-free at the beginning of each fretting fatigue test as initial wear can affect the accuracy of tests. Therefore, each end of a pad was only used for one test. Having curvature at both ends of a pad is advantageous as it enables each pad to be utilized for two tests. This can be done by removing the pad after the first test and putting it back from the other end for the second test. The coating chemical composition map of the galvanized wires is shown in Figure 3D. Energy-dispersive spectroscopy is used for galvanized coating chemical composition analysis using 20 kV. The thickness of the galvanizing layer was found to be 25–30 μm.
3.2 Loading
According to fib,30 bridge cables in saddle systems should be cycled between a nominal maximum load level of 45% GUTS and a minimum load to result in a stress range of 200 MPa. Therefore, the wires were cycled between minimum stress of 637 MPa and maximum stress of 837 MPa for the first tests. However, to evaluate the effect of stress range on the fretting fatigue life, several tests were done with a stress range of 300 MPa and maximum stress of 837 MPa. To evaluate the effect of contact force, contact forces of 750, 1100, 1500, 3000, 4500, and 6000 N, were used in this study. The load is applied to the cable in three steps. First, the wire is loaded to the minimum stress, then the contact force is applied to the wire at the pinching point by tightening the bolts. Lastly, the cyclic load is applied to the wire with a frequency of 15 Hz.
3.3 Experimental results
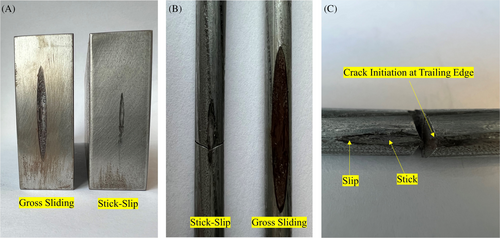
Figure 4 shows samples of specimens after fretting fatigue tests. Stick–slip and gross sliding regimes can be seen in this figure. The gross sliding regime occurred at the contact forces of 750 and 1100 N; a significant amount of wear can be seen in this regime. However, no specimens failed in this regime. The stick–slip regime was observed at higher contact forces; all fretting fatigue failures occurred in the stick–slip regime. Also, it was observed that the cracks typically initiate at the edge of the contact area, which is common in fretting fatigue tests (see Figure 4C).
The test results for the galvanized wires are shown in Figure 5A. Comparing the results for different contact forces at the stress range of 200 MPa shows that the fretting fatigue life initially decreases with an increase in the contact force. Then at 3000 N, the fretting fatigue life starts to increase. The same trend can be seen for the tests at the stress range of 300 MPa. However, the critical contact force is 4500 N, and the difference between the results is lower in comparison with the results for the stress range of 200 MPa. Furthermore, comparing the results for the stress ranges of 200 and 300 MPa shows that the fretting fatigue life significantly decreases with an increase in the stress range. This is a common trend in plain fatigue and fretting fatigue problems.
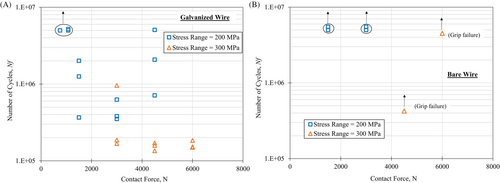
The results for the bare wire are shown in Figure 5B. Interestingly, none of the bare wire specimens failed in any of these tests; the tests were stopped at ~5 million cycles, with the exception of two tests that resulted in a grip failure. Fretting fatigue tests were first performed using the bare wires at the stress range of 200 MPa at contact forces of 1500 and 3000 N. While all of the galvanized wires failed at these sets of parameters, no failure was observed with bare wires. The stress range was then increased to 300 MPa, and two tests were performed at contact forces of 4500 and 6000 N. No fretting fatigue failures were observed for these tests with the bare wires either. However, as discussed earlier and shown in Figure 5A, all galvanized wires failed at the 300 MPa stress range, and these contact forces with a fretting fatigue life below 2·105 cycles.
The following paragraphs discuss the critical parameters in the fretting fatigue tests.
Table 1 summarizes the details of the measured parameters in the fretting fatigue tests.
| Test # | Wire type | Stress range (MPa) | Maximum stress (MPa) | Minimum stress (MPa) | Contact force (N) | Quasi-COF | Slip displacement (mm) | Test condition | Fretting fatigue life ( |
|---|---|---|---|---|---|---|---|---|---|
| 1 | Galvanized | 200 | 837 | 637 | 750 | — | 0.3555 | Gross sliding | +5,000,000 |
| 2 | Galvanized | 200 | 837 | 637 | 1100 | — | 0.2504 | Gross sliding | +5,000,000 |
| 3 | Galvanized | 200 | 837 | 637 | 1100 | — | 0.2391 | Gross sliding | +5,000,000 |
| 4 | Galvanized | 200 | 837 | 637 | 1500 | 0.6757 | 0.0408 | Stick–slip | 2,011,238 |
| 5 | Galvanized | 200 | 837 | 637 | 1500 | 0.6639 | 0.0410 | Stick–slip | 367,221 |
| 6 | Galvanized | 200 | 837 | 637 | 1500 | 0.6689 | 0.0390 | Stick–slip | 1,254,930 |
| 7 | Galvanized | 200 | 837 | 637 | 3000 | 0.3383 | 0.0392 | Stick–slip | 381,503 |
| 8 | Galvanized | 200 | 837 | 637 | 3000 | 0.3363 | 0.0392 | Stick–slip | 351,020 |
| 9 | Galvanized | 200 | 837 | 637 | 3000 | 0.3415 | 0.0381 | Stick–slip | 627,301 |
| 10 | Galvanized | 200 | 837 | 637 | 4500 | 0.2277 | 0.0381 | Stick–slip | 711,992 |
| 11 | Galvanized | 200 | 837 | 637 | 4500 | 0.2290 | 0.0382 | Stick–slip | 2,078,948 |
| 12 | Galvanized | 200 | 837 | 637 | 4500 | 0.2293 | 0.0368 | Stick–slip | 5,072,193 |
| 13 | Galvanized | 300 | 837 | 537 | 3000 | 0.5090 | 0.0587 | Stick–slip | 958,406 |
| 14 | Galvanized | 300 | 837 | 537 | 3000 | 0.5288 | 0.0571 | Stick–slip | 186,643 |
| 15 | Galvanized | 300 | 837 | 537 | 3000 | 0.5128 | 0.0575 | Stick–slip | 167,805 |
| 16 | Galvanized | 300 | 837 | 537 | 4500 | 0.3473 | 0.0551 | Stick–slip | 158,661 |
| 17 | Galvanized | 300 | 837 | 537 | 4500 | 0.3445 | 0.0557 | Stick–slip | 170,981 |
| 18 | Galvanized | 300 | 837 | 537 | 4500 | 0.3434 | 0.0568 | Stick–slip | 135,249 |
| 19 | Galvanized | 300 | 837 | 537 | 6000 | 0.2616 | 0.0547 | Stick–slip | 184,444 |
| 20 | Galvanized | 300 | 837 | 537 | 6000 | 0.2608 | 0.0548 | Stick–slip | 149,746 |
| 21 | Galvanized | 300 | 837 | 537 | 6000 | 0.2612 | 0.0552 | Stick–slip | 152,615 |
| 22 | Bare | 200 | 837 | 637 | 1500 | 0.6330 | 0.0413 | Stick–slip | +5,000,000 |
| 23 | Bare | 200 | 837 | 637 | 1500 | 0.6380 | 0.0414 | Stick–slip | +5,000,000 |
| 24 | Bare | 200 | 837 | 637 | 3000 | 0.3230 | 0.0355 | Stick–slip | +5,000,000 |
| 25 | Bare | 200 | 837 | 637 | 3000 | 0.3260 | 0.0359 | Stick–slip | +5,000,000 |
| 26 | Bare | 300 | 837 | 537 | 4500 | 0.3259 | 0.0519 | Stick–slip | +424,916 (Grip failure) |
| 27 | Bare | 300 | 837 | 537 | 6000 | 0.2470 | 0.0512 | Stick–slip | +4,513,843 (Grip failure) |
3.4 Coefficient of friction
The coefficient of friction, COF, is a critical parameter, which can significantly influence fretting fatigue behavior. Previous studies have also shown that it is a critical input for an FE-based analysis of fretting fatigue. Determining the COF in fretting fatigue problems is very complex. Several studies have shown that the COF increases during fretting fatigue tests because of wear accumulation and surface modification.31, 32 Also, it has also been discussed that the COF can be different at different points along the contact surface as each point can have a different amount of wear. Therefore, only an average COF can typically be reported in fretting fatigue tests.
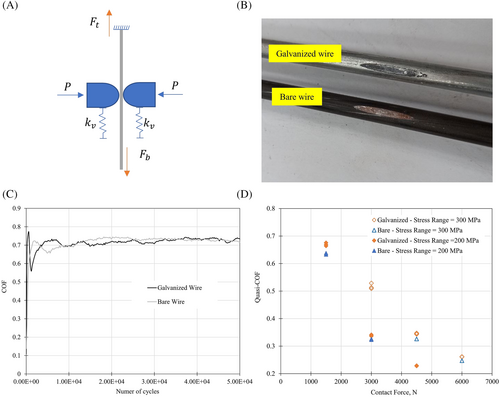
for the studied cases are shown in Figure 6D. It can be seen that increases with an increase in the stress range/slip displacement or a decrease in contact force. Jin and Mall33 showed a linear relationship between and slip displacement up to a critical slip, which is the transition point from stick–slip to the gross sliding regime. After that, this ratio is constant and is equal to the .
3.5 Frictional force
Figure 7A,B shows the changes in the frictional force during the fretting fatigue tests on the galvanized wires. It can be seen that the frictional force is very stable for the tests in the stick–slip regime (cases with contact forces ≥1500 N), and no fluctuation can be seen in this parameter. However, in the gross sliding regime (cases with contact forces of 750 and 1100 N), after a few thousand cycles, the frictional force starts to constantly decrease. One possible explanation for this decrease in frictional force is the high volume of wear and a corresponding reduction in the contact force in this regime. With the high volume of wear, the wire diameter along the contact force direction reduces, while the flexible side plates (shown in Figure 2) tend to stay vertical and may attract a portion of the load applied to the wire. Therefore, the real contact force acting on the wire may be lower than the starting value and the measurements on the washer load cell.
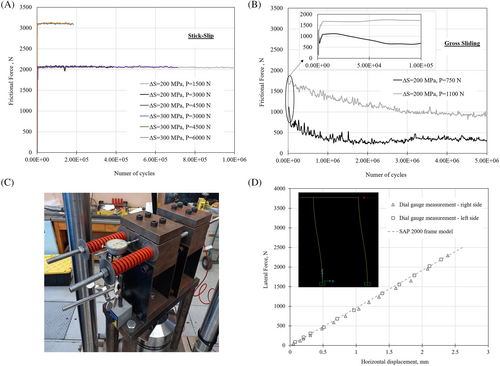
To ensure that the side plates are flexible enough and do not attract significant load for tests in the stick–slip regime, the side plates were loaded, and the horizontal displacement was recorded using a dial gauge (see Figure 7C). Furthermore, a 2D frame model was used to evaluate the stiffness of the fretting apparatus in horizontal and vertical directions. The measurement results versus the 2D frame model results are shown in Figure 7D. It can be seen that the results are very close; based on the 2D frame mode, the stiffness of the setup in horizontal and vertical directions was found to be 0.96 and 338 kN/mm, respectively. Based on the measurements of side plate movement during the tests, it was found that the contact force loss is 20–40 N for the tests in the stick–slip regime, which is not significant in comparison with the contact forces employed in these tests. However, for the three tests performed with a contact force lower than 1500 N (Tests #1, #2, and #3 in Table 1), a gross sliding regime was observed. The amount of wear was significant in these tests and resulted in a high reduction in contact force, and consequently, a high reduction in frictional force as can be seen in Figure 7B.
3.6 Slip displacement
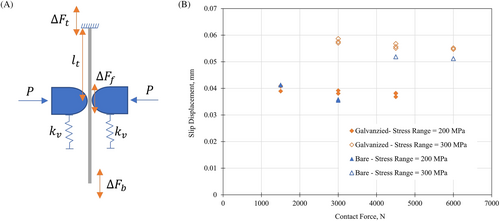
4 MATERIAL PROPERTIES
To better understand the differences in fretting fatigue performance between the bare and galvanized wires, tensile static and plain fatigue tests were performed to evaluate the possible differences between the core material of the galvanized and bare wires. For these tests, small hourglass samples machined from the central wire of the cables were used. Figure 9 shows a drawing of hourglass samples. After machining, the samples were polished using 240 and 400 grids wet and dry emery paper sequentially to get rid of deep machine marks on the surface of the samples. Following that, a longitude polisher was used to get a mirror-like surface and get rid of small cracks at the surface of wires (see Figure 9). All the samples were checked under a microscope to make sure they have smooth surfaces without any fine scratches.
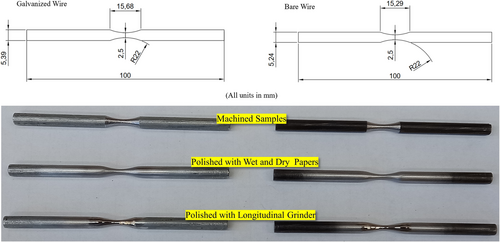
4.1 Tensile test results
Tensile tests were performed using the polished hourglass bare and galvanized samples in strain control. An MTS servo-controlled closed-loop electrohydraulic testing machine was used for the static and plain fatigue tests. An MTS diametral clip gauge was used to measure the strain of the deformed samples. Each of the arms attached to the clip gauge contains a notch at the end with a radius approximate to that in the gauge section of the wire samples. Elastic bands were wrapped around the gauge arms during a test so that the arms were tightly clamped on the sample to measure the spontaneous change in the diameter under loading.
Tensile test results are shown in Figure 10 for both wire types. The static material properties, listed in Table 2, were taken as the average of the three tests for each material. The yield and ultimate tensile strength of the wires are very close to each other. However, the galvanized wire has a higher fracture strain than the bare wire.

| Monotonic and cyclic properties | Unit | Galvanized wire | Bare wire |
|---|---|---|---|
| Elastic modulus | MPa | 195,351 | 207,044 |
| 0.2% offset yield strength, Sy | MPa | 1721 | 1756 |
| Ultimate tensile strength, Su | MPa | 2096 | 2147 |
| True fracture strain, 𝜀𝑓 | — | 0.395 | 0.128 |
| Final engineering stress | MPa | 1604 | 1997 |
| Fracture stress | MPa | 2284 | 2214 |
| % reduction in area | — | 29.29% | 9.71% |
| Cyclic yield strength (0.2% offset) | MPa | 1290 | 1236 |
| Cyclic strength coefficient, K′ | MPa | 2065 | 3498 |
| Cyclic strain hardening exponent n′ | — | 0.0812 | 0.1702 |
| Fatigue strength coefficient, σ'f | MPa | 2183 | 2675 |
| Fatigue strength exponent, b | — | −0.0657 | −0.0859 |
| Fatigue ductility coefficient, ε'f | — | 1.99 | 0.2067 |
| Fatigue ductility exponent, c | — | −0.8092 | −0.5047 |
4.2 Plain fatigue test results
Following the tensile tests, fully reversed (R = −1) fatigue tests were performed using polished hourglass samples. The fatigue tests were run under load control at a frequency ranging from 1 to 50 Hz. Stress range versus fatigue life results for the wires are shown in Figure 11A. The results are very close for both wires. However, it appears that the fatigue limit for the galvanized wire is slightly higher than the bare wires. Coffin–Manson parameters and cyclic material properties of both wire types are listed in Table 2. Cyclic properties have been determined based on the cyclic stress/strain curve. Coffin–Manson parameters in this table were determined by fitting two lines to elastic strain versus number of reversals data and plastic strain versus number of reversals data. Further detail on calculating these parameters can be found in a number of references (e.g., Dowling34). Figure 11B shows the typical fracture surface of the specimens. The long-life failures in bare wires are typically fish-eye failures, which show that the crack initiation started from the inside rather than the surface of the wires. While for the galvanized wires, typically the crack started from the surface of the wires.
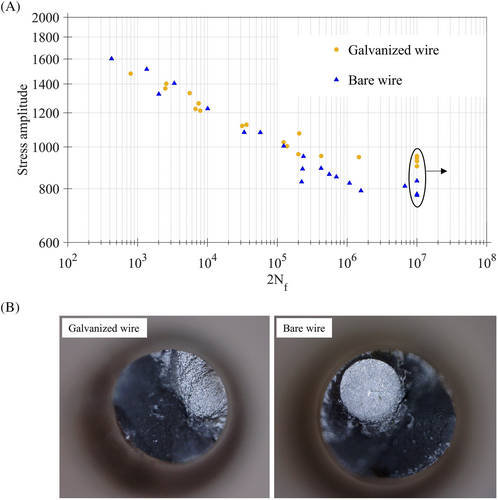
5 MICROSTRUCTURE ANALYSIS
Several studies have evaluated the effect of galvanization on the fatigue life of steel components. Bergengren and Melander35 studied the effect of galvanization thickness on the fatigue life of high-strength steel and showed that fatigue life decreases with an increase in galvanization thickness. This trend was explained by the propagation of the cracks from the galvanization layer to the substrate of steel, and a possible explanation for that was the penetration of zinc to the grain boundaries of steel. Vogt et al.36 showed that the fatigue life decreases over a threshold for the galvanization thickness. Sirin37 showed that galvanization can decrease the fatigue limit of AISI 4340 steel by 36.7%. This decrease was explained by brittle cracks in the zinc layer during the galvanization or in the early stages of fatigue loading. In the current paper, microhardness, and scanning electron microscope (SEM) photos of the wires are used to evaluate the differences between the microstructure of both wires.
5.1 Metallography sample preparation and microhardness tests parameters
The polished specimens were prepared based on the ASTM: E3 standard for microstructure observation. Metallographic preparation involved final polishing using 1-μm diamond suspension using standard polishing techniques and vibratory polishing was used for final polishing. A 2% Nital etchant was used to reveal the microstructure. A Clemex optical microscope and Zeiss LEO 1530 SEM were used for microstructure observation. Vickers microhardness testing was performed using a 500-g load and 10-s dwell time to produce mapping with 250-μm spacing using the Clemex hardness mapping system.
5.2 Microstructure analysis results
Figure 12 shows the microhardness test results for both bare and galvanized wires. These tests have been performed on the cross-section of the wires. A matrix of points from the surface to the middle of the wires was used to see the possible differences between the hardness at the middle and the surface of the two wires. A meaningful difference cannot be seen between the microhardness results at the points that are close to the surface and the points at the middle of the wire in the studied matrix. Looking at the results, it can be seen that the average microhardness of bare and galvanized wires is 578 and 557 HV, respectively. These results show that the bare wire is slightly harder than the galvanized wire, which may partly explain the difference between the fretting fatigue life of both wires as hardness is an important factor in fretting fatigue problems.
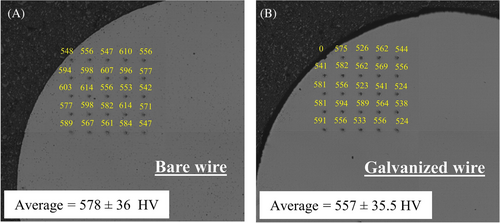
SEM photos of the microstructure of both wires can be seen in Figure 13. Looking at these photos, it can be seen that the bare wire has a uniform pearlite structure at the surface. However, the pearlite structure is broken in the galvanized wire, which can be due to the coating process of the wire. Broken carbide cluster structure and soft layers of ferrite can be seen at the surface of galvanized wire. Given the high stress concentration at the contact surface between the pads and the wires, it is hypothesized that the cracks can start growing after a smaller number of cycles in these non-uniform structures and then propagate to the core of the galvanized wires. The non-uniform microstructure may result in stress concentrations in the softer ferrite microstructure. In addition, the hard carbide clusters in the galvanized wire can also act as crack initiation sources during fatigue tests.38 It should be noted that these irregularities and defects were observed all over the surface of the galvanized wires and were not limited to certain locations.
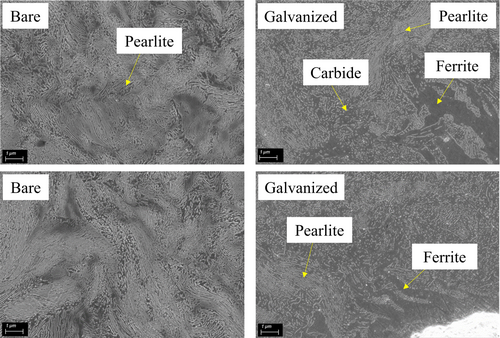
For the bare wire, the number of cycles required for crack initiation in the uniform pearlite structure can be very long. Therefore, for bare wire, the fatigue life may include significant crack initiation and propagation phases. However, for the galvanized wire with these defects at the surface, the fatigue life is dominated by crack propagation. Furthermore, if microcracks start to grow in the bare wire, they can be removed with small amounts of wear at the contact surface. In the galvanized wire, at the early stages, the cracks can easily grow in ferrite layers and broken carbide structure, and the wear is only removing the galvanized layer. In fretting fatigue problems, there is a competition between wear and crack propagation, and the zinc coating and the surface defects between the zinc layer and the core of the wire may promote earlier crack propagation.
Another observation from the SEM photos is the presence of subsurface pores in the bare wires (see Figure 14). Looking at the plain fatigue test results (Figure 11), the fatigue limit for the core of the galvanized wire was slightly higher than the core of the bare wire. Also, in the long-life region of the fully reversed plain fatigue tests, subsurface crack initiation, instead of the typical surface failure, was observed in the bare wire samples (see Figure 11). These subsurface pores might explain why the bare wire core material typically failed from the inside with a fish-eye fracture surface at slightly lower fatigue lives than the galvanized wire material. It should be noted that both galvanized and bare wires are typical cable wires used in cable-stayed bridges and have relatively similar properties. However, the material tests with hourglass samples in the previous part and the SEM photos showed that their core material is not completely the same. One significant difference is the presence of pores in the core of bare wires. These pores (or voids) can form during the pearlite transformation of steel material or during the drawing process of wires.39 As can be seen in Figure 11, the presence of the pores in bare wires reduced the fatigue limit of these wires in comparison with the galvanized wires. Therefore, extra attention should be given to the presence of voids in the wires.

In summary, the microstructure analysis in this section showed differences between the bare and galvanized wires. First, the microhardness of the galvanized wire is slightly lower than the bare wire. Second, the microstructure of the galvanized wire is not uniform and includes soft layers of ferrite and broken carbide structure, while the bare wire has a uniform pearlite structure at the surface. These differences between the microstructure at the surface can explain the difference between the fretting fatigue results in these two different wire types. Lastly, it was found that the bare wires have internal pores, which can act as potential crack initiation sites and explain the lower fatigue life in plain fatigue tests of the bare wire hourglass samples.
6 CONCLUSIONS
- A small-scale fretting fatigue test setup was designed and fabricated to evaluate the fretting fatigue life of bridge stay cable wires in contact with saddle supports.
- The fretting fatigue lives of bare and galvanized bridge stay cables are evaluated for different contact forces and stress ranges. Based on the results, it is concluded that the fretting fatigue life decreases with an increase in the stress range. Also, the fretting fatigue life decreases initially with an increase in the contact force. However, as the contact force further increases, the fretting fatigue life is also seen to increase.
- Hourglass samples were used to determine the material properties including static and cyclic parameters for two bridge stay cable wires, and the microhardness of the studied wires was determined. It was observed that the microhardness of the studied galvanized wire was slightly lower than the bare wire. The higher hardness of the bare wires may be a contributing factor to the better fretting fatigue performance of these wires in comparison with the galvanized wires.
- SEM photos showed defects at the surface of the galvanized wires and several pores inside the bare wire. The fretting fatigue tests suggest that surface defects due to the galvanization process can greatly decrease the fretting fatigue life of these wires.
- Plain fatigue tests using hourglass specimens showed that the bare wire has a lower fatigue limit. This could be explained by the observed pores inside the bare wires, which resulted in fish-eye failure of these wires with crack initiation from inside of the wire.
It should be noted that in an actual bridge, the benefits of wire galvanizing, in terms of increasing corrosion resistance, might far outweigh the potential costs, in terms of reduced fretting fatigue performance. In this study, the bare wire tests were performed primarily to see the effect of galvanizing on fretting fatigue performance. However, it is recognized that other considerations will surely come into play when selecting a wire material for a cable-stayed bridge.
Looking ahead, efforts are underway to use information obtained from small-scale wire fretting fatigue and materials tests, along with FE analysis, to predict the performance of a bridge stay cable saddle system. While further work will surely be necessary to refine and validate this approach, the eventual goal will be a significant reduction in the cost of developing and verifying the fatigue performance of new bridge stay cable saddle systems.
Nomenclature
-
-
- cross-sectional area
-
-
- fatigue strength exponent
-
-
- fatigue ductility exponent
-
- COF
-
- coefficient of friction
-
-
- elastic modulus
-
-
- the load measured at the bottom load cell of the test setup
-
-
- the load measured at the top load cell of the test setup
-
-
- the stiffness of the frames in the vertical direction
-
-
- cyclic strength coefficient
-
-
- cyclic strain hardening exponent
-
-
- the length of the wire between the upper grip and the fretting point
-
-
- the contact force at the contact point between the wire and pads
-
-
- the yield stress
-
-
- the ultimate tensile strength
-
-
- the load range measured at the top load cell
-
-
- the load range measured at the bottom load cell
-
-
- the frictional force range
-
-
- true fracture strain
-
-
- fatigue ductility coefficient
-
-
- fatigue strength coefficient
Open Research
DATA AVAILABILITY STATEMENT
The data that support the findings of this study are available from the corresponding author upon reasonable request.


