An experimental study on residual stress relaxation in low-cycle fatigue of Inconel 718Plus
Funding information: This study received no funding.
Abstract
Residual stress relaxation induced by the application of mechanical loads is determined by the nature of residual stress, the elasto-plastic material properties, and the type of applied load. Despite the importance of the first load cycle, analytical models available in the literature generally assumed residual stress relaxation as a continuous process. Residual stress induced by machining on Inconel 718Plus superalloy cylindrical specimens was measured before and after the application of load cycles under strain control. Low-cycle fatigue tests were carried out at room temperature for different strain amplitudes, and X-ray diffraction measurements were performed before and after 10 and 100 cycles. A comprehensive analytical model was derived to describe the relaxation process associated with the initial cycles and that associated with the continuous application of load cycle, which is based on the plastic strain energy per cycle W and requires the evaluation of parameters that are only dependent on the material and not on the strain amplitude.
1 INTRODUCTION
The residual stress induced by machining is essentially caused by the mechanical and thermal effects associated with the severe plastic deformations experienced by the material. When these effects are particularly relevant, the phase and metallurgical transformations are non-negligible. The interaction and level of these factors determine the resulting residual stress field.1 Two competitive phenomena result in a wide range of residual stress fields. The first one is a mechanical effect, which is essentially governed by strain hardening, whereas the second one can be considered a thermal effect, which originates from material softening at increasing temperature. By distinguishing the two effects and ignoring the thermal aspect, we can simplify the problem and better understand why residual stress occurs during machining. Considering only the mechanical effect, the material in the vicinity of the tip is initially deformed in compression during machining and then partially moved beneath the tool, resulting in superficial tensile plastic deformation. Consequently, the surrounding material tends to limit its inelastic deformation, generating a compressive residual stress state highly localized in the superficial layer. The thermal effect originating from the dissipative phenomena associated with the relevant plastic strain is also considered, which essentially consists of heat generation and the consequent local increase in the material temperature. Because plastic deformation determines a high thermal output in a thin superficial layer, the material suffers a relevant increase in temperature. If the temperature variation is particularly high and the mechanical properties are softened by the temperature, the material exhibits plastic deformation at high temperatures. When the temperature returns to room temperature, the thermal shrinkage generates a predominantly tensile residual stress.
No consensus has been reached in the literature regarding the relative contributions of mechanical and thermal effect during cutting. Several authors2-5 have shown that the mechanical effect is predominant, and the thermal effect becomes relevant at higher cutting speeds.6 However, by limiting the observation to high strength metallic materials, it can be found that the superficial residual stress induced by machining is tensile in some cases7-10 and compressive in others,11, 12 confirming that the final nature of the superficial residual stress is the result of contrasting phenomena.2, 13
The initial residual stress state can undergo relaxation due to the mechanical loads. Understanding and accurately quantifying residual stress redistribution under cyclic mechanical loads remains an important technical challenge.
The importance of relaxation after the first load cycle (quasi-static loading) was reported in the comprehensive literature reviews by James14 and McClung.15 When the initial residual stress was relaxed, specifically after the first load cycle, the application of further cycles may produce only a gradual relaxation, as reported in previous studies.16-18 In these cases, quasi-static and cyclic relaxation occur according to the von Mises yield criterion; the superposition of the initial residual stress and external load exceeds the local monotonic or cyclic yield stress of the material.19-21 These considerations derived from experimental measurements are consistent with the results obtained by the finite element method numerical models of the relaxation phenomenon. 22-24 In particular, the effect of the plasticization behavior of the material on the residual stress relaxation was found to be particularly evident after the first load cycle and negligible in subsequent load cycles. In certain cases,25-29 residual stress measured after load application was found to be higher than the initial residual stress, and in others, the compressive residual stress became tensile. This effect is mainly observed when bending fatigue loads are applied.23, 25, 27 Other studies have considered the residual stress relaxation originating from constant and variable amplitude fatigue loads30 and determined how the process is affected by the material characteristics and surface hardening state.17, 31 The importance of the relaxation near the crack tip was also considered.32, 33
This phenomenon was analyzed also from a microscopic perspective by Qian et al. in three different types of steel.34 The authors proposed a relaxation model based on the principle of creep dislocation movement individuating the three relaxation regimes as a function of the applied stress. Xie et al.,35 in agreement with Morrow and Sinclair,36 attributed the amount of relaxation to the plastic strain accumulation with the number of cycles. Concerning this aspect, relaxation can only occur if there is some degree of plasticity in the reverse loading, both in tension and compression.37 In a recent study,38 the authors analyzed the circumstances under which continuous relaxation could arise. They concluded that a continuous residual stress modification is possible if the production of new plastic strain takes place in both the loading and reverse loading parts of a cyclic loading. They further determined that the relaxation at a small load is limited to the first cycle depending on whether the stress ratio is positive or negative. In contrast, continuous relaxation occurs if the load is sufficiently high and the stress ratio is negative.
The significance of considering the influence of the cold working rate on different volumes of material and its influence on the local material properties and therefore on the role of gradient properties on the relaxation mechanism has been demonstrated in previous studies.39, 40 This is particularly true for all residual stress fields concentrated in a superficial layer, such as those introduced by shot peening, general surface mechanical treatments, and machining. These treatments and manufacturing phases introduce cold work in the surface layer, producing a local yield strength gradient. In particular, tensile cold working increases the tensile yield strength on the surface but reduces the compressive yield strength owing to the Bauschinger effect. Consequently, the surface layer, where compressive residual stress is introduced, easily reaches the yield limit and relaxes the residual stress.
This study focuses on the phenomenon of relaxation of residual stress induced by machining in a nickel-based superalloy, characterized by superior mechanical properties at room and at elevated temperature. This class of materials is widely used to realize high-value components subjected to particularly heavy thermal and mechanical load conditions. An improvement in the mechanical behavior of such components could lead to valuable economical and technical advantages.
This study aims to describe how the chip-forming residual stress induced by machining in a nickel-based superalloy is modified by applying a fatigue load cycle under strain control at different amplitudes. Based on experimental observations, a two-stage process has been proposed for the evaluation of the residual stress relaxation. Furthermore, identifying in plastic strain energy per cycle is a suitable parameter to define an analytical model for predicting the phenomenon in the considered class of material.
1.1 Residual stress relaxation models
Semi-empirical models have been developed to predict residual stress relaxation based on experimental assessments.16, 36, 41, 42 Relaxation is considered a continuous and gradual process that ideally occurs for the entire life of the component. In several cases, the authors recognized the importance of relaxation during the first load cycle but explicitly declared that this phenomenon was not covered by their proposed model.16, 36 Relaxation models are characterized by a common framework consisting of relatively simple analytical formulations, in which the main relevant parameters (initial residual stress, applied stress/strain amplitude, number of cycles, and cyclic hardening/softening behavior) are arranged with empirical factors to obtain a good fit with the experimental data. Therefore, the need to determine these empirical factors produces a lack of generality in these relaxation models, which are not directly applicable to cases that differ from those used for developing them.
These few examples are based on simple analytical relations; however, they lead to prediction that could be very different. Moreover, a common framework does not exist, and it is difficult to define a general model of the residual stress relaxation, which is still a complex phenomenon. In several cases, only qualitative indications can be derived, and the proposed models are often inapplicable to different experimental conditions. To overcome these difficulties, the use of plastic strain energy per cycle as an indicator of residual stress relaxation was considered in this study.
2 MATERIALS AND METHODS
Superalloys are extensively used in the aeronautical and aerospace fields, mainly for turbines and compressors production, because of their high resistance at operating temperature. The polycrystalline superalloy Inconel 718Plus could be used for turbine disk applications, because of its high-temperature strength, good corrosion resistance, and excellent workability.
Inconel 718Plus is a precipitation-hardened nickel-based material that is normally subjected to thermal treatment, which consists of double vacuum melting or triple melting. The first process ensures a good degree of microcleanliness and tight compositional control. Triple melting minimizes the possibility of macrosegregation and enhances microcleanliness.43-45
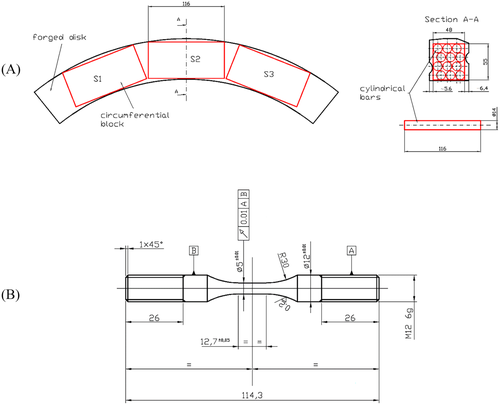
The analyzed specimens were obtained from a larger part of the forged disk using Electric Discharge Machining. After having cut three circumferential blocks, each block has been used to obtain a certain number of cylindrical bars having a diameter of 14 mm (Figure 1A). Finally, the bars were chip formed to obtain the typical geometry of the Low-Cycle Fatigue specimens, according to the ASTM E606 standard (Figure 1B). In this manner, all specimens were oriented in the circumferential direction with respect to the original forged disk. The specimens had a final diameter of 5 mm and a gauge length of 12.7 mm to prevent elastic instability. As the specimens were obtained from an Inconel 718Plus bar by turning, a residual stress state was introduced on the surface layer.
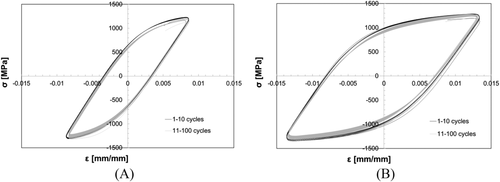
Low-cycle fatigue tests were performed using a servo-hydraulic test machine MTS810, with a load capacity of 100 kN. Triangular ramps were imposed in strain control at a frequency of 0.1 Hz to prevent specimen overheating. An axial extensometer with a gauge length of 10 mm was used to measure the longitudinal strain during tests. During the tests, the load and applied strain were acquired at 50 Hz to reconstruct hysteresis cycles. The level of the applied strain εa ranged from 0.76% to 1.33%. All tests were suspended after 10 and 100 cycles to measure the residual stress using X-ray diffraction. Finally, the test was continued up to failure, identified by a 10% drop of the maximum load of the stabilized cycle.
Residual stress in the longitudinal and circumferential directions was evaluated using X-ray diffraction in the as-machined specimens and after the application of 10 and 100 fatigue cycles to determine the residual stress relaxation. The X-ray diffraction measurement technique was selected because it is a non-destructive technique that allows the mechanical test to be suspended, and residual stress measurements can be carried out without introducing any change in the specimen geometry. The limitation of this technique is that measurement is possible only on the surface of the specimen.46 The evaluation of the in-depth residual stress is, however, a feasible means to remove a thin layer of the material by electropolishing, without altering the surroundings residual stress. This possibility has not been considered in this study because the relevant residual stress introduced by machining is on the surface, and second, the residual stress profile over depth, independent of its surface value, goes rapidly to zero.9, 47
A Rigaku ULTIMA IV diffractometer was used in the iso-inclination configuration with a Cu source (λ = 1.540562 ang.), spot size of 1 mm, voltage of 40 kV, and amperage of 40 mA. A collimator with a diameter of 1 mm was used to reduce the error induced in the circumferential direction by specimen curvature. Using a Cu source on Inconel 718, the Bragg angle 2θ = 90.4°, and the microscopic elastic constant (E/[1 + ν]) = 140 GPa.41 Under these measurement conditions, the residual stress measurement must be referred to a superficial layer of approximately 0.005 mm. For each measurement, six scans were performed for six different ψ angles, chosen in the range 0° to 30° to ensure that the values of sin2ψ are evenly spaced. The diffraction peak position was evaluated using the center of gravity method, followed by filtering and reduction of data scatter.
3 RESULTS
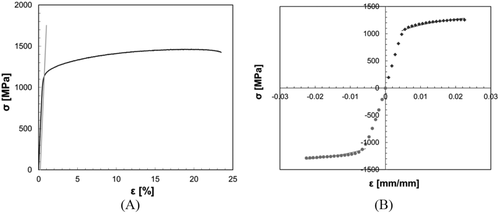
3.1 Static and fatigue results
| Tensile strength σR [MPa] | Yield stress σy [MPa] | Elastic modulus E [MPa] | Elongation at break A [%] | Strength coefficient K [MPa] | Strain hardening exponent n | Cyclic strength coefficient K′ [MPa] | Cyclic strain hardening exponent n′ |
|---|---|---|---|---|---|---|---|
| 1462 | 1136 | 219,160 | 23.5 | 1666.2 ± 1.00 | 0.0742 ± 0.0003 | 2079.1 ± 1.05 | 0.127 ± 0.0104 |
| Specimen | Strain amplitude εa [%] | Number of cycles to failure Nf | Stress amplitude σa [MPa] | Mean stress σm [MPa] | Tangent modulus ENT [MPa] | Elastic strain amplitude εael [%] | Plastic strain amplitude εapl [%] |
|---|---|---|---|---|---|---|---|
| 29G | 0.760 | 2111 | 1034.4 | 21.1 | 207,364 | 0.472 | 0.288 |
| 27G | 0.900 | 645 | 1110.7 | −25.0 | 220,936 | 0.507 | 0.393 |
| 21F | 1.000 | 337 | 1142.3 | −37.8 | 205,819 | 0.521 | 0.479 |
| 22F | 1.100 | 269 | 1189.5 | −24.1 | 207,560 | 0.543 | 0.557 |
| 23F | 1.200 | 374 | 1216.1 | 2.8 | 175,538 | 0.555 | 0.645 |
| 24F | 1.250 | 374 | 1164.1 | 4.6 | 188,151 | 0.531 | 0.719 |
| 25G | 1.330 | 167 | 1242.7 | −3.9 | 187,290 | 0.567 | 0.763 |
| Static | 6.2239 | 1 | 0.8143 | 5.4096 |
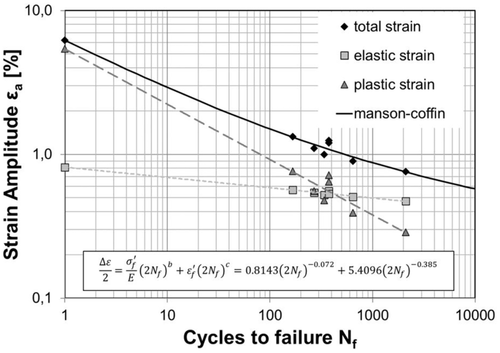
3.2 Residual stress results
Residual stress measurements in the longitudinal direction were characterized by a very low data dispersion of the sin2ψ straight line, confirming the reliability of the measurements, although the surface was not flat owing to the curvature of the specimen. As the effect of curved surface produces an asymmetry of the diffraction peak,51 the peak position evaluated by the center of gravity method differs from the maximum peak intensity. In the longitudinal direction, the difference between the two estimated peaks fell within 0.5%, which is considered acceptable. On the contrary, the high curvature of the specimen surface in the circumferential direction determined the difference in the peak position higher than 0.5% in a limited number of cases. Therefore, these data were discarded during the data-elaboration process. Table 3 lists the longitudinal and circumferential residual stress values σL(N) and σC(N) for each specimen, where the parameters N = 0, 10, and 100 indicate the number of load cycles applied before the residual stress evaluation. The scatter of the residual stress measurements was acceptable, considering the experimental difficulty in carrying out a correct measurement on the curved surface of the specimen. The NR (Not Reliable) measurement indicates the uncorrected evaluation of the sin2ψ straight line. The initial residual stress was compressive in both the longitudinal and circumferential directions suggesting that the residual stress field that originated from machining, as a result of the material properties and typical cutting parameters adopted, was dominated by the mechanical effect, as discussed in the section 1. The residual stress was higher in the longitudinal direction with exceptions in two cases. In general, the initial residual stress, especially in the longitudinal direction, can be considered fairly uniform between different specimens, which is a preferable prerequisite for the scope of this work.
| Specimen | Strain amplitude εa [%] | Longitudinal residual stress after N cycles σL (N) [MPa] | Circumferential residual stress after N cycles σC (N) [MPa] | ||||
|---|---|---|---|---|---|---|---|
| σL(0) | σL (10) | σL(100) | σC(0) | σC (10) | σC(100) | ||
| 29G | 0.76 | −414 (±189) | −545 (±73) | NR | −213 (±219) | NR | NR |
| 27G | 0.90 | −437 (±163) | −563 (±116) | −357 (±139) | −650 (±56) | −245 (±88) | −649 (±72) |
| 21F | 1.00 | −507 (±140) | −475 (±95) | −585 (±157) | −646 (±54) | −220 (±83) | N.R. |
| 22F | 1.10 | −673 (±270) | −364 (±27) | −267 (±141) | −402 (±40) | −541 (±71) | −715 (±104) |
| 23F | 1.20 | −796 (±85) | −163 (±77) | −164 (±50) | −314 (±44) | −277 (±73) | −317 (±61) |
| 24F | 1.25 | −615 (±133) | −29 (±65) | −56 (±61) | −186 (±78) | −367 (±47) | NR |
| 25G | 1.33 | −665 (±165) | −185 (±48) | −2 (±54) | NR | −188 (±104) | NR |
4 DISCUSSION
The analysis of the relaxation phenomenon was restricted to the longitudinal residual stress, which is directly involved in the relaxation phenomenon because it is aligned with the direction of the applied load. In fact, the circumferential residual stress did not show a particular evolution trend with respect to the number of cycles. This is an expected behavior, as it is evident that applying a tensile load could produce a relaxation of the residual stress especially in the longitudinal direction. On the other hand, the circumferential residual stress measurements do not provide sufficient reliability to derive valid observations from a curved surface.
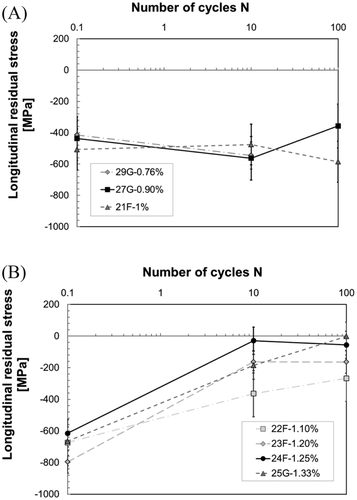
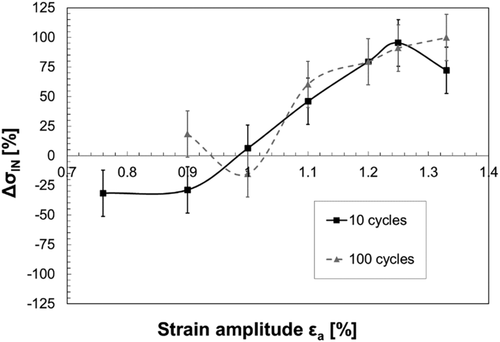
- Residual stress relaxation appears only if the applied load condition is above a threshold value, expressed by a threshold strain amplitude εa,th, which has been previously identified and derived from the static behavior of the material (Equation 7).
- Residual stress relaxation is concentrated in the first 10 cycles, most likely in the first cycle, as observed in several works in literature.
- Residual stress relaxation continues after the first 10 cycles, even if this phenomenon is minimal with respect to the initial one, and the continuous relaxation after the first 10 cycles cannot be neglected especially for higher strain amplitudes.
Consequently, residual stress relaxation must be regarded as a two-stage evolution, activated only if a threshold stress–strain state is achieved. Moreover, each stage of relaxation can potentially be governed by different load cycle parameters.
The model proposed in this study describes this two-stage process based on the evolution of hysteresis cycles against the number of cycles. The availability of the complete fatigue data of each specimen, which allows the reconstruction of all hysteresis cycles, makes it possible to discuss the relaxation phenomenon from an energy perspective. Considering a specific load cycle, the hysteresis area can be obtained by plotting the measured stress against the applied strain. The area W represents the plastic strain energy of a unitary material volume, which is evaluated through a numerical integration of the 500 experimental stress–strain datasets available per cycle. This value is averaged over the cylindrical volume corresponding to the gauge length of the extensometer and is referred to as the specific cycle considered. The plastic strain energy per cycle W has a relatively long tradition as a damage parameter to determine the fatigue behavior in several conditions.53 In addition, the specific thermal energy per cycle Q was proposed by Meneghetti et al.54 as a fatigue damage parameter.
- Specimens tested at higher strain amplitudes revealed an important reduction of the plastic strain energy W concentrated in the first 10 cycles. The reduction was quite regular and uniform; however, in two cases, the reduction was concentrated between two subsequent cycles, not necessarily in the initial phase.
- The trend of the plastic strain was regular and uniform between 10 and 100 cycles. Furthermore, a reduction was associated with specimens tested at higher strain amplitudes, which seemed to disappear at lower strain amplitudes. Finally, the rate of decay was proportional to the applied strain amplitude.
- The slope of the intermediate curves between 10 and 100 cycles was high at the maximum strain amplitude and decreased with a decrease in the strain amplitude εa.
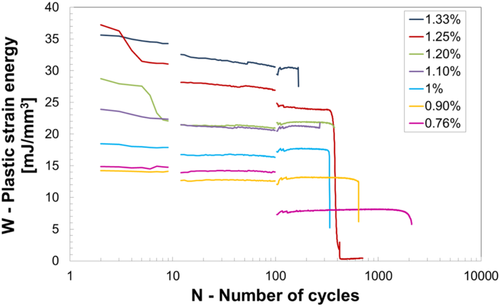
This hypothesis was confirmed by the experimental data reported in this study, as shown in Figure 8. However, Equation (9) was obtained using the data from cycle 2, which ignore the transient effect of the test control; however, the relaxation is governed by the plastic strain energy associated with the first reliable cycle.
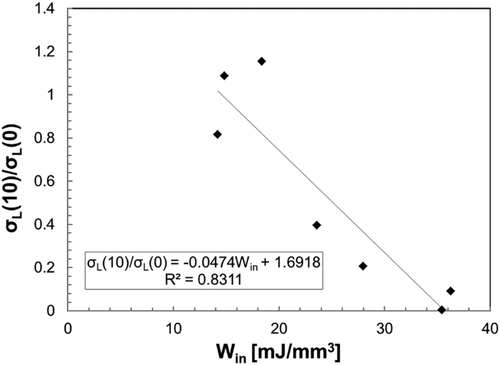
The second stage corresponds to the continuous relaxation associated with the application of several cycles. Practically, all the models proposed in the literature are concerned with this stage. In this phase, the amount of relaxation can be associated with the rate of change in the hysteresis cycles. As previously observed, the slope of the intermediate curves between 10 and 100 cycles (Figure 8) was high at the maximum strain amplitude. Moreover, it decreased with a decrease in the strain amplitude εa until the trend appeared horizontal for the test performed below the threshold value εa,th. This behavior can be quantified by calculating the absolute value of the plastic strain energy variation over 10 and 100 cycles (Figure 9). Accepting the hypothesis that the relaxation mechanism could be activated above a threshold value of the strain amplitude, it is reasonable to consider that the other mechanical parameters associated with that specific strain level, such as the plastic strain energy W, could act as a threshold value. Relaxation is absent when this parameter falls below the threshold value, whereas a higher relaxation amount corresponds to a higher variation in plastic strain energy. A threshold value for plastic strain energy can be determined by fixing the value of the plastic strain energy W10th measured in correspondence with the test with strain amplitude εa = 1%, which is the nearest to the threshold value εa,th = 1.09% derived from the Ramberg–Osgood model (Equation 7). This choice allows the establishment of a threshold value for the plastic strain energy that can be evaluated simply by determining the monotonic curve of the material.
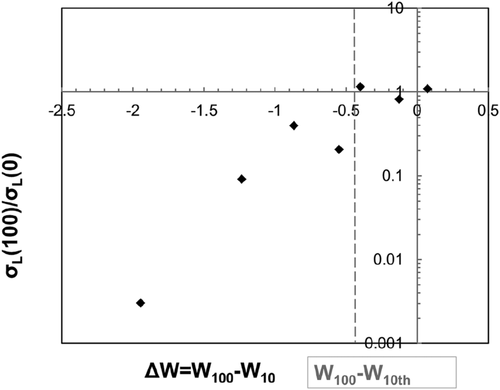
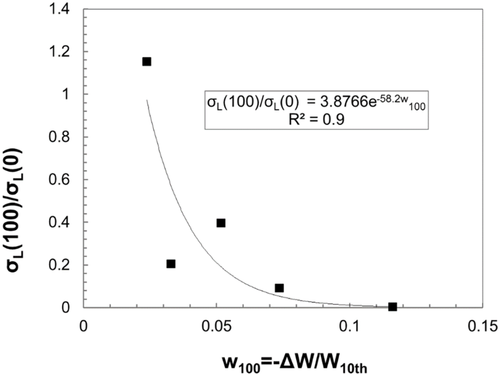
Applying Equation (11) to the experimental data reported in this study and considering only the specimens that were tested above the threshold strain amplitude, a good correlation of the data was obtained (Figure 10).
5 COMPARISON WITH ALTERNATIVE RESIDUAL STRESS RELAXATION MODELS
The experimental data reported in this study were used to validate the alternative models proposed in the literature. This allows comparison of the approaches especially with respect to their generality and the effective possibility of evaluating the material parameters involved. The models reported in the literature have been developed using theoretical considerations and experimental data that differ in terms of material, nature of residual stress, and applied load. Therefore, direct application of these models to general cases is not feasible. Another complication is the need to calculate specific parameters, which are often used in the models to obtain good agreement with the experimental data. However, the aim is to highlight the peculiarities and disadvantages of the most common models.
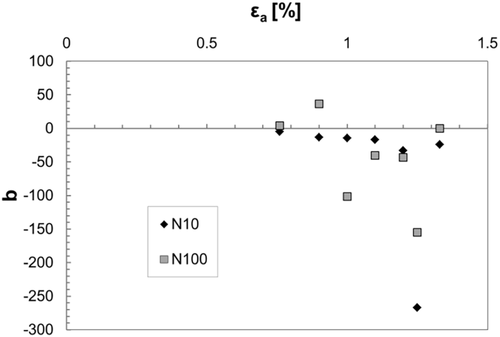
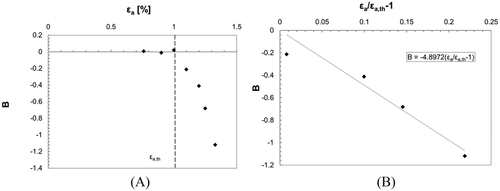
After determining parameter B, the model proposed by Jhansale and Topper can be used to predict residual stress relaxation for the experimental data of this study, with the strain amplitude threshold considered. Figure 13 clearly shows that the prediction values of this model were comparable to the experimental values. In this case, parameter B is dependent not only on the material but also on the strain amplitude, even if a simple correlation with the applied strain exists.
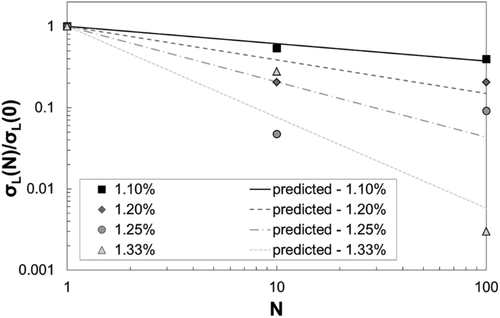
In summary, the residual stress relaxation reported in this study cannot be described using the model proposed by Morrow and Sinclair but is coherent with the model proposed by Jhansale and Topper, which was modified to consider the existence of a strain amplitude threshold for activating the relaxation process. However, both models require the derivation of experimental parameters for each applied strain amplitude, resulting in a poor generality.
6 CONCLUSIONS
In this study, the residual stress relaxation phenomenon, following the application of cyclic load in the low-cycle fatigue regime, was analyzed based on data derived from a series of experimental tests carried out on Inconel 718Plus round specimens.
- Relaxation occurs only if the threshold value of the stress–strain state is reached. This threshold condition can be evaluated based on the static curve of the material.
- A two-stage relaxation process was observed owing to the availability of residual stress data after 10 and 100 cycles. The existence of two distinct relaxation stages was assumed as a starting point for defining a unique coherent model based on the evolution of the plastic energy per cycle W. The two-stage relaxation process has the merit of appropriately considering all the qualitative factors reported in the literature. Relaxation was considered a continuous phenomenon, governed by analytical formulation depending on the number of cycles N, integrated by the ascertainment that the relaxation is mainly concentrated in the initial cycles.
- The two-stage relaxation model was successfully described using the plastic strain energy per cycle W, relating the amount of the residual stress relaxation to the initial extension of the hysteresis cycle Win through a linear relation in the first stage and to the normalized decay of plastic strain energy w100 in the second stage.
- The proposed model has been proven to provide an accurate quantification of the residual stress relaxation by adopting parameters that are only dependent on the material and not on the strain amplitude.
ACKNOWLEDGEMENTS
Open Access Funding provided by Universita del Salento within the CRUI-CARE Agreement.
CONFLICT OF INTEREST/COMPETING INTEREST
The authors have no conflicts of interest to declare.
AUTHOR CONTRIBUTIONS
Conceptualization and methodology R.N.; experimental test M. De G. and R.N.; resources and supervision V.D.; data curation R.N.; writing—original draft preparation M. De G. and R.N.; writing—review and editing R.N.
All authors declare that the work described has not been published before; it is not under consideration for publication anywhere else, and its publication has been approved by all co-authors, as well as by the responsible authorities—tacitly or explicitly—at the institute where the work has been carried out.
Nomenclature
-
- A, m
-
- parameters of the Kodama model
-
- A, β
-
- parameters of the proposed model
-
- b
-
- parameter of the Morrow–Sinclair model
-
- b, c
-
- parameters of the Manson–Coffin relationship
-
- B
-
- parameter of the Jhansale–Topper model
-
- E
-
- Young's modulus
-
- ENT
-
- tangent modulus
-
- K
-
- strength coefficient
-
- K′
-
- cyclic strength coefficient
-
- n
-
- strain hardening exponent
-
- n′
-
- cyclic strain hardening exponent
-
- N
-
- number of applied cycles
-
- Nf
-
- number of cycles to failure
-
- p, q
-
- parameters of the proposed relaxation model
-
- Q
-
- specific thermal energy
-
- R
-
- load ratio
-
- sin2ψ
-
- angular orientation of diffraction peaks
-
- w100
-
- normalized plastic strain energy at the 100th cycle
-
- W
-
- plastic strain energy per cycle
-
- W10
-
- plastic strain energy at the 10th cycle
-
- W100
-
- plastic strain energy at the 100th cycle
-
- W10th
-
- threshold plastic strain energy of the 10th cycle
-
- Win
-
- plastic strain energy of initial cycles
-
- 2θ
-
- Bragg angle
-
- Δεe
-
- elastic strain range
-
- Δεp
-
- plastic strain range
-
- Δσ
-
- stress range
-
- ε
-
- strain
-
- εa
-
- strain amplitude
-
- εael
-
- elastic strain amplitude
-
- εapl
-
- plastic strain amplitude
-
- εa,th
-
- threshold strain amplitude
-
- εe
-
- elastic strain
-
- εf′
-
- true strain fracture
-
- εp
-
- plastic strain
-
- σa
-
- stress amplitude
-
- σC(0), σC(10), σC(100), σC(N)
-
- circumferential residual stress at 0, 10, 100, and N cycles
-
- σL(0), σL(10), σL(100), σL(N)
-
- longitudinal residual stress at 0, 10, 100, and N cycles
-
- σf′
-
- fatigue strength coefficient
-
- σm
-
- mean stress
-
- σm1
-
- mean stress during the first cycle
-
- σmN
-
- mean stress during the Nth cycle
-
- σNre
-
- residual stress after N cycles
-
- σR
-
- tensile strength
-
- σy
-
- yield stress
-
- ν
-
- Poisson's ratio
Open Research
DATA AVAILABILITY STATEMENT
The experimental data presented in this study are available upon request from the corresponding author.


