Edge tracing technique to study post-necking behavior and failure in Al alloys and anisotropic plasticity in line pipe steels
Funding information: Université Paris-Saclay, CEA; GRTgaz, RICE; Chair ANR, Grant/Award Number: Messiah project: ANR-20-CHIN-0003
Abstract
The recently developed edge tracing (ET) method allows to estimate the radial deformation in axisymmetric tensile specimens via analysis of digital images recorded during the experiments. Images are processed to detect the sample's contours and therefore estimate the minimal cross-section diameter. This technique was mainly developed to characterize the plastic behavior well beyond the necking strain. The aim of this work is to apply the ET method to two novel case studies. Firstly, the post-necking behavior and failure of a low ductility Al alloy are investigated. Low ductility alloys tend to fail brutally after reaching the maximum load. The major result is the capture of the sharp load drop which allowed to calibrate parameters of a GTN damage model. Secondly, the anisotropic elastic–plastic behavior of a “vintage” line pipe steel is characterized by a direct measurement of the Lankford coefficient. Assembled experimental data allowed to model the anisotropic plasticity beyond necking in different loading directions.
Abbreviations
-
- AA
-
- aluminum alloy
-
- ET
-
- edge tracing
-
- GTN
-
- Gurson–Tvergaard–Needleman model
-
- NT
-
- notched tension sample
-
- ST
-
- simple tension sample
1 INTRODUCTION
Engineering problems modeled by the finite element method require in some cases sufficient information about the large deformations occurring in the material. Metal forming and ductile failure are perfect examples of cases that necessitate the material's response prior and beyond the necking strain.1, 2 Tensile tests carried out on round dog bone simple tensile (ST) samples provide the material's engineering stress–strain curve. During testing, diffuse necking occurs as the plastic deformation is localized in a thin ligament called the “neck.” At this phase, the stress triaxiality increases in the neck. The output stress–strain curve must then be corrected to obtain a full true stress–logarithmic strain curve. The most commonly used correction equation is proposed by Bridgman3 and is modified by Bao and Wierzbicki.4 Other authors as Tu et al.,2, 5, 6 Versaillot et al.,7 Bao and Wierzbicki,8 Bai et al,9 and Mirone10 point out the fact that the Bridgman correction leads to significant errors. Therefore, they develop other analytical corrections to obtain the true stress–logarithmic strain curve.
Zhang et al11 propose to use round notched tensile (NT) bars as an alternative method for the assessment of the material's behavior at large strain. Diameter reduction can be recorded by a radial extensometer located at the specimen's minimum cross section.
The difficulty of this setup is to assure that the extensometer does not slide so that the measurements are continuously taken at the minimum cross section. Moreover, the extensometer knife-edges may damage the notch surface and affect the test results.12 The cited authors apply the above explained experimental procedure using radial extensometers to obtain load–diameter reduction curves in welded joints in a high strength 690 MPa structural steel. The true stress–strain curves are then obtained using a correction factor on the net stress. The correction factor is a function of the notch geometry and the maximum recorded load.
Later, Hopperstad et al.,13 Vilamosa et al,14 and Tu et al2, 15 proposed the edge tracing (ET) method to obtain the diameter reduction of ST and axisymmetric NT specimens via analysis of digital images taken during the experiment. Digital camera(s) are used to take pictures which are each associated to the corresponding load. Each image is analyzed separately by simple algorithms to correlate the given load to a radial deformation calculated by detecting the smallest cross-section diameter in the notch. Each pixel in the 8 image represents a gray value ranging from 0 to 255. The specimen contour can be detected only if a sharp contrast is maintained between the specimen and the background. Accordingly, the section reduction is calculated at the output. More technical details concerning the method are given in the following section.
The ET method is used in tensile testing in the literature by several authors to study the plastic behavior of different materials. Firstly, Hopperstad et al13 investigate the effect of strain rate and stress triaxiality on the elastic–plastic flow of Weldox 460 E steels. Only one camera is used in this work to take images of the samples from a single angle. Secondly, Tu et al.2, 15 study the effect of low temperature (−60°C) on the strain at failure of a 420 MPa structural steel. For the first time, images of the samples are taken from different viewing angles using a two-mirror system. Thirdly, Defaisse et al16 focus on the identification of the elastic–plastic behavior of a ML340 ultra high strength steel. Unlike the subpixel method proposed in this study, the cited authors use a pixel resolution which results in less accurate measurements. Lastly, Kondori et al17 analyze the anisotropic plastic behavior of a magnesium alloy. The cited authors use the same pixel method use by Defaisse et al16 to estimate the average measured diameter prior necking to evaluate the volume change in the sample. The ET method is not limited to applications mentioned above. However, it can be extended to study the evolution of the Lankford factor (in materials that undergo anisotropic plasticity) as a function of strain. To illustrate, Fourmeau et al18 and Khadyko et al19 study the evolution of the plastic anisotropy in 7xxx and 6xxx aluminum alloys respectively. The cited authors do not use the ET method explained above. However, they use two perpendicular lasers fixed on a mobile frame to continuously measure the minimum cross-section diameter. Unlike the ET method, the laser method gives a diameter measurement and not the whole sample's profile. The latter gives information regarding the evolution of the notch radius as a function of strain.
- The post-necking behavior of low ductility aluminum alloys is investigated via a combination of deformation controlled tensile testing together with the ET method. The post-necking behavior of the studied aluminum alloys is extremely hard to analyze since the material tends to fail rapidly after reaching its maximum bearing load. The post-necking phase is crucial for failure assessment. The Gurson–Tvergaard–Needleman (GTN) damage model cannot be evaluated on stress–strain curves if the post-necking phase is missing. It is known that identifying parameters of the GTN model on experimental data is a challenging problem.20, 21 This case study confirms the importance of deformation controlled tensile testing to obtain the post-necking phase and the usefulness of this phase in the calibration of the GTN failure parameters.
- The anisotropic plastic behavior of a vintage line pipe steel is studied. Steels can undergo a hot/cold rolling process to obtain the desired shape and dimensions. During the rolling process, a specific crystallographic texture can emerge which leads to an anisotropic plastic behavior. The anisotropic plastic behavior of line pipe steels is usually investigated on fracture surfaces of tensile samples. One has no idea if the Lankford factor evolves during plastic deformation. The lack of information regarding the anisotropic plastic behavior of steels makes it challenging to model the material's elastic-plastic behavior which is an essential preliminary step before modeling the material's fracture behavior. This case study shows how the ET method can be used to investigate the evolution of plastic anisotropy during plastic strain.
In the following section, the testing apparatus is described as well as the image analysis process. In the third section of this paper, a case study on failure assessment in a 6061-T6 aluminum alloy is carried on NT specimens using the ET method. NT specimens can cover a wide range of stress triaxiality levels (0.6–2.0) that can be used to calibrate damage models. The chosen alloy has a challenging feature: its brief necking phase (i.e., failure occurs brutally after reaching the maximum force). In the fourth section of this paper, a case study is carried on a X52–API grade steel to highlight the ET method's advantages in determining the anisotropic plastic behavior of textured materials. Parameters of a plastic flow law with an anisotropic criterion are determined by the analysis of the tensile tests prior the onset of failure.
2 SPECIMENS AND EXPERIMENTAL TECHNIQUES
2.1 Specimens and testing
In this study, tests are carried on smooth (ST) and notched (NT) axisymmetric tensile specimens. Figure 1 shows a sketch of the NT specimens. For a fixed minimum cross-section diameter ( ), varying the notch curvature radius results in different stress triaxiality levels.22 Given the initial curvature radius and minumum cross-section diameter , each NT sample gets its name as follows: , where is the sample's name (e.g., NT10, NT4, and NT2). Small “v” notches are also machined in the specimens beyond the notch area to easily attach an axial extensometer (gauge length in Figure 1) during the test. The “v” notches prevent the extensometer knives from sliding. Smooth tensile bars are machined following the ASTM–E8 standard. The exact dimensions ( ) are detailed in each case study.
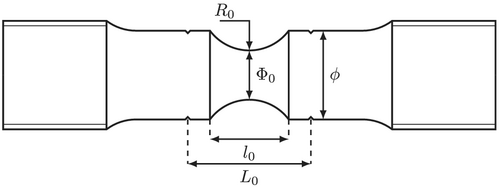
Figure 2 shows the test setup for ST and NT specimens. The knife-edged extensometer is attached to the sample by rubber bands and is used to control the machine displacement as well as to measure the axial displacement. All experiments are carried at room temperature. Tests are carried out using a strain rate of about 5. 10−4 s−1. The gauge length used to calculate the strain rate in NT samples corresponds to the notch length in the axial direction ( in Figure 1). The strain rate in notched specimens is then approximated to the ratio between the machine displacement rate and .

Time, load, machine displacement, and extensometer opening are continuously monitored during the test. The digital cameras are placed on two orthogonal planes to record images taken against a white background retro–lit by two LED lamps (see Figure 2). The cameras are fixed in the directions of interest. The testing machine controller is used to trigger image capturing (1 image/s). The setup is designed in order to obtain a high contrast between the specimen and the background to facilitate image processing.
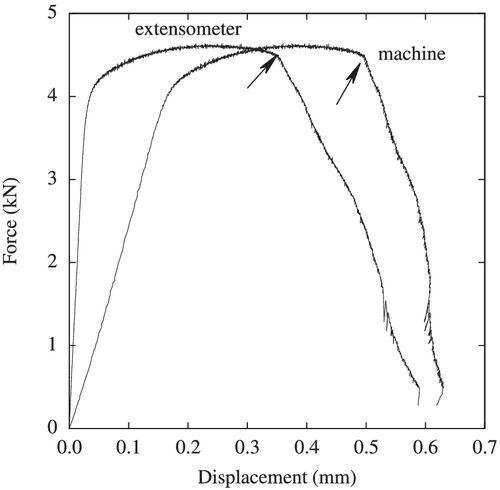
Tensile tests conducted using a machine displacement control may display an unstable behavior after the onset of the sharp load drop which corresponds to crack initiation in the center of the sample. The stress triaxiality is higher in the sample's center which leads to strain localization and damage initiation in the center.23 The strain localization in the neck area leads to a higher local strain rate. In order to avoid a local increase in the strain rate in the neck area, the machine displacement must be decreased. Otherwise, the sample might fail in an unstable manner without having a stable load drop phase. To be able to record the post-crack initiation behavior, tests are conducted using an extensometer opening control (hereby referred to as “deformation control”). The results are exemplified in Figure 3 which displays both force–machine displacement and force–extensometer opening curves. The slope of the curve after the crack initiation is steeper in the first case which explains why machine displacement control leads to an instability as explained in Petit et al.24
2.2 The ET method
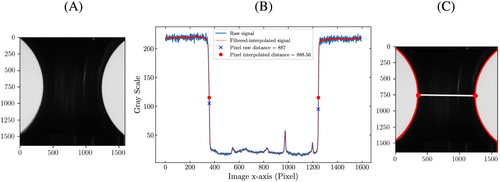
- The input image is filtered by a nonlocal image denoising method25 in order to enhance the sharp gray level contrast between the sample and the background, see Figure 4A.
- The image is manipulated as an array of pixels. For each
row of pixels in the array:
-
- a.
-
- A threshold is defined (via the OTSU method26) to detect the sample's contour. This threshold is used to define the sample's contour and thus, the diameter (“Pixel raw distance” in Figure 4B).
-
- b.
-
- The “Raw signal” in Figure 4B is then interpolated to get an accurate estimation of the gray transition interface (sample-white background interface) at the sub-pixel level (“Pixel interpolated signal” in Figure 4B). The diameter on the row of the image array is estimated via the “Pixel interpolated distance” in Figure 4B.
-
- c.
-
- Steps a and b are repeated on all rows in the array to trace the whole sample's contour and then deduce the minimum cross-section diameter ; see Figure 4C.
-
-
Once the sample's contour is traced, the notch curvature radius can be estimated. The arc used to fit the notch radius on the left and right contours is restricted between two limits located at (see green arcs in Figure 5A).
The effect of on the calculated is illustrated in Figure 5B. The latter shows the estimated as a function of for a given level of plastic deformation. The best range of lies between 0.5 and 1.0. For each sample, an optimal value of must be given to the algorithm for the computation of . As shown in Figure 4B, does not affect the computed at low deformation levels (e.g., ) as the notch curvature radius can be fit by a circle. However, has a significant effect on the computed at high deformation levels (e.g., shown in Figure 4B) since re-notching might occur, and thus, the sample's notch cannot be fit by a circle anymore. One can note that the Bridgman correction (and similar corrections based on the notch curvature radius) cannot be applied to such high deformation levels with the renotching effect.
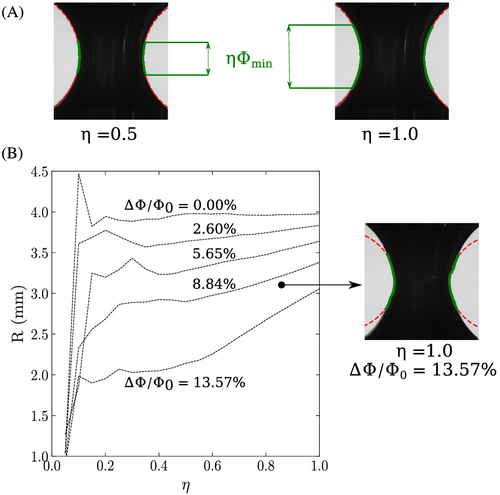
During testing, a series of images is taken (1 image/s) and then analyzed by the ET method to calculate and the notch curvature radius . The of the first image corresponds to a number of pixels that is used as a reference for calculating the radial deformation: . The images may be cropped to reduce the computation time by only taking into account the zone of interest around the notch.
After testing and only if the test is interrupted before complete fracture, the sample's notch is laser scanned to measure the notch diameter every 0.1 mm in the longitudinal axis. The notch is then virtually reconstructed by the stack of measurements to calculate the and compare to the ET measurement (see Section 3.2).
3 CASE STUDY 1: PLASTICITY AND FAILURE OF A 6061-T6 ALUMINUM ALLOY
3.1 6061-T6 aluminum alloy
The studied 6061-T6 aluminum alloy has two major alloying elements (Mg and Si) as shown in Table 1. Both elements form nanosized precipitates during the 8 h age hardening treatment at 175°C (T6 heat treatment27). The alloy is characterized by a 255 MPa yield strength, 305 MPa tensile strength, and a 7.5% uniform elongation. Coarse Mg2Si spherical precipitates (∼5 μm) as well as iron rich particles (∼10 μm long) are also present in the matrix; they are considered as damage initiators during straining.28, 29
| Mg | Si | Fe | Cu | Cr | Mn | Zn | Ti | Al |
|---|---|---|---|---|---|---|---|---|
| 0.58 | 1.00 | 0.16 | 0.28 | 0.19 | 0.06 | 0.03 | 0.02 | bal. |
3.2 Tests on NT and ST tensile specimens
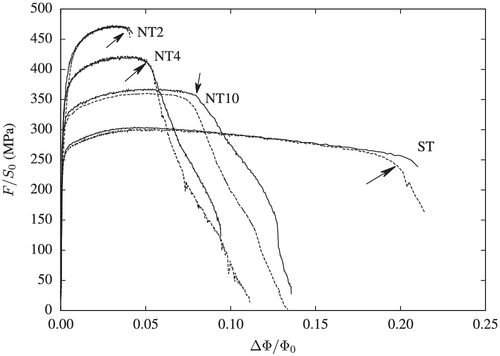
The studied specimens have a minimal diameter of 4 mm and a radius equal to 4, 1.6, and 0.8 mm (respectively corresponding to NT10, NT4, and NT2 specimens). The extensometer initial length ( ) is 10 mm for NT specimens and 17.8 mm for ST specimens. Tests are carried by the deformation control technique to capture the post-necking phase. Recorded images are treated to obtain the radial deformation. Figure 6 shows the macroscopic mechanical behavior of ST, NT10, NT4, and NT2 samples (two samples are tested from each geometry). The sharp load drop observed on all specimens corresponds to a crack initiation at the center of the specimens. The crack propagates towards the free surface up to full failure. These tests are usually unstable, and the load decrease cannot be controlled unless the deformation control technique described above is applied. For instance, Nguyen et al30 and He et al31 did not obtain the post-necking phase during tensile testing of a similar 6061 aluminum alloy. The cited authors use a machine displacement control which leads to an unstable failure. Nonetheless, the controlled load drop is more difficult to achieve for NT2 and ST specimens.
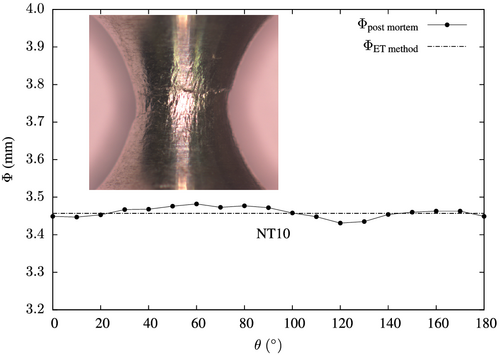
Some specimens are interrupted before complete failure. The specimens are then laser scanned to map their diameters as a function of the axial position (every 0.1 mm) and the viewing angle (every 5°). Results can then be compared to the ET measurements. This comparison is shown in Figure 7 for the minimum cross-section diameter in a NT10 specimen. The ET measurement compared to the scan shows good agreement with a maximum absolute difference of 0.014 mm between both measurements. The measured difference is attributed to the specimen surface roughness due to the deformation of large grains (mean grain size 30 μm). Therefore, the radial deformation calculated by the ET method gives an accurate estimate of the real radial deformation that would have been measured by radial extensometers. Figure 7 also shows that the minimum measured diameter is almost constant as a function of the viewing angle. This reveals the fact that the studied 6061-T6 aluminum alloy does not undergo plastic anisotropy. The samples are cut from a 6061-T6 aluminum product that did not go through either a rolling or extrusion process.
3.3 Using the ET measurements to model the material behavior: Plasticity
In the following section, use is made of the sharp load drop part of the curve corresponding to crack propagation in the minimum cross section (beyond arrows in Figure 6) to fit parameters of a damage model.
3.4 Using the ET measurements to model the material behavior: Ductile damage
The ductile failure of an AA6061-T6 is characterized by a void nucleation phase on intermetallic particles, followed by growth of these microcavities and their coalescence.28, 29, 33, 34 The AA6061-T6 along with other ductile alloys containing micron-sized precipitates undergo a void nucleation phase during loading. This phenomenon is not easy to model since the damage must be studied on various stress triaxiality levels to fit a well predictive damage model. The failure of the AA6061-T6 is often simulated by the GTN model35-37 to take into account the void nucleation, growth, and coalescence. Parameters of this model can be determined by the aid of in situ experiments and/or unit cell simulations.28, 38-42 In both cases, all these authors agree that the porosity evolution in this model is sensitive to the stress triaxiality.
3.4.1 Gurson damage model
- The plastic strain is larger than a critical strain (taken from Petit et al29 as 3%; see Table 2).
- The effective maximum principal stress ( ) is greater than the critical stress (taken as the yield stress; see Table 2).
- The nucleated porosity is less than the volume fraction of particles which can cause void nucleation ( ) (taken as the measured volume fraction of Fe rich particles).
The model has many parameters so that some of them are a priori fixed. The initial porosity corresponds to the volume fraction of coarse Mg2Si particles that easily detach from the aluminum matrix.29 , , and are calibrated on unit cell calculations38 carried out using the fit hardening law (Equation 1) as well as the measured . The maximum nucleation porosity is taken as the measured volume fraction of iron and silicon rich particles. The reference stress is taken equal to the yield stress. Finally, the ( , , and ) parameters must be adjusted to represent crack initiation in smooth tensile and NT samples. An attempt is done using the identified parameters in the work of Petit et al29 who studied the same alloy. The cited authors determined the GTN parameters on compact tension specimens with high stress triaxiality levels (>2.5). Those GTN parameters underestimated the porosity evolution when used to simulate the ductile behavior of NT samples in this study. This is of no surprise since the stress triaxiality level in the NT samples is lower than in the compact tensions samples. Consequently, the same GTN parameters ( , , and ) are reevaluated in this work to cover low and medium stress triaxiality levels (from 0.33 up to 2.0). The ( and ) parameters are also fit on the post-crack initiation phase of experiments in this work.
| 0.0035 | 2. | 1. | 0.05 | 0.2 | 0.03 | 0.0215 | 250 MPa | 0.11 | 0.02 | 4 | 0.1 mm |
- Note: Parameters marked with a are a priori fixed while the remaining parameters are calibrated via the ET method.
3.4.2 Numerical results
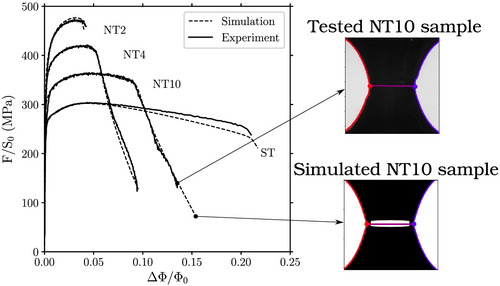
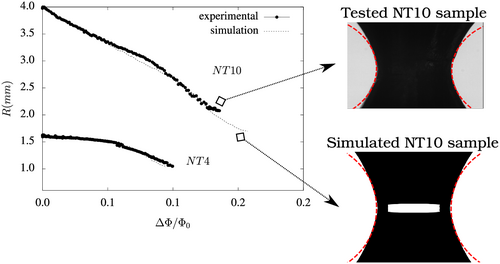
Figure 8 displays simulations carried with the newly calibrated GTN parameters listed in Table 2. More details concerning the finite element simulations and the used numerical methods are given in Appendix A.1. The model provides good predictions of the damage behavior as the experimental and numerical crack–initiation and propagation phases are quite similar. Images from the tests are compared to the mesh images from the simulation to assure the similarity in both experimental and numerical post-necking phases. Elements of the numerical mesh are filled in black to be able to apply the ET method to the mesh images. Figure 9 compares the measured and simulated curvature radii based on sample and mesh images respectively. These encouraging results emphasize the advantage of the ET method in calibrating and validating the simulated post-crack initiation phase on such a low ductility alloy.
4 CASE STUDY 2: ET METHOD APPLIED TO THE STUDY OF THE ANISOTROPIC ELASTIC–PLASTIC BEHAVIOR OF A X52 STEEL
4.1 Material
Construction steels for pipelines are fabricated from hot rolled sheet metals. Large diameter pipes are then produced by UOE forming. † The material has an anisotropic plastic behavior due to crystallographic texture developed during the fabrication process.48 Thus, it is important to keep track of the material principal axes (with respect to the metal forming process). The longitudinal direction corresponding to the rolling direction is hereby referred to as L, the transverse direction as T, and the short transverse (thickness) direction as S. D stands for the diagonal direction (45° between direction L and T in the sheet plane).
In this study, the behavior of a “vintage” (produced in 1968) X52 API grade steel is investigated. Its chemical composition is shown in Table 3. One can notice the high sulfur content which is 10 times higher than in modern steels.
| C | Mn | S | Al | Si | Cr | Cu | Mo | V | Ti | Fe |
|---|---|---|---|---|---|---|---|---|---|---|
| 0.17 | 1.22 | 0.054 | 0.036 | 0.27 | ≤ 0.01 | 0.06 | ≤ 0.01 | ≤ 0.01 | ≤ 0.01 | bal. |
4.2 Anisotropic plastic behavior
The plastic anisotropic behavior of the material is studied using smooth and NT bars. The ET method is employed using two cameras (see Figure 2) which track the radial deformation in the chosen directions perpendicular to the loading direction. For example, deformation is tracked along T and S for a test loaded in the L direction. The same protocol as in the case of the AA6061-T6 tests is used. The specimens have a minimal diameter of 6 mm and a radius equal to 6, 2.4, and 1.2 mm (respectively corresponding to NT10, NT4, and NT2 specimens). The extensometer initial length ( ) is 25 mm for NT specimens and 13.2 mm for ST specimens. As the study is only concerned with the elastic–plastic behavior, results are shown up to the onset of failure. It is assumed that ductile damage has a negligible effect on the overall behavior before the onset of failure. Tests are repeated twice or thrice. Only one test is shown for every given specimen/loading direction configuration.
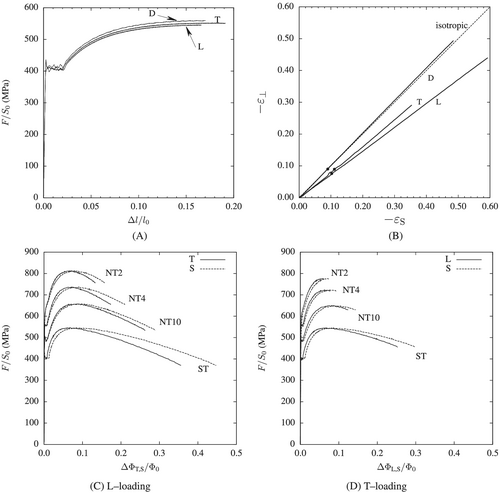
Results of ST specimens tested along the L, T, and D directions are shown in Figure 10A,B. Figure 10A shows the nominal stress ( ) as a function of the nominal strain ( ) up to the onset of necking. A Lüders plateau is observed in all cases up to a strain equal to 2%. A slight stress anisotropy is observed. Table 4 summarizes the tensile properties and number studied ST samples along different loading directions.
| Yield strength (MPa) | Ultimate tensile strength (MPa) | Uniform elongation (%) | |||||
|---|---|---|---|---|---|---|---|
| Loading direction | Tested samples | Avg. | Std. dev. (%) | Avg. | Std. dev. (%) | Avg. | Std. dev. (%) |
| T | 5 | 408 | 5.0 | 551 | 3.6 | 17.4 | 1.0 |
| L | 4 | 410 | 8.2 | 553 | 7.4 | 15.3 | 0.5 |
| D | 2 | 410 | 0.5 | 559 | 1.5 | 16.5 | 0.5 |
Figure 10B shows the true strain along the direction orthogonal to both the loading direction and the S-direction ( ) as a function of the true strain along the S-direction ( ). and are, respectively, the diameters measured for the orthogonal and the S directions. The ET method allows measuring strain beyond the onset of necking which is indicated by dots. Results remarkably show that the initial strain ratio (Lankford's coefficient) remains unchanged after the onset of necking. Lankford's coefficients for the three loading directions are 0.81, 0.74, and 1.01 for the , , and directions, respectively.
The lower maximum strain for testing along the T direction is due to the lower ductility of the material when tested in that direction. This behavior is often observed in line pipe steels.49, 50 The Lankford coefficient is lower than 1 for L and T loadings whereas it is close to 1 for D loading. These trends are commonly observed for UOE pipes.48, 51 In the present case, the Lankford coefficients are evaluated for the entire strain range. They are computed using the total strain as it impossible to experimentally separate elastic and plastic stains after necking.
Diameter variations for ST and NT specimens are shown in Figure 10C,D for both L and T loading directions. NT samples' results are consistent with the obtained results on smooth tensile bars. Three NT samples are tested for each geometry and every loading direction. Deformation tends to be maximum along the S direction for both loading directions. Stress anisotropy is negligible. One can also notice that strain to failure is smaller for T loading. Diameter variations given by the ET method can also allow estimate the radial strain rate in the pre- and post-necking phases. The strain rate in the pre- and post-necking phases of the ST sample (L loading) is equal to (constant) and increases till (maximum value before failure), respectively.
4.3 Identification of a model for plastic anisotropy
Experimental results presented in the previous section are now used to adjust a model to represent the plastic anisotropy of the material. In ST specimens, the ET technique can be used beyond the necking point so that work hardening can be adjusted with a good accuracy over a large plastic strain range which guarantees that no extrapolation is used to simulate the behavior of the entire database. As the material exhibits a very low stress anisotropy but a pronounced plastic flow anisotropy, a Hill type model52 cannot be used in the present case. This is because the normality rule links stress and strain anisotropies. Given the reduced number of material parameters, both phenomena cannot be simultaneously adjusted. The same also holds for the non-quadratic law proposed by Barlat et al.53 The model proposed to describe the anisotropic plastic behavior of the material circumvents this limitation and is briefly presented below.
| 13.8 | 0.64 | 0.36 | ||||
| 0.82 | 1.00 | 0.91 | 0.98 | 1.50 | 1.15 |
| 1.18 | 1.17 | 0.94 | 0.94 | 1.33 | 0.77 |
| 400 (MPa) | 368 (MPa) | 292 (MPa) | 7.4 | 82 (MPa) | 28 | 63 (MPa) |
The predictions of the model are compared with experiments in Figure 11. More details concerning the numerical methods are given in Appendix A.1. The latter elaborates the fact that the model is able to represent the quasi-isotropic stress behavior (Figure 11A) while, at the same time, it also well represents the anisotropic strain behavior (Figure 11B).
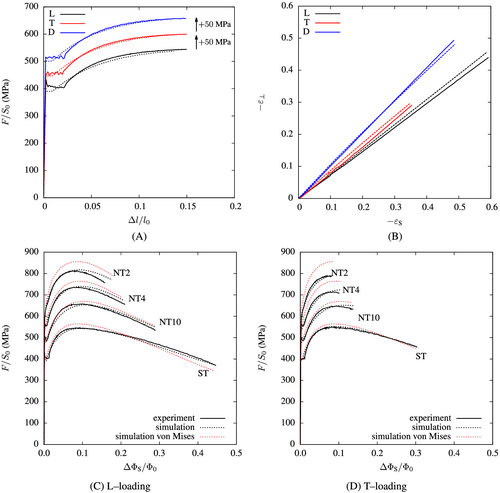
Comparisons between experimental and simulated results are also shown in Figure 11C,D for both L (Figure 11C) and T (Figure 11D) loading directions. A good agreement is found between experimental and simulated results.
To illustrate the benefit of the developed model for plastic anisotropy, simulations using von Mises plasticity are also plotted in Figure 11C,D (red dashed lines). The hardening function is fitted using the – curves for tests carried along the D direction as the strain behavior is almost isotropic in this case. Fitting the behavior for T or L loading can also be performed using the geometric mean of the diameters along the S and directions in order to keep the same cross section. One must note that fitting the model for strains less than the necking strain (≈ 0.17) leads to a very poor representation of – curves as the fitted hardening is used far beyond its identification domain (extrapolation).
Comparisons between experiments and simulations using the BB04 model show a relatively good agreement for tensile tests. As notch severity is increased, the predicted maximum load overestimates the maximum load which is well represented by the BB04 model. This observation is also noted in Bron and Besson.54 This corresponds to a non quadratic yield surface width .
5 CONCLUSIONS AND REMARKS
The ET technique was developed in other studies to characterize the plastic behavior well beyond the necking strain. The strain–hardening models must be calibrated over the pre- and post-necking phases in order to study engineering problems with large strains (e.g., fracture). The Bridgman analytical correction formulas can be used to characterize the plastic behavior beyond necking. However, the Bridgman analytical correction formulas lead to significant errors as widely discussed in the literature. The advantage of the ET method is the fact that the post-necking behavior is directly characterized without correction formulas and by using simple equipment (cameras and adequate lighting). Till now, the ET method has not been used to study fracture.
The aim of this work is to extend the ET method to two challenging case studies: the fracture behavior in a low ductility AA6061-T6 and the plastic anisotropic behavior of line pipe steels. The mentioned case studies cannot be carried out using the conventional extensometer-based measuring techniques.
- The AA6061-T6 usually incurs rapid failure after the maximum load is reached during the tensile test. However, the post-necking phase is captured in this work thanks to the “deformation controlled” technique. The latter helped in maintaining a relatively stable crack propagation phase. This technique is proved to be essential for calibrating the GTN damage parameters on tensile experimental data.
- The GTN damage parameters are first taken from other work that studied the same alloy under high stress triaxiality levels (>2.5 in CT samples). The initial model parameters overestimated the deformation at failure in the simulated ST and NT sample. However, the post-necking data obtained by the ET method help reevaluate the damage parameters. The latter fit low (0.33 in ST samples) and medium (0.6–2.0 in NT samples) stress triaxiality levels. As a result, the simulated stress–radial deformation curves are in good agreement with the experiments.
- The ET method allows continuously observing the anisotropical behavior of line pipe steels during the entire tensile test. The “old-fashioned” alternative is to rely on the post-mortem study of the fracture surfaces to analyze the anisotropy. However, in this study, the evolution of Lankford factor is continuously estimated for both tested directions during the tests conducted on ST specimens.
- The collected experimental data via the ET method give significant amount of information regarding the true radial strain in different loading directions. As a result, the parameters of the BB anisotropic plastic constitutive law are identified accurately. The accurate identification of the anisotropic plastic behavior is essential in order to study fracture in future work.
ACKNOWLEDGMENTS
Authors of this work would like to thank the Laboratoire de comportement des matériaux irradiés (LCMI) laboratory at CEA Saclay for providing the aluminum alloy used in this study. They would like to thank as well the RICE research center of GRTgaz France for supplying the X52 alloy studied in this work. Special thanks to the machining and mechanical testing teams at Centre des matériaux for their extraordinary work.
CONFLICT OF INTEREST
The authors declare that they have no known competing financial interests or personal relationships that could have appeared to influence the work reported in this paper.
AUTHOR CONTRIBUTIONS
Zacharie Shokeir conceived and designed the analysis, Collected the data, Performed the analysis, and wrote the paper. Jacques Besson conceived and designed the analysis, performed the analysis, and participated in writing the part: “CASE STUDY 2: ET METHOD APPLIED TO THE STUDY OF THE ANISOTROPIC ELASTO-PLASTIC BEHAVIOR OF A X52 STEEL.” Chiraz Belhadj collected the data and performed the analysis. Tom Petit revised the manuscript and supervised the PhD of the contributing author. Yazid Madi conceived and designed the analysis and contributed data or analysis tools.
APPENDIX A: NUMERICAL METHODS
Finite element (FE) simulations are carried out in this study via the Zset general purpose object oriented finite element software.57 Ductile failure in aluminum alloys and plastic anistoropy in line pipe steels are two mechanical engineering problems that require a finite–strain formalism when implementing the constitutive equations. This is done by a generic formulation based on a reference frame which assures maintaining the standard small strain formulation while using an additive strain rate decomposition (i.e., where is the strain rate tensor and the elastic strain rate tensor).58
A.1 FE simulations in case study 1: Plasticity and failure of a 6061-T6 aluminum alloy
For FE simulations carried out in the first case study, 2D meshes of the axisymmetric ST and NT samples are obtained with 8-node quadrangle elements containing 4 integration points (reduced integration). Symmetry conditions are used so that only 1/4 of the ST and NT samples are meshed. The mesh size ( in Table 2) is taken as 100 × 100 μm2 which is based on the average estimated distance between large constituent particles in the AA6061-T6 studied alloy.
The used GTN damage models lead to material softening which results in strain and damage localization within one row of elements. As a result, the simulation results strongly depend on the mesh size. To overcome this issue, models integrating material internal lengths can be used (e.g., Feld-Payet et al. and Mediavilla et al.59, 60). However, these models are still in an early development phase. The pragmatic solution chosen in this study is to fix a mesh size along the crack path61, 62 (minimal cross-section diamater in tensile samples). The fixed mesh size controls the fracture energy in the case of mesh dependent simulations.63
The material integration point is considered as broken when reaches (with ). Then, its behavior is replaced by an elastic behavior with a very low stiffness (Young modulus: MPa). When 2 out of 4 integration points are considered as broken in the 2D element, the latter is removed from the mesh. Displacement increments at nodes belonging to removed elements are then fixed to avoid a singular global stiffness matrix.
A.2 FE simulation in case study 2: ET method applied to the study of the anisotropic elastic–plastic behavior of an X52 steel
Elastic–plastic FE simulations carried out in the second case study are mainly used to optimize parameters of the hardening law (see Equation 16 and Table 5). Unlike the first case study, the line pipe steels have a significant anistropic plastic behavior. Therefore, 3D meshes are necessary. A 20-node 3D hexahedral element with 8 integration points (reduced integration) is used to mesh the ST and NT samples. The mesh size is taken as .
Open Research
DATA AVAILABILITY STATEMENT
Data sharing is not applicable to this article as no new data were created or analyzed in this study.
REFERENCES
- † UOE forming is a manufacturing process where the plate material is first deformed into an U-shape then an O-shape. The pipe seam is then welded. The pipe is finally expanded using an internal mandrel. To achieve low ovality, the pipe is typically expanded by 0.8–1.3% from its diameter after the O-step.47


