Service life estimation of self-piercing riveted joints by linear damage accumulation
Abstract
Tests under variable amplitude loading on self-piercing riveted components with semi-tubular rivets result in longer service lives than those calculated by linear damage accumulation. An overview of the literature shows that damage sums greater than one are found for other types of riveted joints either, while an explanation for this unusual behavior is still missing. Therefore, this behavior is examined in more detail. A correlation is shown between the damage sum and the hardness of the load spectrum. Considering this correlation, the accuracy of the service life estimation can be improved significantly.
1 INTRODUCTION
Joining technology is considered a key technology for the use of new materials and the further development of innovative, resource-saving products. Self-piercing riveting (SPR) with a semi-tubular rivet is a joining process widely used and established in many industries, since it can be used to join different materials such as steel and aluminum without heat input. Extensive research has been conducted to compare the static and fatigue strengths at constant amplitude loading of SPR joints against spot-welded joints. Sunday,1 Krause and Chernenkoff,2 and many others demonstrate that spot-welded joints possess a higher static strength, whereas SPR joints possess a higher cyclic strength.
Owing to a lack of experience and calculation concepts, the design of self-piercing riveted components with semi-tubular rivets against fatigue can only be conducted by extensive experimental effort on prototypes. To reduce this experimental effort, the service life under variable amplitude is estimated from the S-N curve (constant amplitude) using a linear damage accumulation. To be able to distinguish the fatigue life at constant amplitude from the fatigue life at variable amplitude, this paper uses the terms fatigue life for constant amplitude loading and service life for variable amplitude loading.
For experiments under variable amplitude loading, longer service lives occur than those calculated by linear damage accumulation. This effect is described in this paper and made applicable for the improvement of the service life estimation through linear damage accumulation.
Some of the results shown in this paper have already been introduced in Masendorf et al.3 but will be complemented by further test results and discussed in more detail in this paper. Additionally, the correlation between the damage sum and the so-called service life factor for SPR is a completely new aspect presented in this paper.
2 STATE OF THE ART
This section summarizes the basic knowledge of linear damage accumulation necessary to understand Sections 4, 6. Therefore, an overview of occurring damage sums of SPR and other riveted joints is shown. Finally, the influence of fretting wear on the service life of SPR joints is presented.
2.1 Self-piercing process with a semi-tubular rivet
Figure 1 depicts the self-piercing process with a semi-tubular rivet. In the first stage, the two (or more) sheets of materials are clamped between the die and the blank holder. In the next stage, the punch pushes the rivet to penetrate the pierced sheet (top sheet). Consequently, the rivet pierces the top sheet and radially expands into the locked (bottom) sheet. Finally, the punch returns to its initial position. The result is both a form-fit and force-fit joint.

2.2 Load spectra and linear damage accumulation
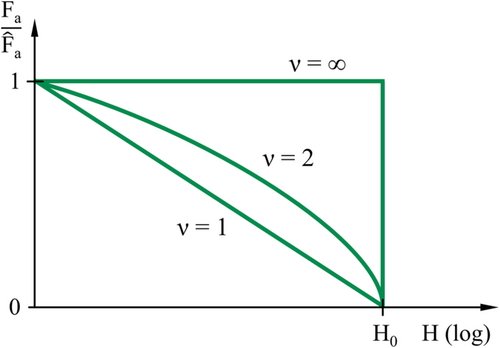
 , the total frequency H0 (overall number of cycles), and the shape parameter ν (see Equation 1 according to Hanke4). The hardest conceivable spectrum is the rectangular spectrum (ν = ∞), which corresponds to a constant amplitude loading, as shown in Figure 2. For smaller ν, less hard spectra results, namely, a normally distributed spectrum for ν = 2 and a straight-line distributed spectrum for ν = 1.
 (1)
(1)
 (2)
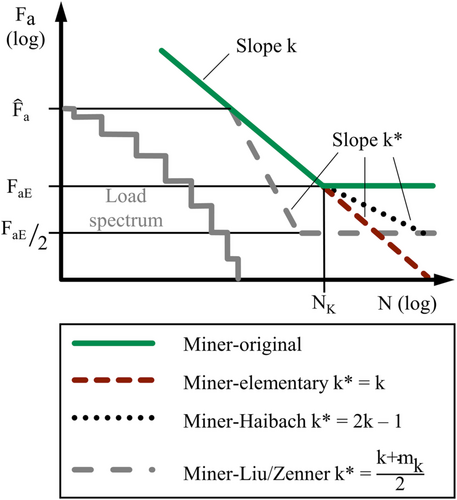
(2)The premise is that the load spectrum and the S-N curve are valid for the same load ratio R = Fmin/Fmax or the same mean stress. The theoretical component failure occurs at a damage sum of D = 1. The original Miner's rule was developed for load spectra for which all load levels lie above the endurance limit. This restriction has often been ignored, and the individual damage of each load cycle has been determined from the S-N curve with a pronounced endurance limit, whereby load cycles with an amplitude Fa below the endurance limit FaE are rated nondamaging. This method is called Miner-original hereafter, Figure 3. However, test results from Gaßner8 and Conle9 show that stress amplitudes below the endurance limit can also contribute to the damage. This effect has been considered in numerous modifications of Miner's rule of which the following will be discussed in more detail:
- Miner-elementary: For this modification, the endurance limit is ignored, as shown in Figure 3. The decreasing branch of the S-N curve before the knee point (slope k) is extended into the range of the endurance limit. Therefore, a damaging contribution is assigned to all load levels below the actual endurance limit.
- Miner–Haibach, according to Haibach10: The decreasing branch of the S-N curve is extrapolated below the endurance limit using a modified slope of k* = 2·k − 1, Figure 3.
- Miner–Liu/Zenner, according to Liu and Zenner11: This modification uses an S-N curve with a steeper slope of k* = (k + mk)/2 below the maximum value
 of the load spectrum, as depicted in Figure 3 where mk is the slope of the crack propagation S-N curve, which is assumed to be mk = 3.6, according to Hinkelmann et al.12 Load amplitudes below half of the endurance limit FaE are not considered damaging.
However, even if these Miner's rule modifications are applied, discrepancies between the calculated and experimentally determined service life are found (even on average). Therefore, Schütz13 introduces the relative Miner rule to compensate for this discrepancy between experiment and calculation. Instead of using the theoretically correct damage sum of D = 1 = 100% to describe component failure, an effective damage sum Deff ≠ 1 is used. The value of Deff is determined by the experience for certain groups of metallic components. For analytical strength assessments of components according to the FKM guideline,14 for example, an effective damage sum Deff ≤ 1 is used.
2.3 Damage sums for riveted joints
A review of the literature shows that only Meschut et al.15 published tests under variable amplitude loading on self-pierce riveted specimens. There, three series of tests have been conducted on aluminum components with either one or 10 joining points in different loading conditions. For the individual test results, damage sums with Miner-elementary of D = 0.02–15.8 are calculated. These test series are described in more detail in Section 3 and are taken into account in the evaluations from Section 4 onwards.
For other riveted joints, often only few individual test results are available. These are summarized in Table 1. Lowak and Schütz16 investigate Huck-Bolt joints. This type of joint is used in aircraft construction and is examined in a two-shear lap specimen with 12 joining points. For these specimens, S-N curves with a constant mean stress are determined. In the subsequent tests under variable amplitude loading, a load spectrum is applied to represent loads from 40,000 flights. The amplitude distribution of this load spectrum corresponds approximately to a straight-line distribution, as shown in Figure 2. The damage sums determined for the high load levels are D > 3 and decrease for smaller maximum values of the spectrum, as shown in Table 1, no. 1. D = 0.81 for the smallest maximum value results.
| No. | Connection | Sheet material | Connecting element | Stress | D | Source |
|---|---|---|---|---|---|---|
| 1 | Two-shear lap joint | Aluminum | Huck-Bolt | 160 MPa | 3.90 | 16 |
| 150 MPa | 2.88 | |||||
| 140 MPa | 2.59 | |||||
| 120 MPa | 1.42 | |||||
| 100 MPa | 0.81 | |||||
| 2 | Two-shear lap joint | Aluminum | Huck-Bolt | 150 MPa | 2.45 | 17 |
| 140 MPa | 1.96 | |||||
| 100 MPa | 0.64 | |||||
| 90 MPa | 0.35 | |||||
| 3 | Two-shear lap joint | Aluminum | Huck-Bolt | 150 MPa | 2.45 | 17 |
| 100 MPa | 0.64 | |||||
| 4 | Two-shear lap joint | Aluminum | - | 460 MPa | 0.59 | 18 |
| 5 | Single-shear lap joint | Aluminum | Hi-Lok | 420 MPa | 1.26 | 18 |
| 6 | Two-shear lap joint | Titanium | - | 775 MPa | 2.03 | 18 |
| 7 | Single-shear lap joint | Titanium | Hi-Lok | 641 MPa | 3.12 | 18 |
| 8 | Two-shear lap joint | Aluminum | Huck-Bolt | 460 MPa | 0.59 | 19 |
| 420 MPa | 1.09 | |||||
| 9 | Single-shear lap joint | Aluminum | Hi-Lok | 420 MPa | 1.26 | 18 |
| 320 MPa | 1.27 |
Buch et al.19 examine whether the test results determined with different load spectra could be compared with the help of the relative Miner rule. Various notched components are examined, including riveted specimens. Schütz and Lowak17 also investigate Huck-Bolt rivets in a two-shear lap specimen with 12 joints. The load is applied with the standard load sequence Transport Wing Standard (TWIST) with different maximum values of the spectrum. The resulting damage sums are summarized in Table 1, no. 2, and the following behavior can be seen:
- A high load level results in damage sums of D > 1 and
- For smaller load levels, the damage sum is reduced to D < 1
For all further test series, only one or two test results are given for the same load spectrum. The results are summarized in Table 1 without a more detailed description of the load spectrum, since the focus is on the damage sum D. In contrast to the aluminum components considered above, Table 1 also lists damage sums for titanium components. Damage sums of D > 1 also occur for titanium.
Meschut et al.15 investigate SPR specimens under variable amplitude loading. It is found that damage sums D > 1 occur in multiple cases for SPR joints. Other authors demonstrate the same behavior on other riveted joints. In Section 5, it is shown how the different damage sums can be taken into account for a service life estimation for SPR components using the so called IMAB method for SPR. Section 6 discusses causes that explain damage sums D > 1 for SPR components.
2.4 IMAB method
 (3)
(3)
 (4)
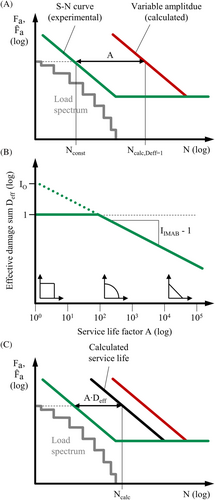
(4)For the hardest possible spectrum of a constant amplitude loading (ν = ∞), see Figure 2, the service life factor is A = 1. The less hard the spectrum is, the greater becomes A.
 (5)
(5)Figure 4C shows the calculated service life, which is determined through linear damage accumulation. The calculated service life Ncalc,Deff = 1 is corrected using the effective damage sum Deff according to the IMAB method. Using Miner-elementary and a constant cumulated frequency H0 results in the parallel course between the fatigue life and the service life shown in Figure 4C.
The IMAB method can be used to explain why different damage sums D occur for the same components, such as the riveted components in Section 2.3. By changing the maximum value of the spectrum
 with a total frequency H0, a different service life factor A is obtained, which results in a different effective damage sum Deff; see Equation 5.
2.5 Quality of service life estimations
 (6)
(6) (7)
(7)Hinkelmann,20 for example, gives a mean value m = 0.19 and a deviation range T = 9.0 for Miner-original in a database of 293 individual tests for the material group steel. This means that in the examined database, the specimens fail on average at D = 0.19. If the relative Miner rule with Deff = m = 0.19 is applied, the mean value improves to m = 1.0, but the deviation range remains unchanged. By applying the IMAB method, a mean value of m = 1.0 and a deviation range of T = 7.2 can be achieved. According to Hinkelmann,20 the most accurate service life estimation is achieved for the same database with the Miner-Liu/Zenner. Without correction by the IMAB method, a mean value of m = 0.69 and a deviation range of T = 6.8 are obtained; with the application of the IMAB method, the parameters improve to m = 1.0 and T = 5.8.
2.6 Fretting wear
Under constant and variable amplitude loading, fretting occurs between the upper and lower aluminum joining parts. This is shown by a black powdery debris that emerges from the joint and adheres between the contact surfaces. Chen et al.21 investigated this debris on SPR specimens of AA5754. Debris mainly occurs at the beginning of cyclic loading and consists of dissolved aluminum particles that quickly oxidize to Al2O3, as shown by EDX analysis. Iyer et al.,22 Han et al.,23 Li et al.,24 and Zhang et al.25 also proved fretting in SPR joints.
Li et al.24 show that fretting increases the roughness of the surfaces in the fretting area and that this affected area is larger at high amplitudes than at low load amplitudes. Han et al.23 show that high friction in an SPR joint increases the loading capacity. To reduce friction between the joined parts, Han et al. introduced a PTFE film into the joint. This prevented fretting at small amplitudes and significantly reduced it at large amplitudes. Owing to the reduced friction, the stress distribution in the joint is changed, and the damage location is no longer in the joining sheets but within the rivet. The endurable number of cycles is significantly reduced. This results in the positive influence of a large fretting area on the load capacity of the joint.
However, a large fretting area can also have a negative influence on the load capacity. Chen et al.,21 Iyer et al.,22 and Han et al.23 indicate that the crack initiation sites are located in the fretting area. According to this, a large fretting area statistically leads to a lower strength. Li et al.24 contradict this and demonstrate that cracks can originate in fretting areas; however, this is not always the case. There is no significantly shorter fatigue life for cracks originating in the fretting area as compared to cracks that originate at other locations. It is also highlighted that fretting can also occur only after crack initiation due to the resulting heel.
3 EXPERIMENTAL FATIGUE LIVES FOR SPR JOINTS
During the evaluation of fatigue tests on self-piercing riveted components using linear damage accumulation, service lives that lead to damage sums of D > 1 occurred in several cases. This behavior is unusual for most metallic components (see Sections 2.2 and 2.5) but also occurs for other riveted joints; see Section 2.3. Below, this effect will be examined in more detail, and possible explanations will be presented.
To investigate damage sums under the variable loading for self-piercing riveted components, tests performed by Meschut et al.15 and own original test results are evaluated. Test results are available for all investigated specimens at constant and variable amplitude loadings. Table 2 gives an overview of these tests, and Figure 5 summarizes the geometries and load directions. As an example, the execution of the tests on specimen type 1, the single-lap specimen under shear load, is described in more detail.
| No. | Specimen type | Load type | Sheet material | R | H0 | ν | Number of test results | Source |
|---|---|---|---|---|---|---|---|---|
| 1 | Single-lap | Shear | AW-6181 | 0 | Var. | 2 | 9 | Original |
| 2 | Single-lap | Bending | AW-6181 | −1 | Var. | 2 | 9 | Original |
| 3 | LWF-KS2 | Normal | AW-6181 | 0 | 105 | 2 | 10 | 15 |
| 4 | LWF-KS2 | Shear | AW-6181 | 0 | 105 | 2 | 13 | 15 |
| 5 | H-specimen | Shear | AW-6181 | 0.1 | 105 | 2 | 7 | 15 |
| 6 | Top-hat profile | Torsion | AW-5182 | −1 | Var. | 2 | 4 | Original |
| 7 | Single-lap | Shear | AW-6181 | 0 | Var. | Var. | 4 | Original |
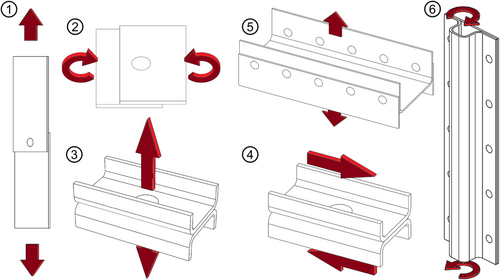
The semi-tubular rivet of the investigated specimen type 1 consists of steel, and the parts to be joined consists of aluminum AW-6181 with a sheet thickness of t = 2 mm. The cyclic loading (stress ratio R = 0) generates a combined load of shear tension and peel tension at the joining point, the former being the dominant one. The component is clamped with the aid of hydraulic wedge grips, and the testing force is applied by a servo-hydraulic actuator.
For a comparison between service lives at variable amplitude loadings calculated according to Miner's rule and the experimentally determined ones, S-N curves are determined using the pearl string method according to DIN 5010027 as the first.
In second, tests with variable amplitude loadings are conducted with the same test equipment and setup. The load time history used in these tests is generated such that a normally distributed load spectrum (shape parameter ν = 2) results. If the same overall number of cycles H0 of the load spectrum is selected for all load levels, the following consequences would result:
- If the maximum value of the spectrum is low and, therefore, the number of repetitions is z > > 1, the shape of the superimposed total spectrum tends in the direction of a rectangular spectrum.
- If the maximum value of the spectrum is high and the spectrum is not tested completely before failure (z < 1), it is possible that the maximum value of the spectrum is not reached.
Figure 6 shows the qualitative behavior for a load time history of R = −1 and H0 = 10. Figure 6B depicts the normally distributed spectrum which results for z = 1. Figure 6C depicts a comparison with a spectrum for z = 100. This approaches a rectangular shape. A spectrum that is not completely tested, for example, z = 0.5, does not reach the maximum value in Figure 6D.

For this reason, H0 is chosen differently for each load level and is estimated with the linear damage accumulation, so that the number of repetitions in the experiments of z ≈ 10 is approximately the same.
 (8)
(8)Figure 7 depicts the results of the tests with constant and variable amplitude loadings. Additionally, the load spectra for the smallest and largest tested load levels are shown.
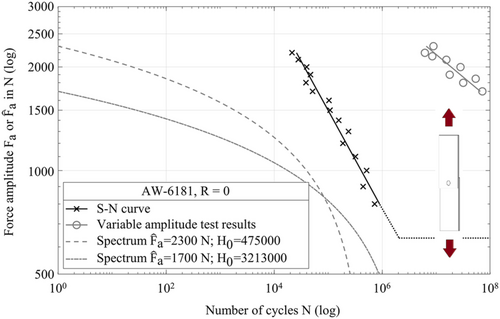
For each test result with variable amplitude loading, the damage sum is determined according to Miner-original and the modifications elementary, Haibach and Liu/Zenner. During the experiment, the load signal is recorded, and from this, the individual damage of each load cycle and, thus, the total damage are determined. Since no experiments were performed to determine the endurance limit FaE, it is calculated from the S-N curve with an assumed knee point at NK = 2·10.6
4 CALCULATED SERVICE LIFE WITH LINEAR DAMAGE ACCUMULATION
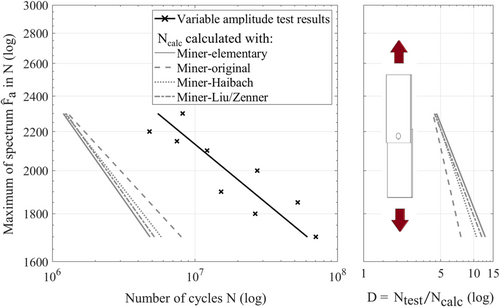
If theoretical failure is assumed for a damage sum of D = 1, the calculated service lives with all modifications are shorter than the experimental results (see left side of Figure 8), which results in the unusual case of damage sums of D > 1. The right side of Figure 8 shows the damage sums dependent on the maximum value of the load spectrum for the modifications used. It can be seen that the damage sum is dependent on the maximum value of the spectrum and that this effect varies in its intensity depending on the chosen Miner modification. With Miner-original, D = 5.8 results in average, which is almost independent from the maximum value of the load spectrum.
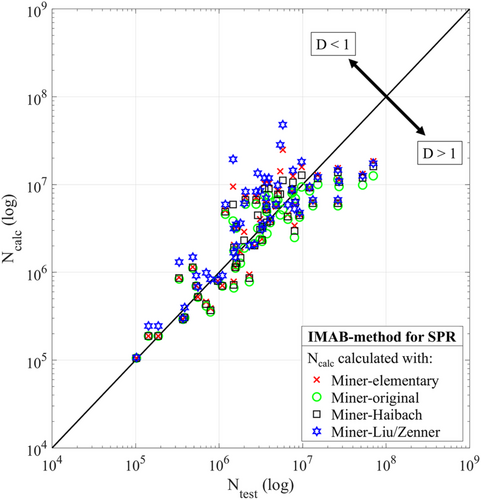
The results of the experiments from Table 2 are summarized in Figure 9. The calculated number of cycles Ncalc, which were determined using the described modifications of Miner's rule with Deff = 1, is plotted over the experimental number of cycles Ntest. This plot may be interpreted as follows:
- If the calculated service life agrees with the experimental service life, the results lie on the diagonal line (D = 1).
- If the calculated service life is estimated to be too short, the results are below the diagonal line (D > 1).
- If the calculated service life is estimated to be too long, the results are above the diagonal line (D < 1).
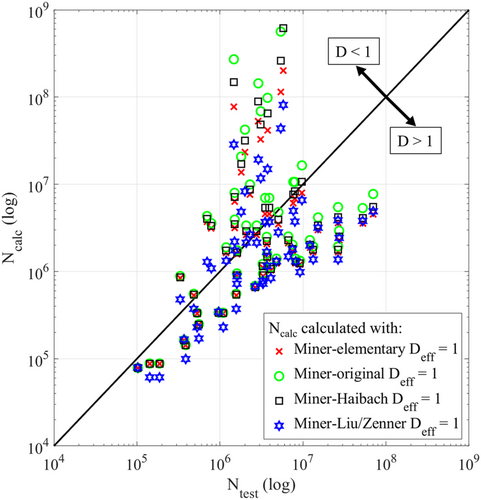
To describe the quality of the calculated service life, the median value m and the deviation range T of the ratios Ntest/Ncalc are determined; see Section 2.5. The quality parameter for all Miner modifications is given in Table 3. Because all calculated service lives are within a deviation range independent of the modification, m and T are also given for the entire set of data points in Figure 9. The calculated service life using the modification according to Liu/Zenner has the smallest deviation range T, but also the largest difference from the median value m = 1 with m = 2.21. Using Deff = 2.21 results in a median value of m = 1 and a deviation range of T = 37. Miner-Liu/Zenner thus provides the most accurate service life estimation for the tested SPR joints. Compared to tests on the steel material group shown in Section 2.5, the smallest deviation range is also obtained for the SPR joined components with Miner-Liu/Zenner, which is, however, significantly larger with T = 37 than with the tests on the steel material group with T = 6.8.
| Modification | m | T |
|---|---|---|
| Miner-elementary | 1.62 | 85 |
| Miner-original | 1.58 | 152 |
| Miner-Haibach | 1.62 | 117 |
| Miner-Liu/Zenner | 2.21 | 37 |
| All modifications | 1.72 | 83 |
5 IMAB METHOD FOR SPR
 (9)
(9) (10)
(10)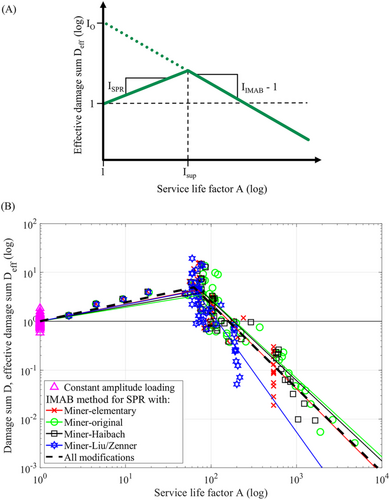
Figure 10B shows the damage sums for the four Miner modifications as a dependence of the service life factor A. In addition, the curves of the effective damage sum according to the IMAB method for SPR are shown for each modification and for all modifications together. The damage sums of the tests under constant amplitude loading are shown as triangles. For these, the same damage sum results for each Miner modification, since it is a rectangular spectrum (A = 1). This makes it possible to visually compare the deviation between the tests under constant and variable amplitude loading. To confirm the linear trend for service life factors smaller than Isup, four tests were conducted with ν ≠ 2 (Table 2, no. 7) to achieve a small service life factor A.
Table 4 summarizes the resulting slope IIMAB, the offset IO, and the support point Isup. Because the results fall within a scatter band, a common evaluation of the results is conducted for all Miner modifications.
| Modification | Isup | IO | IIMAB | m | T |
|---|---|---|---|---|---|
| Miner-elementary | 70 | 7.52 · 103 | −0.75 | 1.00 | 6.3 |
| Miner-original | 86 | 4.69 · 103 | −0.61 | 1.00 | 5.9 |
| Miner-Haibach | 80 | 5.31 · 103 | −0.65 | 1.00 | 5.8 |
| Miner-Liu/Zenner | 66 | 119 · 103 | −1.45 | 1.00 | 6.4 |
| All modifications | 63 | 6.16 · 103 | −0.72 | 1.00 | 6.7 |
In Figure 11, the IMAB method for SPR with values for all modifications is applied to the test results. A graphical comparison with Figure 9 shows a significant improvement in the calculated service life by the IMAB method for SPR. This can also be seen by considering the median value m = 1 and the deviation range T = 6.7, which indicates a clearly more accurate service life estimation, as shown in Table 4, than the deviation range without correction by the IMAB method for SPR with T = 83. If the values for the individual modifications are applied, the deviation range can be further reduced so that all Miner modifications provide approximately equally good results. By applying Miner-Haibach with the correction by the IMAB method for SPR, the deviation range is reduced from T = 117 to T = 5.8, whereby the best service life estimation can be carried out with this modification. This finding differs from the results without using the IMAB method for SPR, where the modification according to Liu and Zenner provides the best results.
An investigation of whether the IMAB method for SPR can also be applied to the other riveted joints, that are shown in Section 2.3, cannot conducted since there is no information in the literature on fatigue lives under constant amplitude loading; thus, the service life factor A cannot be determined.
6 DISCUSSION
In tests on SPR specimens with aluminum joining sheets, for some test series, the damage sums D were greater than one under variable amplitude loading. A dependency between damage sum D and service life factor A was shown:
- For service life factors of approx. A < 150, that is, hard load spectra, the average damage sum is D > 1,
- For service life factors of approx. A > 150, that is, less hard load spectra, the average damage sums are D < 1.
Below, approaches to explaining this behavior are discussed, considering several sources from literature. In particular, the influences of the cyclical hardening of aluminum and fretting wear are considered.
6.1 Cyclical hardening
Fu and Mallick28 investigated the influence of the setting force during joining on the fatigue behavior under cyclic loading of single-lap specimens made of aluminum 6111-T4 with a shear loading, similar to specimen type 1 investigated in this paper. Among other things, the specimens were loaded with a two-stage spectrum. The applied load spectra can be divided into two categories:
- High–low test sequence: First, a high load amplitude was applied until between 25% and 75% of the fatigue life was reached in comparison with the experimental S-N curve. Then, the specimen was tested with a low load amplitude until failure.
- Low–high test sequence: Reverse procedure to the high–low test sequence. First, a low load amplitude was applied to the specimen, which caused predamage of 75% or 50%. The specimen was then tested with a high load amplitude until failure.
Figure 12 plots the resulting damage D, as determined with Miner-elementary, over the service life factor A. Although the relative Miner rule and the IMAB method are valid only to ideally mixed load sequences, the curve of the effective damage sum Deff, according to the IMAB method for SPR joints, is shown nevertheless. Because of the two-stage test sequence and the associated high number of high amplitudes in the spectra, a low service life factor A results for all the tested spectra.
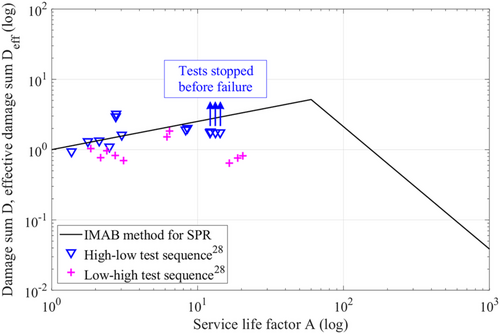
For the low–high test sequences, the damage sum is D ≈ 1. The damage sums of the high–low test sequences are greater than 1 and exhibit a progression that follows the IMAB method for SPR. Four of the tests were not tested to failure as the test was aborted when approximately 2.5·106 cycles on the low load horizon were reached. The damage of D ≈ 1.75 achieved up to that point would increase further by testing to failure.
Fu and Mallick28 suggest that the hardening of aluminum under cyclic loading is a possible explanation for the occurrence of damage sums of D > 1 for the high–low test sequences:
- High amplitudes lead to plastic deformation in the joint area;
- Cyclical hardening occurs at highly stressed areas;
- The following small amplitudes damage the hardened material less than they would under constant amplitude loading:
- Resulting in damage sums of D > 1.
In the case of a low–high test sequence, D ≈ 1 occurs:
- Only hardening occurs for small amplitudes, similar to constant amplitude loading;
- Damage is, therefore, in line with that found under constant amplitude loading;
- Similar to constant amplitude loading, the following high amplitudes cause further hardening:
- Resulting in damage sums of D ≈ 1.
These findings can be transferred to the test results of the randomly distributed load spectra, as shown above. For this purpose, nonlinear damage accumulation must be assumed during the test under constant amplitude. Cycles at the beginning of the test, in which the cyclic hardening is not yet completed, must show higher damage shares than cycles that are later applied to the hardened material.
Since the focus in this paper is on linear damage accumulation, as this is also used more frequently in practice, the accuracy of a service life estimation with nonlinear damage accumulation is not discussed here. However, an overview of promising approaches to nonlinear damage accumulation is shown by Zhu et al.29, 30 Additionally, an interesting approach for combining the linear damage accumulation with the correction by the IMAB method with the nonlinear damage accumulation according to Manson and Halford31 is given by Müller.32 The nonlinear damage accumulation according to Manson and Halford also causes a decrease of the effective damage sum Deff with increasing service life multiple A. Therefore, for the data set examined by Müller32 for the material group steel, a similar accuracy results for the linear and the nonlinear damage accumulation. No statement is made for the aluminum material group because the data set is too small.
For randomly mixed hard load spectra, that is, a small service life factor A, high loads often occur, and cyclic hardening is completed early in the service life. It follows from this that,
- The low load amplitudes cause less damage early in the service life rather than the linear damage accumulation based on the results of tests with constant amplitudes suggests.
- The damage caused by high amplitudes at the beginning of the test is underestimated because material hardening is not yet completed. However, owing to the large number of high amplitudes in the overall spectrum, the influence of damage shares that was estimated too small can be neglected.
In conclusion, it can be stated that the calculated damage D for hard spectra becomes greater than 1 because the partial damage d of the small amplitudes is assumed to be too high. This can also explain the knee point in the course of the IMAB method for SPR. For very small service life factors A < 70, the share of cycles with low amplitudes becomes smaller and smaller, which are responsible for the excessively high damage D.
Large amplitudes rarely occur in less hard spectra with large service life factors. Thus, the end of the cyclical hardening is also shifted further towards the end of the experiment. From this, it follows that
- The share of damage of the small amplitudes is correctly estimated and
- The damage of the few high amplitudes is underestimated owing to the linear course of the damage. In comparison to a small service life factor A, these underestimated shares of damage cannot be neglected because the number of high amplitudes is significantly lower.
The damage is therefore underestimated, and the specimen fails before reaching the damage sum of 1.
6.2 Fretting wear
The findings from the literature on fretting wear in SPR joints shown in Section 2.6 can be transferred to explain the damage sums D > 1 for small service life multiples A. For hard load spectra, that is, a small service life factor A, many large amplitudes occur. This results in a large fretting area with high roughness as compared to the fretting area with small amplitudes applied with a constant amplitude loading. Consequently, the force of the small amplitudes is transferred over a larger area, leading to smaller stress concentrations in the joining sheets. The partial damage d of the small amplitudes is therefore smaller with variable amplitude than with constant amplitude. This results in damage of D > 1 for the tests under variable amplitude. For less hard load spectra, that is, large service life factors A, high amplitudes rarely occur, and the fretting areas do not become larger as compared to the single-step test for small amplitudes. For low fretting, damage sums of D < 1, which are usual for metallic components, occur.
Form-fit improvement is a further positive effect of fretting on service lives with variable amplitude. On a single-lap specimen with a shear load, see specimen type 1 in Figure 5, a measurement was conducted using the potential probe method. A DC current I flows through the specimen, which for the most part passes through the joining point as the only connection point. At the surface of the locked sheet, the potential drop between two points before and after the joining point is measured. If the size of the contact area in the joint changes, the electrical resistance changes. This change can be made visible by measuring the electrical potential drop. If cyclic loading with constant amplitude is applied to the specimen in the form of a sine, this sine also occurs in the electrical voltage. Therefore, the electrical resistance of the joining point changes under cyclic loading. It can be concluded that the size of the contact surfaces must change during the load. With each further cycle, the amplitude of the voltage signal becomes smaller. Fretting causes the joint to be set and improves the geometric fit of the contact surfaces. If the load amplitude is increased, sine oscillations occur again in the electrical voltage signal, which decay over time.
Thus, hard spectra (small A) are similar to the fretting above:
- Due to the frequently occurring high amplitudes, the connection is set stronger than under constant amplitude with low amplitudes. The contact surfaces are larger, and the form-fit is better;
- The force of the small amplitudes is transmitted over a larger area as compared to the test under constant amplitude loading, leading to lower loads; and
- Calculating the partial damage d of the small amplitudes from the S-N curve leads to values which are too large,
- Resulting in damage sums of D > 1.
7 CONCLUSION
This study examined in more detail the calculated service life with linear damage accumulation on SPR components with semi-tubular rivets. The investigated components consists of aluminum sheets AW-5182 and AW-6181 with steel rivets for joining and were investigated by our own tests and by tests by Meschut et al.15 under constant and variable amplitude loadings. The results can be summarized as follows:
- For aluminum AW-5182 and AW-6181 components with SPR joints, damage sums of D > 1 are not unusual.
- A correlation can be found between the damage sum D and the service life factor A and can be described by the IMAB method for SPR.
- By applying the IMAB method for SPR, the median value and the deviation range of the calculated service life of the SPR components under variable amplitude can be improved significantly.
- The cyclical hardening of the aluminum and the fretting wear in the SPR joint can explain the damage sums of D > 1. Explanation approaches were also presented for damage sums D < 1. Additionally, the effects described are superimposed by the usual behavior of metallic materials; that is, large service life factors A result in minor damage.
These results are supported by the literature: Fu and Mallick28 also determined damage sums of D > 1 for SPR components composed of aluminum 6111-T4 under a two-stage high–low test sequence, and as shown in Section 2.3, damage sums of D > 1 also occur for other riveted joints with sheet materials of aluminum and titanium.
Owing to the small database, this study explicitly warns against the general application of the IMAB method for SPR joints. In contrast to the original IMAB method, only two aluminum materials were investigated for the IMAB method for SPR joints. In the tests, the stress ratio R was chosen to be constant, and the focus was placed on normally distributed spectra. For a general application of the IMAB method for SPR joints, the underlying database must be expanded.
AUTHOR CONTRIBUTIONS
All authors have read and agreed to the published version of the manuscript. L.M. and M.W. conceptualized the study; M.O. and G.M. did the manufacturing of the specimen; L.M. carried out the tests; L.M. evaluated the tests; L.M. and M.W. wrote the original draft; L.M., M.W., A.E., and M.O. reviewed and edited the paper; A.E. and G.M supervised the study.
ACKNOWLEDGMENT
The authors would like to thank the Federal Ministry for Economic Affairs and Energy for financial support throughout the research project IGF project No. 19760 N “Simulation-based fatigue strength analysis of self-piercing riveted components” of EFB according to a decision of the German Bundestag.
Open access funding enabled and organized by Projekt DEAL.
NOMENCLATURE
-
- A
-
- service life factor
-
- C
-
- coefficient of the S-N curve
-
- D
-
- damage sum
-
- d
-
- damage share of one cycle
-
- Deff
-
- effective damage sum
-
- Fa
-
- force amplitude
-

-
- maximum value of load spectrum (force)
-
- FaE
-
- endurance limit (force)
-
- Fmax
-
- maximum force
-
- Fmin
-
- minimum force
-
- H
-
- cumulative frequency of number of cycles in load spectrum
-
- H0
-
- overall number of cycles in spectrum
-
- IIMAB
-
- exponent of IMAB method
-
- ISPR
-
- exponent of IMAB method for SPR
-
- IO
-
- coefficient of IMAB method
-
- Isup
-
- support point of IMAB method for SPR
-
- k
-
- slope of S-N curve
-
- m
-
- median value
-
- mk
-
- slope of crack propagation S-N curve
-
- N
-
- number of cycles to crack initiation
-
- Ncalc
-
- calculated service life
-
- Ncalc,Deff = 1
-
- calculated service life with Deff = 1
-
- Nconst
-
- fatigue life under constant amplitude loading
-
- NK
-
- knee point of the S-N curve
-
- Ntest
-
- experimental service life
-
- R
-
- stress ratio
-
- SPR
-
- self-piercing rivet
-
- T
-
- deviation range
-
- t
-
- sheet thickness
-
- z
-
- number of load spectra repetitions
-
- ν
-
- shape parameter of spectrum
ENDNOTE
Open Research
DATA AVAILABILITY STATEMENT
The data that support the findings of this study are available from the corresponding author upon reasonable request.


