Variational autoencoders for anomaly detection in the behaviour of the elderly using electricity consumption data
Funding information: V PRICIT (Regional Programme of Research and Technological Innovation); Madrid Government (Comunidad de Madrid-Spain); Universidad Carlos III de Madrid, and Competitiveness (MINECO), Grant/Award Numbers: RTC-2016-5059-8, RTC-2016-5191-8, RTC-2016-5595-2, TEC2017-88048-C2-2-R; Spanish Ministry of Economy; Company MasMovil
Abstract
According to the World Health Organization, between  and
and  , the proportion of the world's population over
  will double, from
  to
to  . In absolute numbers, this age group will increase from
  million to
  billion in the course of half a century. It is a reality that most of them prefer to live alone, so it is necessary to look for mechanisms and tools that will help them to improve their autonomy. Although in recent years, we have been living in a veritable explosion of domotic systems that facilitate people's daily lives, it is also true that there are not many tools specifically aimed at this sector of the population. The aim of this paper is to present a potential solution to the monitoring of activity of daily living in the least intrusive way for people. In this case, anomalous patterns of daily activities will be detected by analysing the daily consumption of household appliances. People who live alone usually have a pattern of daily behaviour in the use of household appliances (coffee machine, microwave, television, etc.). A neuronal model is proposed for the detection of abnormal behaviour based on an autoencoder architecture. This solution will be compared with a variational autoencoder to analyse the improvements that can be obtained. The well-known dataset called UK-DALE will be used to validate the proposal.
1 INTRODUCTION
The world population is ageing rapidly. Projections are that people 60 years old or older will outnumber children by 2030 and adolescents and youth by 2050 (United Nations, 2015). As the population ages, the need is increasing for policies, systems, and technologies that support healthy ageing. Ageing leads to gradual physical decay, which increases dependency on others. That is why there are initiatives that promote the independence of the elderly, in terms of carrying out daily activities, and bet for active ageing. Therefore, concepts such as “independent living”, “active ageing”, “ageing at home” form the nucleus of proposals for integrated care services for the elderly.
One of the most common diseases in older people is Mild Cognitive Impairment (MCI), which is experiencing significant growth due to increased life expectancy. Older age is associated with functional decline manifesting itself in deficits in spatial disorientation. This disorientation (“wandering” or “getting lost”) is defined as the loss of the individual while performing a normal activity, which can be used to assess the degree of impairment in early stages of dementia or MCI. In order to be able to monitor the activity of people at risk for MCI there are two types of strategies. On the one hand, restrictive systems (e.g., door locking or medication), which lead to a loss of independence of older people. On the other hand, monitoring systems using some form of sensorisation (Bozan & Berger, 2019; Ghayvat et al., 2018; Monekosso et al., 2015). These scenarios represent intelligent environments capable of unobtrusively recognizing the presence of individuals and seamlessly reacting to them. To achieve this goal, a multitude of sensors are embedded in the environment that acquire and exploit data to generate an appropriate response through actuators, using communication systems and computational processes. The deployment of sensors and actuators and communications must be developed using the Internet of Things paradigm (Bustamante et al., 2019).
Most monitoring services have been based on the use of sensors deployed in people's homes. Several sensors have been used for the deployment of monitoring services, with video cameras being the most commonly used sensors, as they allow for the retrieval of richer information on the scenarios to be monitored. The disadvantages of these sensors are, on the one hand, the price and, on the other hand, the complexity of the information to be processed (Anitha & Baghavathi Priya, 2019; Si et al., 2020; Ma et al., 2019; Rucco et al., 2018). In addition, the requirements demanded by the elderly regarding the high degree of security and privacy must be influenced. Video cameras are often considered as an invasive sensor, from the point of view of privacy, since users perceive that someone may be visualizing what is happening inside their home.
In recent years, research is being conducted to monitor the electricity consumption of homes. In this sense, there are works related to non-intrusive appliance load monitoring (NIALM) (Belley et al., 2014). NIALM is the process of dis-aggregating a household's total electricity consumption into its contributing appliances. Neural Networks have been used for the detection of anomalies in Electric Power Systems with auto-associative neural networks s (Martinelli et al., 2004) or autoencoders (Yuan & Jia, 2015). Autoencoders are a kind of neural network that allows to represent a compressed version of the input. The aim of the paper is to analyse the typical or normal behaviour modelling from the consumption of different appliances, so that they can be used in the prediction of anomalous behaviours within the daily activities of the elderly. The best appliance will be evaluated to be used in a detection system of anomalous behaviours within the daily activity of older people.
This paper intends to seek a novel approach for the monitoring of daily activities in the elderly homes. The aim of the paper is to evaluate the importance of the analysis of the electrical consumption of different domestic appliances, in order to be able to model the typical or normal behaviour in a person's daily activities. Once modelled the typical consumption of electrical appliances, this model will help us detect anomalous behaviour, within the consumption of household appliances, that help us to induce some kind of problem in the monitored house. For the development of this model, a single architecture is proposed using an approach based on Autoencoders (both in its classical and variational models), which allows the detection of anomalous behaviour with high probability.
The article is organized with a first part describing work related to the monitoring of elderly people in smart environments, as well as the most commonly used anomaly detection methods. Next, the problem to be solved is presented based on the information of the UK-DALE dataset. The last part of the document describes the results obtained and a discussion of them using neuronal models of autoencoders and varational autoencoders.
2 RELATED WORK
Within the ageing process, security and independence are among the main points of importance for the elderly (van Hoof et al., 2011). In the literature we can find numerous works dealing with the application of Information and Communication Technologies for the development of smart homes for assisted living systems (Mshali et al., 2018; Pal et al., 2018; Uddin et al., 2018). Although these solutions are evaluated in terms of their detection performance, it is equally important to evaluate the degree of acceptability of the end users. Broadly speaking, we can establish two types of categories depending on the technology and methodology detection adopted (Debes et al., 2016): wearable solutions and non-wearable solutions. Wearable solutions, as their name suggests, are based on sensors that are attached to the subject to measure their activity. They can be sensors that measure vital parameters related to cardiac activity (electrocardiograph) (Nadeem et al., 2019), respiration rate, heart rate (HR), temperature, and so forth. One of the most widely used devices are fitness wrist-wearable trackers (Henriksen et al., 2018). The advantages of incorporating this technology for monitoring the elderly is the ease of obtaining vital health parameters. However, they are not suitable for the analysis of people's behaviour, as well as the need to remember to carry the device with them, together with their limited energy demand.
On the other hand, there are non-wearable solutions, which are associated with sensory technology found in the space where people go about their daily lives. They are less intrusive solutions, in terms of contact with people's bodies, and require an installation process within the smart spaces to be monitored. Some of these devices can be switches, pressure or vibration sensors embedded in carpets or floor (Feng et al., 2016). Another type of sensors are those that can collect acoustic and/or visual information from a scenario by means of microphones (Li et al., 2012) or cameras (Zhang et al., 2019). These types of sensors obtain very rich and complex information that must be analysed, allowing good results to be obtained in terms of the type of activities that take place in a home. However, they come into conflict as they are rejected as solutions because they infringe on people's privacy. Especially in private areas such as bathrooms and toilets where the inclusion of a camera may be restricted.
This paper aims to analyse anomalous behaviour of elderly people by analysing the daily consumption of their household appliances. In Noury et al. (2011), it was shown how the analysis of electricity consumption is considered non-intrusive for residents. Furthermore, it has been shown that patterns of appliance use are related to people's daily life activities (Zhang et al., 2014). Therefore, in this work we propose to analyse the consumption of household appliances in order to evaluate if a certain day is developing an anomalous activity compared to the rest of the days.
Within the analysis of anomalies or outliers in sensory systems, the outlier concept is usually related to distortions of a certain function or measure due to noise or events. Noises or errors are identified as faults or malfunctions of the information source (Chen et al., 2015; Gaddam et al., 2020). The events define a change in sensory monitoring. An event can be air pollution (Putri & Sudarmilah, 2019), intrusion detection (Karami, 2018), or detection people falling (Medrano et al., 2016). In general, an event causes an unlikely atypical value that tends to change the historical behaviour of a variable.
The anomaly analysis problem can be treated from different techniques. From the point of view of the statistical techniques, a model of the set of instances that suppose a normal behaviour is constructed. An instance becomes outlier if the probability of belonging to the model is low (Neagu et al., 2017). Distance-based anomaly detection identifies anomalies based on the distance to a subset of elements close to it (Breunig et al., 2000). In Papa et al. (2020), techniques are proposed for the detection of anomalies in multi-density problems by means of the local outlier factor. Another method is spectral decomposition, where data are embedded in a smaller subspace where data instances can be easily discriminated. Many techniques have emerged based on Principal Component Analysis (Ringberg et al., 2007). Some of them break down space into normal, abnormal and noisy subspaces. Anomalies can be detected in the subspace of anomalies (Fujimaki et al., 2005).
Clustering techniques group instances with similar attributes in clusters. A cluster describes a certain behaviour. It is considered that a sample is an outlier with respect to a certain cluster, if the distance between the sample and the cluster is relevant. The techniques based on classifiers have a learning process where atypical and normal behaviours are modelled. Statistical techniques require having data that adapt to a statistical distribution. However, behaviours can not always be modelled as a statistical distribution. On the other hand, the techniques based on clustering force each instance to be assigned to a cluster. It is likely that the anomalous instances do not belong to a single group or are associated with different large groups. The algorithms based on classifiers apply powerful algorithms that have been used in different environments. The best known are those based on Support Vector Machines (Li et al., 2003; Razzak et al., 2020).
Models based on neural networks are currently being used to detect anomalies in different areas, such as fraud-detection (Adewumi & Akinyelu, 2017), cyber-intrusion detection (Kwon et al., 2019), Internet of Things (IoT) (Mohammadi et al., 2018), sensor networks (Ball et al., 2017), and video anomaly detection (Kiran et al., 2018), among others. The aim of this paper is the analysis of the autoencoders to model our anomaly detection system in the behaviour of the elderly using electricity consumption data. Auto-encoders are neural networks with the aim of generating new data by first compressing the input into a space of latent variables and then reconstructing the output based on the acquired information. In recent years, another type of architecture called variational autoencoders (VAEs) has appeared that seeks to learn the parameters of a probability distribution that represents the data (Kingma & Welling, 2014; Rezende et al., 2014). This type of network has been used mainly to obtain generative models (Oussidi & Elhassouny, 2018), which are capable of producing synthetic data that follow the same patterns as the large datasets from which they feed. In this paper, the capabilities of autoencoders and VAEs will be assessed in order to model an anomaly detection system in the behaviour of the elderly using electricity consumption data.
3 PROBLEM STATEMENT
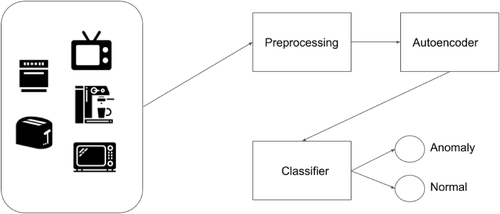
The problem that arises in this work is divided into different phases (see Figure 1). Starting from the real electrical consumption of different domestic appliances, a pre-processing of the signals will be carried out. This pre-processing is related to the elimination of outliers (days considered as vacations, for example), as well as the organization of the information in a set of variables that indicate the summary of the daily behaviour of a house in terms of the electrical consumption of household appliances. The pre-processed signals will be used to model a normal behaviour in the electrical consumption of the different appliances. For each of the appliances, a typical or normal behaviour model will be obtained. In order to validate all the models associated with each appliance, a set of anomalous values will be obtained by shifting the original consumption and varying the amplitude values of the signals in a random way. Each of the models will be evaluated through the use of a classifier. This classifier will be designed using the value of the internal neurons of the autoencoder when at the entrance of the network both typical and abnormal behavioural samples are presented.
3.1 Dataset
The UK-DALE dataset (Kelly & Knottenbelt, 2015) is the dataset used for the experimentation. The power demand of five different houses during 4 years has been collected each 6 s. The power demand is collected at the appliance level and it is measured in watts. At Figure 2, the histograms of mean power demand is showed for each appliance. This dataset record both the individual appliances and the whole house power demand, but only the individual appliances power demand is used for this work. Since the use of appliances does not vary significantly between years, the data from the 4 years can be used in the work.
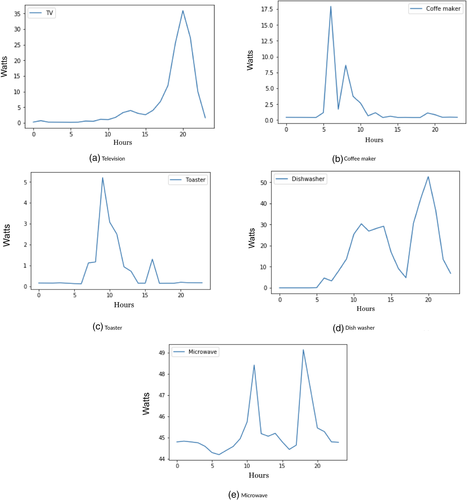
Television, coffee maker, toaster, microwave and dishwasher are the appliance used for this work. Those appliance are very common in a home and they are relevant for the anomalies detection. Only one house has been considered since the habits of use of each appliance can vary significantly between houses.
3.2 Data preprocessing
A data pre-processing work has been done to the dataset. The power demand is grouped per hour. The mean power demand is shown on Figure 2. The appliance usage pattern of each appliance it is different, which will help the model to find anomalies. The proposed model has 24 variables and each variable represents the total watt consumption at that hour. Some outliers have been removed because it may affect the performance of the model. For example, those days without data that might be vacation days or an bad data received from the sensor.
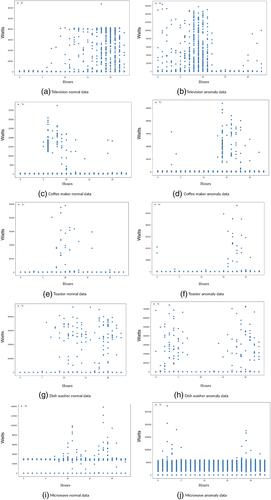
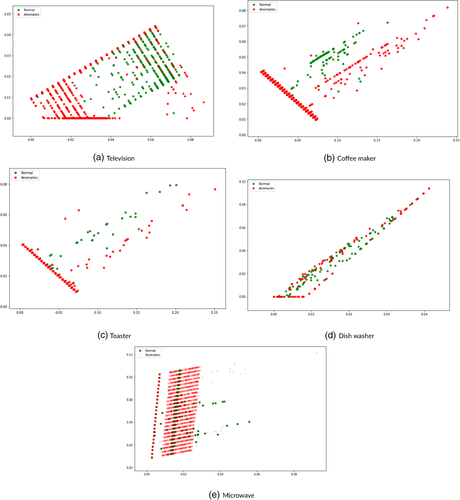
The next step is to generate the anomalies since the dataset do not provide it. As said at Evans (1987), a nocturnal activity may be associated with Dementia or Alzheimer, so the data has been displaced between 8 and 12 h. The data have been multiplied by a random factor between  . The data have been splitted
  for training and
  for validation. In Figure 3, it is shown the representation of both normal and anomaly power demand for each appliance.
3.3 Autoencoders and variational autoencoders for anomaly detection
An autoencoder (AE) is a neural network where the number of input nodes is equal to the number of output nodes. The AE has a latent layer with a lower number of neurons (latent layer). The AEs are part of unsupervised learning, since they do not require labels for their training. This architecture tries to find an arbitrary function  that makes the input equal to the output, being W and b the weights and biases of the neural network (Baldi, 2012).
A VAE is a probabilistic graphic model that combines variational infererence with deep learning. VAE is a directed graphical probabilistic model whose posterior is approximated by a neural network, forming an architecture similar to that of an autocoder. Therefore, a VAE is an architecture composed of both an encoder and a decoder and which is trained to minimize the reconstruction error between the encoded–decoded data and the initial data.
Once a autoencoder is trained, the latent layers will extract the essential information of the input values. Those layers learn to ignore the noise and learn the patterns of the data. The data are represented in a smaller dimension, so the autoencoder is able to simplify the representation of the data. At this point, the output layer can be replaced with a classifier. This classifier input is only two variables, so the classification of the data into normal or anomaly data is simpler.
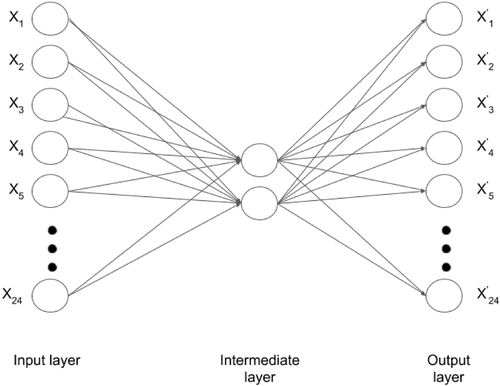
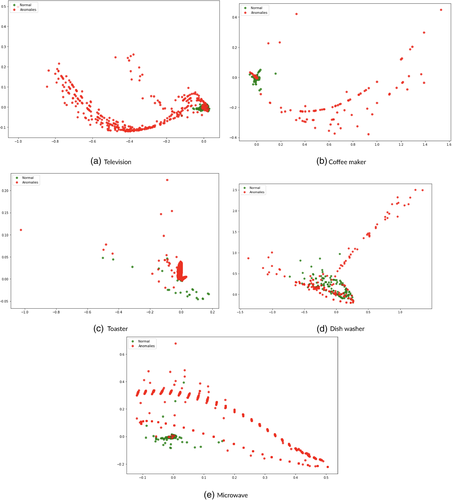
Both, AE and VAE of this paper have 24 input nodes as shown in Figure 4, where each input node is 1 h of the day. In the latent layer there are two neurons (the latent variables). The number of neurons of the latent layer has to be less than the input layers, or the latent layer could just copy the input layer to the output layer without extracting the essential information. For this work, an latent layer with two node has been selected in order to maximize the essential information extraction in order to detect anomalies.
In Figures 5 and 6, an example of data distribution of the latent variables are depicted. This two-dimensional representation facilitates the visualization of the separability between samples of normal and abnormal behaviour.
3.4 Anomalies classification
- Area under the curve (AUC) (receiver operating characteristics (ROC)): Measures the capacity of the model to differentiate the classes (Davis & Goadrich, 2006)
- Accuracy is the total percentage of items correctly classified. It is perhaps the simplest metric and is calculated by dividing the number of correct predictions by the total number of predictions.
- Recall is another important metric that is defined as the fraction of samples of a class that the model correctly predicts.
- F1 Score: Average of the accuracy and recall (Goutte & Gaussier, 2005).
4 EXPERIMENTATION
With all the described work done at the dataset and with both models trained with it, it is time to analyse the results obtained. The results of the appliance for each model are showed in Tables 1 and 2.
| AUC (ROC) | Accuracy | Recall | F1 score | |
|---|---|---|---|---|
| Television | 0.73 | 0.71 | 0.73 | 0.72 |
| Coffee maker | 0.73 | 0.73 | 0.71 | 0.72 |
| Toaster | 0.70 | 0.72 | 0.65 | 0.69 |
| Dish washer | 0.62 | 0.65 | 0.60 | 0.63 |
| Microwave | 0.86 | 0.88 | 0.84 | 0.86 |
- Note: The bold values are the best values of the metrics (AUC, Accuracy, Recall, F1 score) of the different appliances. The best value is the one that is close to unity.
| AUC (ROC) | Accuracy | Recall | F1 score | |
|---|---|---|---|---|
| Television | 0.89 | 0.89 | 0.90 | 0.90 |
| Coffee maker | 0.90 | 0.91 | 0.88 | 0.89 |
| Toaster | 0.71 | 0.87 | 0.42 | 0.59 |
| Dish washer | 0.84 | 0.93 | 0.76 | 0.85 |
| Microwave | 0.88 | 0.99 | 0.78 | 0.87 |
- Note: The bold values are the best values of the metrics (AUC, Accuracy, Recall, F1 score) of the different appliances. The best value is the one that is close to unity.
For the AE, the appliance that obtained the best result is the microwave. However, the results obtained with the VAE are signigicantly better for all the appliances. The confusion matrix of each appliance for both models is showed in Tables 3 and 4.
| Television | p | n | Coffee maker | p | n | ||
| p′ | 160 | 137 | p′ | 146 | 14 | ||
| n′ | 162 | 199 | n′ | 19 | 157 | ||
| Toaster | p | n | Dish washer | p | n | ||
| p′ | 107 | 41 | p′ | 178 | 178 | ||
| n′ | 57 | 130 | n′ | 150 | 153 | ||
| Microwave | p | n | |||||
| p′ | 291 | 39 | |||||
| n′ | 54 | 274 | |||||
| Television | p | n | Coffee maker | p | n | ||
| p′ | 299 | 27 | p′ | 154 | 11 | ||
| n′ | 23 | 309 | n′ | 10 | 160 | ||
| Toaster | p | n | Dish washer | p | n | ||
| p′ | 114 | 4 | p′ | 320 | 9 | ||
| n′ | 50 | 165 | n′ | 8 | 322 | ||
| Microwave | p | n | |||||
| p′ | 249 | 2 | |||||
| n′ | 68 | 313 | |||||
To avoid dangerous situations for the user, such as needing help but the model predicts a false negative, the model that gets the best result and minimize the false negatives must be chosen. Based on the comparison of all the metrics and the confusion matrices, the VAE improves the AE in all aspects, so it is the model proposed for the detection of anomalous behaviours by monitoring the electrical consumption of household appliances. This difference is due to the fact that the probability of reconstruction in a VAE is different from the reconstruction error of a simple AE, allowing the variability of the data to be represented.
5 CONCLUSIONS
This paper describes a novel method for the detection of anomalous behaviours by monitoring the electrical consumption of household appliances. Analysing its daily consumption in normal days will allow us to model the normal behaviour of the daily activity of the people within that home. A detection of an anomalous consumption will raise an alarm indicating that the behaviour is not the usual one, in order to communicate this incidence to the responsible persons.
A comparison has been made between auto-encoders and variational auto-encoders, which have a similar topological representation. From the corresponding latent layers, a classification algorithm based on Random Forest has been implemented. The results obtained show us how, for any type of household appliance, networks based on VAEs obtain substantial improvements with respect to the versions based on autoencoders. This is due to the probabilistic representation of the VAEs, allowing a better representation of the input data.
This method is a non-intrusive way of caring for people with Dementia or Alzheimer, as it will be able to detect in a precise way situations where the user requires attention and avoid possible dangerous situations derived from these diseases. For the future work, a better performance of the model can be achieved with other anomalies data. It would be interesting to test the model with real anomaly data or use a more precise method to generate anomalies. On the other hand, a combination of some appliances might achieve a better performance and it should be tested.
ACKNOWLEDGEMENTS
This work was funded by the private research project of Company MasMovil and the public research projects of the Spanish Ministry of Economy, Universidad Carlos III de Madrid, and Competitiveness (MINECO), references TEC2017-88048-C2-2-R, RTC-2016-5595-2, RTC-2016-5191-8 and RTC-2016-5059-8, and the Madrid Government (Comunidad de Madrid-Spain) under the Multiannual Agreement with UC3M in the line of Excellence of University Professors (EPUC3M17), and in the context of the V PRICIT (Regional Programme of Research and Technological Innovation).
CONFLICT OF INTEREST
The authors declare no conflict of interest.
Biographies
Daniel Gonzaléz is a SRE and a Backend Engineer at Masmovil Group. He reveiced a degree in Computer Science and a degree in Business Administration from Carlos III University in 2019. His research include the applications of artificial intelligence in both data and image models.
Miguel A. Patricio received his BSc in Computer Science in 1991, his MSc in Computer Science in 1995 and his Ph.D. in Artificial Intelligence in 2002, all from the Universidad Politécnica de Madrid. He is currently an Associate Professor at the Escuela Politécnica Superior of the Universidad Carlos III de Madrid. He is the coauthor of over 100 books, book chapters, journal papers, technical reports, etc., published by organizations including Elsevier, IEEE, ACM, AAAI, Springer Verlag, Kluwer, etc., and most of these present practical and theoretical achievements of data analysis, computer vision and distributed systems.
Antonio Berlanga has been an Associate Professor at the Universidad Carlos III de Madrid, Computer Science Department since 2000. He received a degree in Physics from the Autonomous University of Madrid, Spain, in 1995, and a Doctor in Computer Engineering degree from the Carlos III University of Madrid in 2000. His research interests include evolutionary computation, multiobjective evolutionary algorithms, machine learning and data mining.
José M. Molina is a Full Professor of computer science at Carlos III University of Madrid. He also coordinates the Applied Artificial Intelligence Group. His research focuses on applying soft-computing techniques to radar data processing, air traffic management, e-commerce, and ambient intelligence. Molina received a Ph.D. in Telecommunications Engineering from Universidad Politécnica de Madrid.
Open Research
DATA AVAILABILITY STATEMENT
Data sharing is not applicable to this article as no new data were created or analyzed in this study.


