Systematic assessment of duration and intensity of anodal transcranial direct current stimulation on primary motor cortex excitability
Abstract
Since the initial demonstration of linear effects of stimulation duration and intensity on the strength of after-effects associated with transcranial direct current stimulation (tDCS), few studies have systematically assessed how varying these parameters modulates corticospinal excitability. Therefore, the objective of this study was to systematically evaluate the effects of anodal tDCS on corticospinal excitability at two stimulation intensities (1 mA, 2 mA) and durations (10 min, 20 min), and determine the value of several variables in predicting response. Two groups of 20 individuals received, in two separate sessions, 1 and 2 mA anodal tDCS (left primary motor cortex (M1)-right supra-orbital montage) for either 10- or 20-min. Transcranial magnetic stimulation was delivered over left M1 and motor evoked potentials (MEPs) of the contralateral hand were recorded prior to tDCS and every 5 min for 20-min post-tDCS. The following predictive variables were evaluated: I-wave recruitment, stimulation intensity, baseline M1 excitability and inter-trial MEP variability. Results show that anodal tDCS failed to significantly modulate corticospinal excitability in all conditions. Furthermore, low response rates were identified across all parameter combinations. No baseline measure was significantly correlated with increases in MEP amplitude. However, a decrease in inter-trial MEP variability was linked to response to anodal tDCS. In conclusion, the present findings are consistent with recent reports showing high levels of inter-subject variability in the neurophysiological response to tDCS, which may partly explain inconsistent group results. Furthermore, the level of variability in the neurophysiological outcome measure, i.e. MEPs, appears to be related to response.
Introduction
Transcranial direct current stimulation (tDCS) is a non-invasive brain stimulation technique that is known to induce a polarity-specific modulation of primary motor cortex (M1) corticospinal excitability that outlasts stimulation duration. Initial studies showed that the duration and strength of the tDCS after-effect are dependent upon the intensity and duration of stimulation. Indeed, near-linear effects of stimulation intensity (0.2–2.0 mA) and duration (from 1 to 13 min) were found (Nitsche & Paulus, 2000, 2001). Since these early studies, there has been a tendency in tDCS research to increase duration and intensity of stimulation with the expectation of greater effects in behavioral and neurophysiological outcome measures (Batsikadze et al., 2013). Yet, a limited number of studies have systematically assessed the consequences of varying stimulation parameters on tDCS after-effects.
Findings from recent studies have shown that the relationship between duration, intensity, and strength of the after effect may be more complex than what was initially believed. For instance, reversal of polarity-specific effects was observed for anodal tDCS when stimulation duration was doubled from 13- to 26-min (Monte-Silva et al., 2013) and for cathodal tDCS when current intensity was doubled from 1 to 2 mA (Batsikadze et al., 2013). In addition, a recent study reported no significant difference in the response to several stimulation intensities for 10-min anodal tDCS (0.2–2.0 mA; N = 29; Chew et al., 2015). Importantly, the same study reported high inter-individual variability and no significant effect at the group level (Chew et al., 2015).
The reported absence of group effects and important inter-individual variability (Chew et al., 2015) supports an increasing body of literature (López-Alonso et al., 2014; Wiethoff et al., 2014; Labruna et al., 2015; Li et al., 2015; Strube et al., 2015; Vallence et al., 2015), suggesting that specific individual factors may play a major role in the response to non-invasive brain stimulation protocols. A number of factors that modulate responsiveness have been identified (see Li et al., 2015 for review), including sensitivity to transcranial magnetic stimulation (TMS) revealed by stimulation intensity (Labruna et al., 2015), and baseline cortical excitability and ability to recruit indirect-wave (I-wave) (Wiethoff et al., 2014). Although this remains to be directly investigated, variations in inter-trial variability in TMS-induced motor evoked potential (MEP) amplitudes (Kiers et al., 1993; Thickbroom et al., 1999) could also be associated with variable tDCS response.
In line with recent studies that specifically assessed the effect of the anodal polarity (Chew et al., 2015; Labruna et al., 2015; Strube et al., 2015), we aimed to systematically assess the effect of anodal tDCS duration and intensity on corticospinal excitability. Based on a recent review of the literature (Horvath et al., 2014), intensities of 1 and 2 mA and durations of 10- and 20-min were selected to determine which set of parameters induces the largest corticospinal after-effects and best response rates. The second objective was to investigate the predictive value of several physiological measures (I-wave recruitment, sensitivity to TMS, baseline M1 excitability, inter-trial MEP variability) in determining the strength of corticospinal after- effects.
Material and methods
Participants and procedure
The study conformed to the World Medical Association Declaration of Helsinki. It was approved by the ethics committee of the Faculté des Arts et Sciences of the Université de Montréal and all participants provided written informed consent prior to testing. Forty right-handed participants were recruited (20 men; M = 24.6 years, SD = 4.4 years). Exclusion criteria included standard contraindications for tDCS and TMS such as a history of seizure, psychiatric or neurological disorders, and intake of medication that can modify cortical excitability (Nitsche et al., 2008; Rossi et al., 2009). The sample was pseudorandomly divided into two groups (i.e. equal number of male and female participants). Sample sizes were determined according to a previous study from our laboratory, which yielded significant changes in 10 participants with similar characteristics (Tremblay et al., 2013). In light of recent studies suggesting high inter-individual response, this sample size was doubled. Each participant took part in two experimental sessions that differed according to the intensity of stimulation that was delivered (1 mA; 2 mA). This mixed crossover design was chosen to account for participant availability. For Group 1, tDCS duration was 10-min, whereas tDCS was delivered for 20-min in Group 2. Condition order was counterbalanced and each session was separated by at least 72 h. No sham condition was included because the goal of the study was to compare the effects of different stimulation intensities and durations on post-tDCS response. The experiment was single-blinded (participants only).
Experimental procedures
Recordings
Electromyographic (EMG) activity was recorded from the first dorsal interosseus (FDI) muscle of the right hand, using surface electrodes. EMG signal was filtered with a bandwith of 20–1000 Hz and digitized at a sampling rate of 4 kHz, using a Powerlab 4/30 system (ADInstruments, Colorado Springs, USA). MEPs were recorded, using LabChart7 software (ADInstruments, Colorado Springs, USA) and stored offline for analysis.
Transcranial magnetic stimulation
TMS was delivered through an 8 cm figure-of-eight coil connected to a Magstim 2002 stimulator (Magstim Company Ltd, Spring Gardens, UK). The coil was positioned flat on the head of participants at a 45° angle from the midline, with the handle pointing backwards (posterior-anterior position). A monophasic current was delivered. First, the optimal site of stimulation was defined as the coil position from which TMS produced an MEP of greatest amplitude in the FDI muscle following the most recent consensus of the International Federation of Clinical Neurophysiology (Rossini et al., 2015). Next, the intensity of stimulation was adjusted to elicit MEPs of average amplitude of 1 mV peak-to-peak (SI1 mV) for 10 consecutive trials in the relaxed contralateral FDI. The optimal site of stimulation was registered through a stereotactic neuronavigation system (Brainsight; NeuroConn GmbH, Ilmenau, Germany) and monitored throughout the experiment. For both experimental sessions, a block of 20 MEPs (SI1 mV) was acquired before stimulation (PRE), as well as every 5 min post-tDCS (T0, T5, T10, T15, T20). TMS pulses were delivered at a frequency of 0.1–0.2 Hz.
For both groups, latency measurements were acquired at the beginning of the first session, using three coil orientations: posterior-anterior (PA: 45° orientation), anterior-posterior (AP: 180° to the PA currents), and lateral-medial (LM: 90° to the PA currents) (see Hamada et al., 2013) for the complete procedure). For the AP and PA coil positions, the active motor threshold (aMT) was first measured. This was achieved by determining the lowest stimulator output intensity required to evoke a MEP of at least 200 μV in 5 of 10 consecutive trials while participants maintained a muscle contraction of 10% of their maximal strength in the right FDI. Next, 10 MEPs were recorded for each orientation during muscle contraction. For AP and PA orientations, a stimulation intensity of 110% of the aMT was used. To ensure the recruitment of direct waves using the LM orientation, the intensity of stimulation was set at 50% of the maximum stimulator output.
TMS data analysis
Peak-to-peak MEP amplitudes were calculated for each TMS trial and averaged. Trials were discarded if there was significant EMG activity (over 20 μV) during the 100 ms pre-stimulus period. For each time-point post-tDCS (T0–T20), the after-effect on corticospinal excitability was expressed as the ratio of the post-tDCS MEP mean amplitude over the baseline MEP measure. For the latency measures, the onset latency of the MEPs for each coil orientation was calculated using a semi-automated method described previously (Hamada et al., 2013) and averaged for each orientation. Latency differences between the different coil orientations were then calculated (AP-LM, AP-PA, PA-LM).
Transcranial direct current stimulation
Electrical current was delivered, using a NeuroConn DC-stimulator plus (NeuroConn GmbH, Ilmenau, Germany) through a pair of rectangular conductive rubber electrodes (35 cm2) inserted into saline-soaked sponges. The center of the anode was positioned over the FDI muscle representation of the left M1, previously determined using TMS. The cathode was positioned over the right supra-orbital region. Both electrodes were oriented parallel to the central sulcus. Depending upon the condition and experimental group, a constant electric current of 1 or 2 mA was applied for 10- or 20-min, and the current was gradually increased and decreased during the first and last 15 s of stimulation. During stimulation, participants were instructed to maintain a relaxed state of mind and to keep their hands in a relaxed position. To standardize the procedure, there was no interaction between the experimenter and the participant during stimulation.
Results and statistical analyses
All statistical analyses were computed using a standard statistical software package (spss 21, IBM, NY, USA). A P value of < 0.05 was considered statistically significant and was adjusted for multiple comparisons (Bonferonni correction). For repeated measures (RM) anovas, T-tests were computed as post hoc analyses. When necessary, the Greenhouse-Geisser correction was used to adjust for non-sphericity of data.
Effects of 1 and 2 mA for 10- and 20-min anodal tDCS on M1 corticospinal excitability
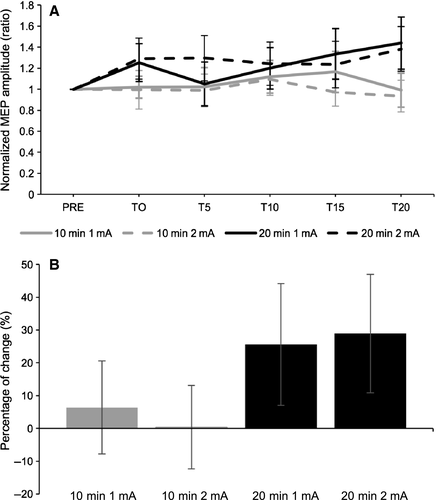
To assess the effect of time on MEP amplitudes for each set of parameters, one-way RM anovas with “Time” (6 levels: PRE to T20) as within subject-factor were computed on each of the four combinations of intensities and durations. No significant main effects were revealed (10-min 1 mA: F = 0.79, P = 0.56, η2partial = 0.04; 10-min 2 mA: F = 0.27, P = 0.93, η2partial = 0.01; 20-min 1 mA: F = 1.70, P = 0.14, η2partial = 0.08; 20-min 2 mA: F = 0.63, P = 0.68, η2partial = 0.03) To assess differences between combinations of parameters, a two-way mixed anova was conducted on normalized MEP amplitudes with “Duration” (2 levels: 10-min, 20-min) as the between-subjects factor and “Intensity” (2 levels: 1 mA, 2 mA) and “Time” (5 levels: T0 to T20) as the within-subject factors. No significant main effects or interactions were revealed (Table 1 and Fig. 1A). To assess the global change in MEP amplitude post-tDCS, a two-way mixed anova was computed on raw MEPs with “Time” (2 levels: pre, grand-average post) and “Intensity” (2 levels: 1 mA, 2 mA) as within-subject factors and “Duration” (2 groups: 10-min, 20-min) as the between-subjects factor (see Fig. 1B for percentage of MEP change). Results showed no significant main effect (intensity: F(1,38) = 0.05, P = 0.82, η2partial = 0.001; time: F(1,38) = 1.57, P = 0.22, η2partial = 0.04; condition: F(1,38) = 0.08, P = 0.78, η2partial = 0.002) or interactions (intensity*condition: F(1,38) = 0.001, P = 0.98, η2partial = 0.0001; time*condition: F(1,38) = 0.76, P = 0.39, η2partial = 0.02; intensity*time: F(1,38) = 0.05, P = 0.83, η2partial = 0.001; intensity*time*condition: F(1,38) = 0.20, P = 0.365, η2partial = 0.005).
| Effect | F | Sig | ƞ2 partial | df |
|---|---|---|---|---|
| Main effects | ||||
| Time | 0.52 | 0.73 | 0.01 | 1, 37 |
| Intensity | 0.02 | 0.90 | 0.0001 | 1, 37 |
| Group | 1.69 | 0.20 | 0.04 | 1, 37 |
| Interactions | ||||
| Time * group | 1.37 | 0.25 | 0.04 | 4, 37 |
| Time * intensity | 0.78 | 0.54 | 0.02 | 4, 37 |
| Intensity *group | 0.13 | 0.72 | 0.003 | 4, 37 |
| Time * intensity * group | 0.11 | 0.74 | 0.003 | 4, 37 |
Inter-individual variability
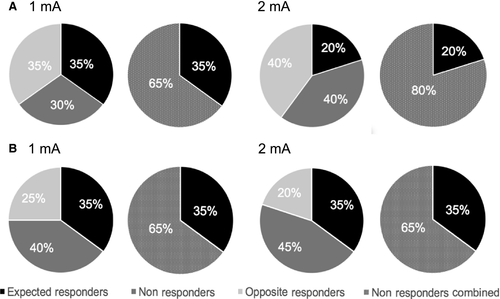
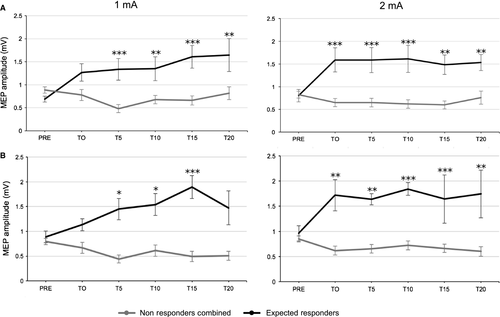
For all four parameter combinations, the classification of response rate was based on the standard error of the mean (SEM; Simeoni et al., 2015). The SEM of the 20 baseline MEPs was averaged at the individual level and then a grand average of the individual SEMs was computed for each of the four conditions. The grand-average of normalized MEPs (T0 to T20) was considered as a significant change following stimulation when it exceeded ± 95% confidence interval of the baseline SEM value (average SEM*1.96). These values were then averaged for the 1 mA and 2 mA conditions in order to use a single criterion between groups (10 and 20 min: ± 0.27). Using this criterion, individuals were divided into three clusters as follows: “expected responders” (ER: ratio > 1.27), “non-responders” (NR: 1.27> ratio < 0.73) and “opposite responders” (OR: ratio < 0.73). For further statistical analyses, OR and NR groups were merged into a single group of “non-responders combined” (NR-combined). Response rates for the two- and three-cluster classifications are shown in Fig. 2. For both experimental groups, repeated measures anovas on raw MEPs were used to assess the difference between ER and NR-combined (Fig. 3).
Intra-individual variability
To assess for the tendency of participants from both groups to respond in a similar manner to both intensities of anodal tDCS, intraclass coefficients (ICC) were calculated for the following variables: two-clusters (ER, NR-combined), three-clusters (ER, NR, OR) and grand-average of normalized MEPs. ICC values were classified as non-reliable (negative value), poor (< 0.40), fair (0.40–0.59), good (0.60–0.74) or excellent (> 0.74) (Cicchetti & Sparrow, 1981; López-Alonso et al., 2015) . For the 10-min duration, the ICC analysis showed no reliability between both intensities for the grand-average of the normalized MEP amplitudes (Cronbach's α = 0.05), and poor reliability for the the 2-cluster classification (Cronbach's α = 0.27) and the 3-cluster classification (Cronbach's α = 0.17). For the 20-min duration, the ICC analysis showed fair reliability between both intensities for the grand-average of normalized MEP amplitudes (Cronbach's α = 0.56) and the 2- and 3-clusters classification (Cronbach's α = 0.51; α = 0.50, respectively).
Prediction of response
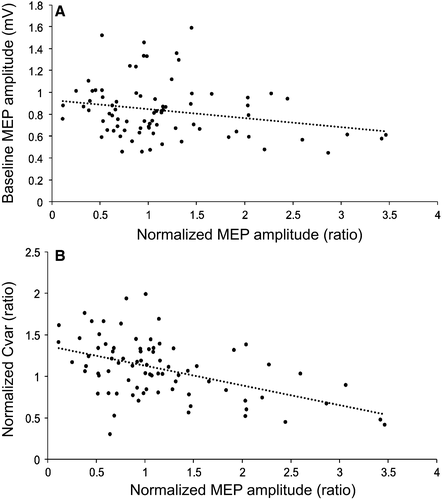
Pearson's partial correlation coefficients were computed on all four combination of parameters combined, controlling for “condition”, to investigate the relationship between baseline values and the grand-average of normalized MEPs (T0-T20). The following baseline variables were assessed: stimulator intensity (SI1 mV), mean latency difference (AP-LM, PA-LM, AP-PA), average baseline MEP amplitude (Baseline MEP), and baseline coefficient of variation in MEP amplitudes (Baseline Cvar). In addition, the relationship between one outcome variable and the grand-average of normalized MEPs (T0–T20) was assessed: grand-average of the coefficient of variation in MEP amplitudes post-tDCS (T0–T20) compared to the baseline (Normalized Cvar). Results are shown in Table 2. None of the baseline measures showed a significant relationship with the grand-average of normalized MEPs. However, the variable “Baseline MEP” showed a significant negative correlation with the grand-average of change, however that did not remain significant after correction for multiple comparisons (Fig. 4A). For the outcome measurement “Normalized Cvar”, a significant negative correlation with the grand-average of normalized MEPs was observed (Fig. 4B).
| Variables | r | P |
|---|---|---|
| Baseline | ||
| SI1 mV | 0.11 | 0.37 |
| AP-LM | −0.02 | 0.86 |
| AP-PA | −0.06 | 0.62 |
| PA-LM | 0.04 | 0.76 |
| Baseline MEP | −0.26 | 0.03 |
| Baseline Cvar | 0.12 | 0.30 |
| Outcome | ||
| Normalized Cvar | −0.48 | 0.0001a |
- a P < 0.007 (Bonferonni-corrected).
Discussion
This study systematically investigated the effect of the four most commonly used sets of parameters of anodal tDCS, including two durations (10- and 20-min) and two current intensities (1 and 2 mA). First, the present results showed no significant group effect on corticospinal excitability with any of the four combinations of parameters. Second, there were remarkably low rates of responders across all four sets. Third, examination of response rates showed low rates of responders and no increase in response rates when intensity was increased for both groups. Finally, with the exception of a statistical trend for baseline MEP amplitudes, none of the baseline measures were related to changes in MEP amplitude following anodal tDCS.
Inter- and intra-subject variability
No significant group effect of anodal tDCS on M1 corticospinal excitability was found using the four sets of parameters, which is in line with a recent study that reported lack of significant group effects using different intensities of anodal tDCS (Chew et al., 2015). Although this contrasts with studies showing significant effects of stimulation using the same stimulation parameters (e.g. Suzuki et al., 2012; Batsikadze et al., 2013; Tremblay et al., 2013), these findings support the growing body of evidence suggesting that variability in response to stimulation limits the reproducibility of anodal tDCS effects. In addition, our results suggest that this variability does not seem to be specific to a set of parameters for anodal tDCS.
Moreover, analyses of response rates in our samples showed high rates of non-responders (NR: 30–45%; NR-combined: 65–80%), which is supported by the recent literature on inter-subject variability suggesting that the percentage of non-responders ranges, on average, from 40 to 55% (López-Alonso et al., 2014; Wiethoff et al., 2014; Hordacre et al., 2015; Strube et al., 2015; Vallence et al., 2015). What is striking, however, is the very low percentage of expected responders that was observed in our samples (between 20 and 35%). This could be partly due to the strict threshold for responder classification that was selected in this study. Indeed, previous studies have used different criteria for selection of responders that are mainly arbitrary, ranging from a ratio over 1.0–1.5 (Wiethoff et al., 2014; Chew et al., 2015; Strube et al., 2015; Vallence et al., 2015), which may have resulted in an over/underestimation of the response rates. The use of a more objective criterion, such as the one used in this study (95% of confidence interval of the baseline SEM) may allow better comparison between future studies and more robust group classification. For instance, this criterion has the advantage of taking into account the error of the mean of MEP amplitudes at baseline in classifying what is considered a significant change following tDCS, and therefore takes into account the specificity of the sample.
Regarding intra-subject variability, the 10-min sample showed no reliability between the average response to tDCS, and poor reliability between the two current intensities for both cluster classifications. This result is, however, not surprising considering the nonlinear effect of intensity on response rates (as discussed below). For the 20-min sample, fair reliability coefficients were noted suggesting that individuals tended to respond in a similar manner to both stimulation intensities. This latter finding is consistent with recent studies showing good intra-subject reliability of anodal tDCS when using consistent parameters (López-Alonso et al., 2015).
Relationship between intensity, duration and response rates
Although no significant differences were found between the four stimulation conditions, a pattern of response to current and intensity variations was suggested through the examination of response rates, where increasing the intensity of stimulation resulted in the absence of an increase in the magnitude of after-effects on MEPs nor response rates. For the 10-min condition, 1 mA stimulation resulted in an equal rate of expected and opposite responders. In contrast, for 2 mA, the number of individuals who showed inhibition following stimulation was twice as large as that of subjects showing facilitation, (40 vs. 20%). For the 20-min condition, there was no increase in the number of expected responders associated with an increase in stimulation intensity. In sum, doubling the intensity did not change the rate of response in the 20-min condition but showed a higher percentage of individual displaying inhibition of cortical excitability for the 10-min condition.
Changes concerning duration of stimulation are difficult to interpret because both durations were delivered in different samples and any change could therefore be linked to differences inherent to the individuals included in both samples. Nevertheless, the response rates show that for 1 mA, 10-min and 20-min durations display an equal rate of expected responders. For an intensity of 2 mA, the 20-min duration shows a higher response rate than 10-min (35 vs. 20%). It may suggest that prolonging stimulation duration of anodal tDCS increases the percentage of responders for those specific parameters.
Predictors of response to anodal tDCS
Correlational analyses were used to assess the relationship between average MEP amplitude following tDCS and several baseline measurements. Because no significant differences were observed in cortical excitability changes between all four sets of parameters, they were included in a single correlation analysis controlling for all four different conditions. Results showed no significant link between modulation of corticospinal excitability and baseline variables that were previously shown to be predictive of response such as sensitivity to TMS (Labruna et al., 2015), baseline MEP amplitude (Wiethoff et al., 2014), and I-wave recruitment (Wiethoff et al., 2014; McCambridge et al., 2015). This suggests that the relationship between these variables may be less strong and consistent than initially proposed. For instance, as it was previously shown (Wiethoff et al., 2014), the individuals with the lowest baseline MEP amplitudes tended to have a greater response to tDCS, although the correlation did not remain significant when corrected for multiple comparisons. This indicates that caution should be taken when determining stimulation intensity for baseline recordings as ceiling effects and reduced sensitivity may be induced in non-responders. Further studies should explore the relationship between stimulation intensity used at baseline and response to anodal tDCS.
Interestingly, while the baseline inter-trial variability in MEP amplitude was not related to MEP change, the ratio of the post/pre tDCS coefficient of variation was negatively correlated with the average response to tDCS. Although a change in inter-trial MEP variability following tDCS cannot be considered as a predictor, reductions in inter-trial variability in MEP amplitudes following anodal tDCS were associated with increases in MEP amplitude following anodal tDCS. While difficult to interpret, this finding suggests that part of the observed variability in response to tDCS may be due to this intrinsic variability in the outcome MEP measure. In addition, it suggests that tDCS may not only have an effect on the amplitude of the MEPs, but possibly also modifies the distribution of MEPs via a reduction in their variability. Although the physiological underpinnings of this phenomenon remain unknown, it is possible to hypothesize that tDCS enhances the synchronization of neurons within M1 (Rösler et al., 2008) and reduces random noise at the membrane of the stimulated neurons (Goetz et al., 2014), which in turn reduces variability. Further studies are needed to better understand the involvement of MEP variability in response to plasticity protocols.
Conclusion
In summary, this study suggests that none of the most frequently used tDCS parameters effectively modify cortical excitability at a group level. Based on an objective classification of response rates, low levels of responders were obtained, with response rates ranging from 20% (10-min, 2 mA) to 35% (20-min 1 and 2 mA). Strikingly, these rates of response are highly similar to what would be expected from a random distribution. This suggests that these anodal tDCS paradigms lack in sensitivity and effectiveness. In addition, contrary to recent reports, sensitivity to TMS and late I-wave recruitment were not linked to average response to anodal tDCS. The relationship between reduced inter-trial MEP variability after stimulation and increased MEP amplitude suggest that MEP amplitude variability may contribute to variability to response to anodal tDCS.
Acknowledgements
We thank Professor John Rothwell for his comments on the manuscript. This work was supported by grants from the Canadian Institutes of Health Research and the Natural Sciences and Engineering Research Council of Canada. ST was supported by a postdoctoral fellowship from the Canadian Institutes of Health Research.
Abbreviations
-
- aMT
-
- active motor threshold
-
- AP
-
- anterior-posterior
-
- Cvar
-
- coefficient of variation
-
- EMG
-
- electromyographic
-
- ER
-
- expected responders
-
- FDI
-
- first dorsal interosseous
-
- ICC
-
- intra-class correlation
-
- I-waves
-
- indirect waves
-
- LM
-
- lateral-medial
-
- M1
-
- primary motor cortex
-
- MEP
-
- motor evoked potential
-
- NR
-
- non-responders
-
- OR
-
- opposite responders
-
- PA
-
- posterior-anterior
-
- tDCS
-
- transcranial direct current stimulation
-
- TMS
-
- transcranial magnetic stimulation


