Additional effects of exercise to hypocaloric diet on body weight, body composition, glycaemic control and cardio-respiratory fitness in adults with overweight or obesity and type 2 diabetes: A systematic review and meta-analysis
Abstract
Aims
This systematic review and meta-analysis evaluates the additional effect of exercise to hypocaloric diet on body weight, body composition, glycaemic control and cardio-respiratory fitness in adults with overweight or obesity and type 2 diabetes.
Methods
Embase, Medline, Web of Science and Cochrane Central databases were evaluated, and 11 studies were included. Random-effects meta-analysis was performed on body weight and measures of body composition and glycaemic control, to compare the effect of hypocaloric diet plus exercise with hypocaloric diet alone.
Results
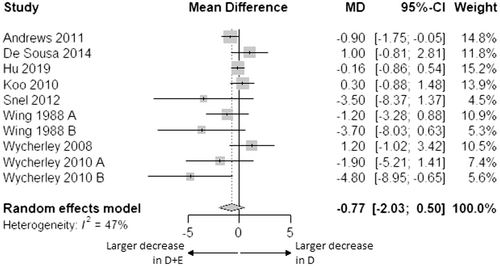
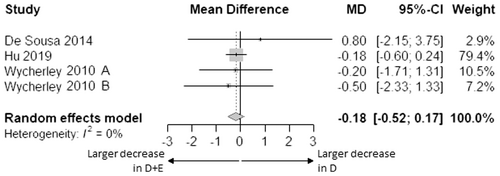
Exercise interventions consisted of walking or jogging, cycle ergometer training, football training or resistance training and duration varied from 2 to 52 weeks. Body weight and measures of body composition and glycaemic control decreased during both the combined intervention and hypocaloric diet alone. Mean difference in change of body weight (−0.77 kg [95% CI: −2.03; 0.50]), BMI (−0.34 kg/m2 [95% CI: −0.73; 0.05]), waist circumference (−1.42 cm [95% CI: −3.84; 1.00]), fat-free mass (−0.18 kg [95% CI: −0.52; 0.17]), fat mass (−1.61 kg [95% CI: −4.42; 1.19]), fasting glucose (+0.14 mmol/L [95% CI: −0.02; 0.30]), HbA1c (−1 mmol/mol [95% CI: −3; 1], −0.1% [95% CI: −0.2; 0.1]) and HOMA-IR (+0.01 [95% CI: −0.40; 0.42]) was not statistically different between the combined intervention and hypocaloric diet alone. Two studies reported VO2max and showed significant increases upon the addition of exercise to hypocaloric diet.
Conclusions
Based on limited data, we did not find additional effects of exercise to hypocaloric diet in adults with overweight or obesity and type 2 diabetes on body weight, body composition or glycaemic control, while cardio-respiratory fitness improved.
Novelty statement
What is already known?
- Hypocaloric diet and exercise have independent benefits for adults with type 2 diabetes.
What this study has found?
- The added value of exercise on body weight, body composition and glycaemic control seems minimal compared to the effects of hypocaloric diet alone.
- Cardio-respiratory fitness improves upon the addition of exercise to hypocaloric diet.
What are the implications of the study?
- Hypocaloric diet seems to be the main component in the treatment of type 2 diabetes.
- However, additional research focusing on the impact of exercise type and intensity is required to optimize treatment.
1 INTRODUCTION
Type 2 diabetes is highly prevalent, especially among older adults who are overweight or obese.1 These adults have a high risk of adverse health conditions, including cardiovascular disease, kidney disease, cancer, physical disability and sarcopenia.2, 3 This may lead to a vicious cycle that further worsens metabolic abnormalities.4 Obesity management is beneficial in the treatment of type 2 diabetes5 and may break this vicious cycle. While hypocaloric dieting has since long been recognized as the main strategy to achieve weight loss and improve glucose homeostasis, combined lifestyle interventions (including hypocaloric diet and exercise) are gaining more attention as an effective weight loss strategy.6
A hypocaloric diet can lead to the recommended weight loss of ≥5% of total body weight and has been shown to reduce glycated haemoglobin (HbA1c) and the need for glucose-lowering medication.7-9 However, caloric restriction not only reduces regional and total fat mass but may also lead to a significant decrease in lean body mass.10 This can result in functional decline and reduced metabolic rates,3, 11 which complicates further weight loss or weight maintenance.
Exercise has the potential to counteract a decrease in lean body mass and functional decline. Addition of exercise to a hypocaloric diet leads to improved cardiovascular fitness, muscle strength and body composition outcomes in obese adults without type 2 diabetes, as shown by two systematic reviews including one meta-analysis.12, 13 In adults with type 2 diabetes, there is substantial evidence that exercise improves glycaemic control.14, 15 Exercise, therefore, seems to be a good addition to a hypocaloric diet in adults with overweight or obesity and type 2 diabetes. Most studies in this population have examined the combined effects of hypocaloric diet and exercise8, 16-18 or have examined both interventions separately.7-9, 14, 15 As a consequence, the additional effects of exercise to hypocaloric diet in adults with overweight or obesity and type 2 diabetes is not yet clear. Such knowledge, including effects of type and intensity of exercise,19 is important to be able to tailor treatment to the specific goals of the individual.
This systematic review and meta-analysis aims to evaluate the additional effects of exercise to hypocaloric diet on body weight, body composition, glycaemic control and cardio-respiratory fitness in adults with overweight or obesity and type 2 diabetes. Secondly, we aim to explore the additional effects of endurance vs. resistance exercise and high vs. low exercise intensity on top of hypocaloric diet in this population.
2 METHODS
This systematic review used the Cochrane method for systematic reviews of interventions.20 The study protocol was registered in FigShare, an online open-access repository, on 23 March 2021.21
2.1 Search strategy
On 14 July 2020, the following electronic databases were searched for eligible studies: Embase, Medline (Ovid), Web of Science and Cochrane Central. The specific search strategies were supervised by a health science librarian with expertise in systematic review searching. The Embase search strategy is presented in Table S1. The Embase strategy was adapted to the syntax of the other databases (Tables S2–S4). In addition to the database search, reference lists of included studies, as well as relevant reviews, were manually checked to identify additional studies for inclusion.
2.2 Study selection
The records were imported into Endnote X9 where duplicates were removed. All titles and abstracts were screened independently by two reviewers (AH and MH), followed by full-text evaluation for final study inclusion. Any disagreement about inclusion/exclusion was resolved in consultation with a third reviewer (RGM).
Studies published in English were included that examined an adult human population with type 2 diabetes and a mean BMI of ≥25 kg/m2 and that had a randomised controlled design evaluating any type of hypocaloric diet in combination with physical activity compared with the hypocaloric diet alone. There was no restriction regarding the year of publication.
2.3 Data extraction
Two reviewers (AH and MH) extracted the data from the included papers using a table with pre-specified items according to the study protocol, and data extraction was checked by a third reviewer (RGM). Outcomes of interest included anthropometry and body composition measures (body weight, BMI, waist circumference, muscle mass, lean body mass, fat-free mass and fat mass), metabolic measures (fasting blood glucose, HbA1c, 2-h glucose from OGTT and insulin sensitivity or resistance) and physical performance measures (leg strength, chair stand, walking speed and VO2peak or VO2max).
2.4 Risk of bias assessment
Two reviewers (MH and RGM) independently assessed the risk of bias of all included studies using the revised Cochrane risk of bias tool,22 and discrepancies were resolved. Two outcomes were selected for each study: body weight or BMI and fasting glucose or HbA1c. Risk of bias assessment was applied to the evaluation of the effect of adhering to the intervention, with failures in implementation and non-adherence as our selected deviations. Initially, the only sources during this assessment were journal articles, and trial registries if available. Contact with all corresponding authors was initiated and both the trial protocol and statistical analysis plan were requested. Eventually, one author provided additional information on study design or statistical analysis.
Non-reporting bias was assessed using Egger's test for outcomes body weight, BMI, fasting glucose and HbA1c, which had at least 10 studies included in the meta-analysis,20 and by visually exploring funnel plots.
2.5 Data synthesis and analysis
The study characteristics and results were summarized narratively. In addition, a meta-analysis was conducted for outcomes reported by at least three studies. Results on lean body mass from the study of Hu et al.23 were included in the meta-analysis for fat-free mass because we expected that any difference between change in lean body mass and fat-free mass would not be caused by changes in bone mass within 6 months. Mean changes during the interventions were used for a random-effects meta-analysis. Standard errors (SE) and confidence intervals (CIs) were converted into standard deviations (SD). Reported logarithmic values were interpreted as natural logarithms.
In some studies, no changes from baseline were reported,24, 25 or changes were missing for some outcomes.25-28 For these studies, change was estimated based on baseline and post-intervention mean. SD of change was estimated based on baseline and post-intervention SD, and their mutual average correlation coefficient from the other studies. If no change, or SD of change, could be calculated for an outcome, the study was excluded from the meta-analysis for this outcome.
For the primary meta-analysis, R (The R Foundation®) was used with additional libraries. Raw effect size data were imported into R, followed by a random-effects meta-analysis using the Hartung-Knapp-Sidik-Jonkman estimator.29 Hypocaloric diet plus exercise (D + E) was compared with hypocaloric diet only (D). Mean differences in change of outcome during intervention between D + E and D, and 95% confidence intervals were reported and visualized in a forest plot.
Secondary analyses to evaluate the additional effect of exercise to hypocaloric diet within subgroups of exercise type and intensity used a similar random-effects meta-analysis. The exercise type was categorized as endurance or resistance exercise. Exercise intensity was categorized as High intensive or Low intensive, based on study-prescribed weekly metabolic equivalent of task (MET)-minutes. Studies in the highest half of weekly MET-minutes were labelled as High intensive and studies in the lowest half as Low intensive. Cochran's Q-test was performed to test between-subgroup differences.
Heterogeneity across studies was explored by visually examining forest plots and by computing I2, where I2 greater than 75% indicates significant effect heterogeneity.30 In that case, meta-regression analysis was conducted to explore whether participant or intervention characteristics explained the heterogeneity in treatment effects.
For outcomes reported by less than three studies, no meta-analysis was performed. Where applicable, effect size (Hedges' g) was reported to account for differences in reported measurement units between studies.
3 RESULTS
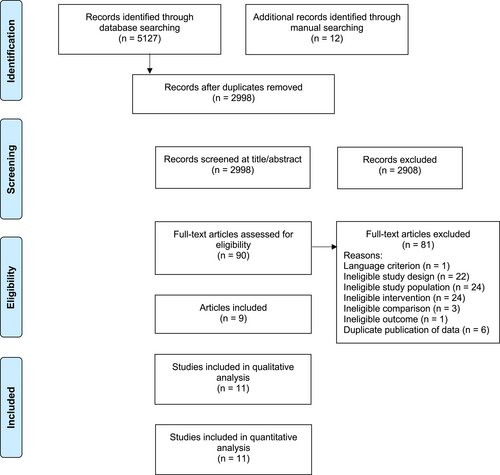
Figure 1 shows the flow diagram of the study. A total of 5139 records were retrieved from the database and manual searches. After duplicates were removed, 2998 articles were screened for eligibility. Of these, nine articles met the inclusion criteria. The article of Wing et al. presented two eligible studies,25 referred to as Wing 1988 A and B in our systematic review and meta-analysis. The article of Wycherley 2010 included four intervention groups, using two different types of energy-restricted diets (standard and high in protein), with or without resistance exercise.31 The standard and high-protein interventions were treated as separate studies (Wycherley 2010 A and B respectively) in our systematic review and meta-analysis. Therefore, a total of 11 studies from nine articles were included in the qualitative and quantitative analysis. Details of the studies are provided in Table 1.
| Study (year) | Design | Study population | Intervention | Outcomes | |||||||
|---|---|---|---|---|---|---|---|---|---|---|---|
| N | Age (y) | BMI (kg/m2) | % men | Diet only | Diet + exercise | Anthropometry, Body composition, Physical performance | Metabolism | ||||
| Andrews et al.24 | 12-month parallel-group RCT with 3 groups: usual care, D, D + E |
D: 248 (246 analysed), D + E: 246 (240 analysed) overweight and obese (BMI ≥ 25 kg/m2) M&W with newly diagnosed (5–8 months previously) T2D |
D: 60.1 ± 10.2 D + E: 60.0 ± 9.7 |
D: 31.5 ± 5.7 D + E: 31.6 ± 5.6 |
D: 64% D + E: 66% |
Intensive diet aimed to lose 5–10% of BW by goal-oriented motivational interviews and individual goals reviewed every 3 months by a dietitian | Equal diet + at least 30 min brisk walking on at least 5 days/week, pedometer based, intensity gradually increased within 5 weeks |
Before: Weight (kg) D: 90.2 ± 16.7 D + E: 91.1 ± 16.9 Waist (cm) D: 106 ± 13 D + E: 107 ± 12 BMI (kg/m 2 ) D: 31.5 ± 5.7 D + E: 31.6 ± 5.6 |
After: Weight (kg) D: 88.7 ± 17.3 D + E: 88.7 ± 16.0 Waist (cm) D: 104 ± 13 D + E: 104 ± 12 BMI (kg/m 2 ) D: 30.9 ± 5.9 D + E: 30.7 ± 5.3 |
Before: HbA1c (mmol/mol) D: 49 ± 10 (6.6 ± 0.9%) D + E: 50 ± 11 (6.7 ± 1.0%) HOMA-IR D: 4.95 ± 2.10 D + E: 5.21 ± 2.48 Fasting glucose (mmol/L) D: 7.32 ± 1.65 D + E: 7.39 ± 1.22 |
After: HbA1c (mmol/mol) D: 48 ± 10 (6.6 ± 1.0%) D + E: 49 ± 10 (6.7 ± 0.9%) HOMA-IR D: 4.22 ± 1.93 D + E: 4.62 ± 1.86 Fasting glucose (mmol/L) D: 7.03 ± 1.22 D + E: 7.32 ± 1.22 |
| De Sousa et al.26 | 12-week parallel-group RCT with 2 groups: D, D + E |
D: 22 (15 analysed), D + E: 22 (19 analysed) M&W with non-insulin-dependent T2D |
Total, range: 48–68 |
D: 33.1 ± 4.6 D + E: 32.7 ± 5.2 |
Total: 44% | Caloric intake reduction of 500–1000 kcal/day with individual counselling every 2 weeks | Equal diet + recreational football training 3x 40 min/week: 10 min of warming-up followed by 2x 12 min game |
Before: Weight (kg) D: 82.9 ± 16.7 D + E: 88.9 ± 16.1 Waist (cm) D: 104.9 ± 10.5 D + E: 106.9 ± 10.5 BMI (kg/m 2 ) D: 33.1 ± 4.6 D + E: 32.7 ± 5.2 FM (kg) D: 31.3 ± 8.9 D + E: 30.7 ± 8.7 FFM (kg) D: 51.6 ± 12.0 D + E: 58.1 ± 11.8 VO2max (ml⋅kg−1⋅min−1) D: 21.8 ± 4.7 D + E: 22.9 ± 4.4 FM (%) D: 37.5 ± 7.0 D + E: 34.6 ± 7.0 |
After: Weight (kg) D: 78.2 ± 13.9 D + E: 85.2 ± 13.5 Waist (cm) D: 98.7 ± 10.1 D + E: 101.5 ± 9.6 BMI (kg/m 2 ) D: 31.3 ± 3.9 D + E: 31.3 ± 3.9 FM (kg) D: 27.6 ± 7.4 D + E: 27.3 ± 7.0 FFM (kg) D: 50.6 ± 10.8 D + E: 57.9 ± 10.5 Change vs. baseline: VO2max (%) D: −3 ± 15 D + E: +10 ± 17 FM (%) D: −2.4 ± 0.4 D + E: −2.4 ± 0.4 |
Before: HbA1c (mmol/mol) D: 55 ± 13 (7.2 ± 1.2%) D + E: 56 ± 14 (7.3 ± 1.3%) HOMA-IR D: 7.1 ± 3.5 D + E: 6.4 ± 3.1 Fasting glucose (mmol/L) D: 8.0 ± 1.9 D + E: 7.7 ± 1.7 |
After: HbA1c (mmol/mol) D: 46 ± 9 (6.4 ± 0.8%) D + E: 45 ± 10 (6.3 ± 0.9%) HOMA-IR D: 5.9 ± 2.3 D + E: 4.7 ± 2.2 Fasting glucose (mmol/L) D: 6.8 ± 1.5 D + E: 6.6 ± 1.3 |
| Hu et al.23 | 6-month parallel-group RCT with 3 groups: usual care, D, D + E |
D: 128 (124 analysed), D + E: 128 (120 analysed) overweight & obese (BMI 24-40 kg/m2) M&W with newly diagnosed (≤8 months) non-insulin-dependent T2D |
D: 53.1 ± 10.8 D + E: 51.4 ± 10.7 |
D: 29.2 D + E: 29.1 |
D: 48% D + E: 51% |
Caloric deficit of 500 kcal/day, aiming for 5–10% weight loss, with 3 motivational interviewing style individual consultations and monthly group sessions discussing diet | Equal diet + at least 30 min brisk walking on at least 5 days/week, pedometer-based, intensity gradually increased within 5 weeks |
Before: Weight (kg) D: 82.4 D + E: 83.0 FM (kg) D: 30.83 D + E: 31.29 LBM (kg) D: 44.43 D + E: 44.54 Waist (cm) D: 99.2 D + E: 99.9 |
After: Weight (kg) D: 78.7 D + E: 79.1 FM (kg) D: 27.67 D + E: 28.10 LBM (kg) D: 43.95 D + E: 43.82 Waist (cm) D: 95.8 D + E: 95.3 |
Before: HbA1c (mmol/mol) D: 62 (7.9%) D + E: 62 (7.9%) HOMA-IR D: 4.27 D + E: 4.50 Fasting glucose (mmol/L) D: 8.01 D + E: 7.95 |
After: HbA1c (mmol/mol) D: 60 (7.6%) D + E: 59 (7.6%) HOMA-IR D: 2.92 D + E: 2.79 Fasting glucose (mmol/L) D: 7.55 D + E: 7.52 |
| Koo et al.33 | 12-week parallel group-RCT with 4 groups: con, E, D, D + E |
Total: 70, D: 19 (analysed), D + E: 14 (analysed) overweight (BMI≥23 kg/m2) W with T2D |
D: 57 ± 8 D + E: 53 ± 8 |
D: 27.1 D + E: 29.4 |
Total: 0% | Energy intake of 1200 kcal/day with individual education sessions based on a 3-day diet diary every 2 weeks | Equal diet + brisk walking for 120 min every day, with feedback from exercise therapist every 2 weeks based on data from an accelerometer |
Before: Weight (kg) D: 67.4 (58.9–76.7) D + E: 69.4 (58.6–89.6) |
After: Weight (kg) D: 62.4 (54.6–70.5) D + E: 64.8 (50.0–86.0) |
Before: HbA1c (mmol/mol) D: 58 ± 12 (7.5 ± 1.1%) D: 64 ± 20 (8.0 ± 1.8%) Fasting glucose (mmol/L) D: 7.0 ± 1.6 D + E: 6.9 ± 2.0 KITT no values reported |
After: HbA1c (mmol/mol) D + E: 53 ± 9 (7.0 ± 0.8%) D + E: 55 ± 13 (7.2 ± 1.2%) Fasting glucose (mmol/L) D: 6.2 ± 0.9 D + E: 6.7 ± 1.3 KITT no values reported |
| Snel et al.27 | 16-week parallel-group RCT with 2 groups: D, D + E |
D: 14, D + E: 13 obese (BMI > 30 kg/m2) M&W with insulin-dependent T2D |
D: 56.1 ± 9.0 D + E: 53.0 ± 9.0 |
D: 37.9 ± 5.2 D + E: 36.4 ± 4.0 |
Total: 52% | VLCD with 450 kcal/day in form of 3 liquid shakes, with weekly outpatient clinic visits to confirm compliance | Equal diet + 30 min of home cycle ergometry at least 4x/week and 1 h supervised in-hospital aerobic exercise 1x/week, at 70% of maximum aerobic capacity |
Before: Weight (kg) D: 112.7 ± 21.0 D + E: 113.5 ± 18.4 BMI (kg/m 2 ) D: 37.9 ± 5.2 D + E: 36.4 ± 4.0 Waist (cm) D: 122 ± 11.2 D + E: 123 ± 10.8 FM (kg) D: 49.9 ± 13.5 D + E: 45.4 ± 11.5 |
After: Weight (kg) D: 89.0 ± 16.1 D + E: 86.3 ± 15.1 BMI (kg/m 2 ) D: 30.0 ± 4.1 D + E: 27.7 ± 3.6 Waist (cm) D: 103 ± 11.2 D + E: 98 ± 10.8 FM (kg) D: 33.2 ± 10.5 D + E: 23.5 ± 10.8 Change vs. baseline: VO 2max (mL⋅kg LBM −1 ⋅min −1 ) D: +0.7 ± 5.6 D + E: +6.6 ± 6.1 |
Before: HbA1c (mmol/mol) D: 62 ± 12 (7.8 ± 1.1%) D + E: 62 ± 15 (7.8 ± 1.4%) Fasting glucose (mmol/L) D: 12.1 ± 1.9 D + E: 10.9 ± 2.5 GIR (μmol⋅kg LBM−1⋅min−1) D: 10.2 ± 6.7 D + E: 13.0 ± 6.5 |
After: HbA1c (mmol/mol) D: 50 ± 12 (6.7 ± 1.1%) D + E: 45 ± 15 (6.3 ± 1.4%) Fasting glucose (mmol/L) D: 7.7 ± 2.2 D + E: 6.6 ± 2.9 GIR (μmol⋅kg LBM−1⋅min−1) D: 37.5 ± 19.1 D + E: 40.3 ± 13.0 |
| Tamura et al.28 | 2-week parallel in-hospital RCT with 2 groups: D, D + E |
D: 7, D + E: 7 M&W with T2D |
D: 55.0 ± 12.7 D + E: 46.3 ± 7.4 |
D: 27.4 ± 8.5 D + E: 27.1 ± 7.7 | Total: 57% | Controlled diet of 27.9 kcal/kg ideal bodyweight/day | Equal diet + 2–3 sessions of 30 min walking on 5–6 days/week at 50%–60% of maximum aerobic capacity |
Before: BMI (kg/m 2 ) D: 27.4 ± 8.5 D + E: 27.1 ± 7.7 FM (%) D: 30.7 ± 13.0 D + E: 30.8 ± 9.8 |
After: BMI (kg/m 2 ) D: 27.0 ± 8.5 D + E: 26.4 ± 7.4 FM (%) D: 28.3 ± 12.4 D + E: 28.0 ± 9.8 |
Before: Fasting glucose (mmol/L) D: 11.0 ± 3.4 D + E: 9.9 ± 2.9 GIR (mg⋅kg−1⋅min−1) D: 6.1 ± 2.5 D + E: 5.3 ± 0.9 |
After: Fasting glucose (mmol/L) D: 7.5 ± 1.1 D + E: 7.4 ± 2.1 GIR (mg⋅kg−1⋅min−1) D: 6.5 ± 0.9D + E: 8.2 ± 1.2 |
| Wing et al.25 A | 10-week parallel-group RCT + 1-year follow-up with 2 groups: D, D + E |
D: 13 (12 analysed), D + E: 12 (10 analysed) obese (>20% above ideal weight) M&W with non-insulin-dependent T2D |
D: 52.5 ± 8.9 D + E: 56.2 ± 7.5 |
D: 37.5 ± 6.2 D + E: 38.1 ± 6.4 |
Total: 16% | Calorie-counting diet with calorie goal calculated as (pre-treatment weight * 26) – 1000 kcal, using calorie books and diaries, with behavioural weight control group sessions 2x/week for 10 weeks and monthly for 6 months after, including placebo exercise (stretching + light callisthenics) |
Equal diet + progressive walking for 1 h 2x/week in groups and 1x/week individually, with speed gradually increasing until 3 miles were reached within 1 h |
Before: Weight (kg) D: 97.4 ± 13.7 D + E: 106.9 ± 18.4 BMI (kg/m 2 ) D: 37.2 ± 6.5 D + E: 39.5 ± 6.5 |
After: Weight(kg) D: 90.1 ± 14.1 D + E: 98.4 ± 18.4 BMI (kg/m 2 ) D: 34.4 ± 6.5 D + E: 36.3 ± 6.6 |
Before: HbA1c (mmol/mol) D: 79 ± 20 (9.4 ± 1.8%) D + E: 83 ± 19 (9.7 ± 1.7%) Fasting glucose (mmol/L) D: 9.9 ± 2.9 D + E: 10.2 ± 2.8 |
After: HbA1c (mmol/mol) D: 63 ± 20 (7.9 ± 1.8%) D + E: 64 ± 15 (8.0 ± 1.4%) Fasting glucose (mmol/L) D: 7.8 ± 3.2 D + E: 7.6 ± 2.8 |
| Wing et al.25 B | 10-week parallel-group RCT + 1-year follow-up with 2 groups: D, D + E |
D: 15 (all analysed), D + E: 15 (13 analysed) obese (>20% above ideal weight) M&W with T2D |
D: 55.1 ± 7.2 D + E: 56.1 ± 6.4 | D: 37.9 ± 6.5 D + E: 38.2 ± 6.6 | Total: 30% |
Calorie-counting diet with calorie goal calculated as (pre-treatment weight * 26) – 1000 kcal, using calorie books and diaries, with behavioural weight control group sessions 3x/week for 10 weeks, weekly the next 10 weeks and monthly for 1 year after |
Equal diet + walking 3 miles 3x/week in groups and 1x/week individually |
Before: Weight (kg) D: 102.0 ± 19.4 D + E: 104.1 ± 23.2 BMI (kg/m 2 ) D: 37.9 ± 6.5 D + E: 37.5 ± 7.3 |
After: Weight (kg) D: 96.4 ± 19.8 D + E: 94.8 ± 22.9 BMI (kg/m 2 ) D: 35.8 ± 6.9 D + E: 34.1 ± 6.9 |
Before: HbA1c (mmol/mol) D: 96 ± 21 (10.9 ± 1.9%) D + E: 92 ± 21 (10.6 ± 1.9%) Fasting glucose (mmol/L) D: 12.6 ± 2.7 D + E: 11.6 ± 2.3 |
After: HbA1c (mmol/mol) D: 75 ± 13 (9.0 ± 1.2%) D + E: 66 ± 13 (8.2 ± 1.2%) Fasting glucose (mmol/L) D: 9.2 ± 2.7 D + E: 8.4 ± 1.9 |
| Wycherley et al.32 | 12-week parallel-group RCT with 2 groups: D, D + E |
D: 18 (16 analysed), D + E: 16 (13 analysed) overweight & obese (BMI range 27-44 kg/m2) sedentary M&W with T2D |
D: 53.0 ± 7.2 D + E: 51.7 ± 8.7 |
D: 34.6 ± 4.8 D + E: 33.6 ± 4.7 | Total: 55% | High-protein diet with ~5500 kJ/day using 1 homemade meal and 2 meal replacements per day, with dietary assistance from a dietician every 2 weeks | Equal diet + walking or jogging 4-5x /week including at least 1 group session, progressing from 25–30 min at 60–65% HRmax to 55–60 min at 75%–80% HRmax |
Baseline: Weight (kg) D: 105.5 ± 20.8 D + E: 96.3 ± 11.5 BMI (kg/m 2 ) D: 34.6 ± 4.8 D + E: 33.6 ± 4.7 Waist (cm) D: 116.3 ± 15.6 D + E: 108.0 ± 9.0 FM (%) D: 35.8 ± 2.8 D + E: 34.5 ± 3.6 |
Change vs. baseline: Weight (kg) D: −9.4 ± 3.2 D + E: −8.2 ± 2.9 BMI (kg/m 2 ) D: −3.1 ± 1.2 D + E: −2.9 ± 1.1 Waist (cm) D: −9.9 ± 3.6 D + E: −10.7 ± 3.6 FM (%) D: −2.0 ± 2.1 D + E: −2.1 ± 1.0 |
Baseline: HbA1c (mmol/mol) D: 66 ± 20 (8.2 ± 1.8%) D + E: 60 ± 17 (7.6 ± 1.6%) Fasting glucose (mmol/L) D: 10.5 ± 2.5 D + E: 10.5 ± 4.5 HOMA2-IR D: 2.4 ± 1.7 D + E: 1.8 ± 1.0 |
Change vs. baseline: HbA1c (mmol/mol) D: −19 ± 20 (−1.7 ± 1.8%) D + E: −13 ± 9 (−1.2 ± 0.8%) Fasting glucose (mmol/L) D: −2.7 ± 2.8 D + E: −2.5 ± 2.5 HOMA2-IR D: −0.9 ± 0.8 D + E: −1.1 ± 1.1 |
| Wycherley et al.31 A | 16-week parallel-group RCT with 2 groups: D, D + E |
D: 19 (16 analysed), D + E: 22 (17 analysed) overweight & obese sedentary M&W with non-insulin-dependent T2D |
Total: 50.8 ± 10.4 |
D: 34.8 ± 4.9 D + E: 34.9 ± 4.9 |
Not specified | Moderate energy restriction (M: ~7000 kJ/day, F: ~6000 kJ/day) with a standard diet (19% protein), assessed every 2 weeks by a dietician | Equal diet + progressive RT with 8 exercises on weight-stacked machines on 3 non-consecutive days/week at 70%–85% 1RM, 2 sets per exercise |
Before: Weight (kg) D: 97.0 ± 10.6 D + E: 105.0 ± 15.3 BMI (kg/m 2 ) D: 34.8 ± 4.9 D + E: 34.9 ± 4.9 FM (kg) D: 38.5 ± 8.0 D + E: 40.4 ± 10.0 Waist (cm) D: 111.3 ± 10.7 D + E: 113.7 ± 8.5 FFM (kg) D: 58.5 ± 10.7 D + E: 64.6 ± 12.4 |
After: Weight (kg) D: 88.4 ± 11.2 D + E: 94.5 ± 15.4 BMI (kg/m 2 ) D: 31.7 ± 5.1 D + E: 31.4 ± 4.3 FM (kg) D: 32.1 ± 9.5 D + E: 32.3 ± 10.7 Waist (cm) D: 103.2 ± 12.8 D + E: 102.4 ± 9.6 FFM (kg) D: 56.3 ± 10.6 D + E: 62.2 ± 12.0 |
Before: HbA1c (mmol/mol) D: 60 ± 11 (7.6 ± 1.0%) D + E: 56 ± 15 (7.3 ± 1.4%) Fasting glucose (mmol/L) D: 9.2 ± 2.7 D + E: 8.7 ± 3.2 |
After: HbA1c (mmol/mol) D: 46 ± 8 (6.4 ± 0.7%) D + E: 44 ± 11 (6.2 ± 1.0%) Fasting glucose (mmol/L) D: 7.1 ± 1.0 D + E: 6.8 ± 1.5 |
| Wycherley et al.31 B | 16-week parallel-group RCT with 2 groups; D, D + E |
D: 21 (12 analysed), D + E: 20 (14 analysed) overweight & obese sedentary M&W with non-insulin-dependent T2D |
Total: 50.8 ± 10.4 |
D: 35.6 ± 3.8 D + E: 36.6 ± 5.0 |
Not specified | Moderate energy restriction (M: ~7000 kJ/day, F: ~6000 kJ/day) with high-protein diet (33% protein), assessed every 2 weeks by a dietician | Equal diet + progressive RT with 8 exercises on weight-stacked machines on 3 non-consecutive days/week at 70%–85% 1RM, 2 sets per exercise |
Before: Weight (kg) D: 102.7 ± 15.4 D + E: 107.6 ± 15.5 BMI (kg/m 2 ) D: 35.6 ± 3.8 D + E: 36.6 ± 5.0 FM (kg) D: 40.4 ± 8.4 D + E: 42.9 ± 11.6 Waist (cm) D: 114.3 ± 6.8 D + E: 116.2 ± 12.7 FFM (kg) D: 62.3 ± 13.0 D + E: 64.7 ± 11.5 |
After: Weight (kg) D: 93.7 ± 13.8 D + E: 93.8 ± 13.5 BMI (kg/m 2 ) D: 32.5 ± 3.1 D + E: 31.9 ± 4.3 FM (kg) D: 33.2 ± 6.9 D + E: 31.5 ± 11.6 Waist (cm) D: 105.4 ± 6.7 D + E: 102.5 ± 11.8 FFM (kg) D: 60.4 ± 13.2 D + E: 62.3 ± 10.7 |
Before: HbA1c (mmol/mol) D: 64 ± 20 (8.0 ± 1.8%) D + E: 51 ± 11 (6.8 ± 1.0%) Fasting glucose (mmol/L) D: 9.5 ± 2.9 D + E: 8.2 ± 2.1 |
After: HbA1c (mmol/mol) D: 45 ± 10 (6.3 ± 0.9%) D + E: 38 ± 7 (5.6 ± 0.6%) Fasting glucose (mmol/L) D: 7.0 ± 1.0 D + E: 6.3 ± 1.0 |
- Note: Data reported as mean ± SD for normally distributed data, median (range) for non-normally distributed data and mean when no SD is available.
- Abbreviations: 1RM, 1-repetition maximum; con, control; D, diet-only group; D + E, diet plus exercise group; FM, fat mass; FFM, fat-free mass; GIR, steady-state glucose infusion rate; HOMA2-IR, the updated version of HOMA-IR; HRmax, maximum heart rate; KITT, glucose disappearance rate during insulin tolerance test; LBM, lean body mass; M, men; N, sample size, expressed as the number of participants included in study arms and the number of participants analysed (if reported); RT, resistance exercise training; T2D, type 2 diabetes; VLCD, very low-calorie diet; W, women; Waist, waist circumference.
3.1 Study populations
A total of 1041 adults with overweight or obesity and type 2 diabetes were included in the 11 studies. The sample size ranged from 14 to 494. Ten out of 11 studies included both men and women, and one study included women only. Mean participant age across studies ranged from 50.8 to 60.0 years. Two studies included people with newly diagnosed (≤8 months) type 2 diabetes,23, 24 five studies did not report the duration of diabetes, and the other four studies had a mean duration between 4 and 10 years. One study included participants on insulin treatment only,27 whereas seven studies excluded people on insulin and three studies did not specify diabetes medication use (see Table 1).
3.2 Intervention characteristics
The studies included had a median intervention duration of 12 weeks (range: 2–52 weeks). The hypocaloric diet interventions ranged from a very low-calorie diet (VLCD; 450 kcal/day) to a moderate caloric restriction of 500 kcal energy deficit (see Table 1). The exercise interventions consisted of (brisk) walking or jogging,23-25, 28, 32, 33 training on a cycle ergometer,27 football training26 or resistance exercise.31 Training frequency was three to seven times per week. Control groups received instructions to maintain their baseline level of physical activity or received placebo exercise (‘very low intensity exercises such as stretching and light calisthenics’25).
3.3 Qualitative synthesis
All studies reported both anthropometry and body composition measures and metabolic measures (Table 1). Body weight and BMI were reported in 10 studies. Waist circumference was reported in seven studies. Lean body mass and fat-free mass were reported by one and three studies, respectively, and were all assessed with DXA. Muscle mass was not reported. Fat mass was reported by seven studies. Of these, five studies reported fat mass in kilograms (of which four were assessed with DXA and one with BIA27), and three reported fat mass in percentage (all using different methods: DXA, Bodpod and BIA). Fasting glucose was reported in all 11 studies and HbA1c in 10 studies, and 2 h glucose was not reported. Insulin resistance was reported in four studies; three studies reported HOMA-IR and one reported HOMA2-IR, the updated HOMA-IR.34 Insulin sensitivity was reported in three studies; two studies reported steady-state glucose infusion rate during hyperinsulinemic-euglycaemic clamp (GIR) and one study reported glucose disappearance rate during insulin tolerance test (KITT). Only two studies reported VO2max, whereas no other studies reported measures of physical performance.
For the outcomes of body weight, BMI, waist circumference, fat mass, fat-free mass, fasting glucose, HbA1c and HOMA-IR at least three studies were available and meta-analyses were performed. Results for HOMA2-IR were not included in the meta-analysis for HOMA-IR because of methodological differences between the outcomes. These results are described below, together with the results for insulin sensitivity and VO2max.
3.3.1 VO2max
Both studies that reported VO2max observed a significant between-group difference (p < 0.05), with significant increases in D + E (+10 ± 17%26; +6.6 ± 6.1 mL⋅kg LBM−1⋅min−1)27 and no significant changes in D (see Table 1). Effect sizes were 0.80 (95% CI: 0.21; 1.81) and 1.01 (95% CI: 0.10; 1.51) respectively.
3.3.2 Insulin sensitivity
One study reported a significant increase of GIR in D+E (+57%, p < 0.001), whereas no significant change was observed in D. Unfortunately, between-group significance was not reported. Change in GIR was significantly associated with change in physical activity (r = 0.563; p = 0.035).28 The two other studies reported significant increases in GIR27 and KITT33 in both intervention groups (p < 0.05) without significant between-group differences. Change in KITT was significantly associated with physical activity energy expenditure.
3.3.3 HOMA2-IR
One study reported HOMA2-IR,32 which was significantly decreased (p < 0.001) in both intervention groups without between-group difference (p = 0.69) (see Table 1).
3.4 Quantitative synthesis
3.4.1 Body weight
Body weight decreased in both groups. Change in body weight was not statistically different between D + E and D (p = 0.204) (Figure 2).
3.4.2 BMI
BMI decreased in both groups. Change in BMI was not statistically different between D + E and D (MD: −0.34 kg/m2 [95% CI: −0.73; 0.05], p = 0.077) (Figure S1).
3.4.3 Waist circumference
Waist circumference decreased in both groups. Change in waist circumference was not statistically different between D + E and D (MD: −1.42 cm [95% CI: −3.84; 1.00], p = 0.201) (Figure S2).
3.4.4 Fat-free mass
Fat-free mass decreased in both groups. Change in fat-free mass was not statistically different between D + E and D (p = 0.200) (Figure 3).
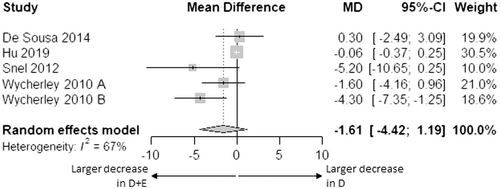
3.4.5 Fat mass
Fat mass decreased in both groups. Change in fat mass was not statistically different between D + E and D (p = 0.186) (Figure 4).
3.4.6 Fat mass percentage
Fat mass percentage decreased in both groups. Change in fat mass percentage was not statistically different between D + E and D (MD: −0.01% [95% CI: −0.18; 0.15], p = 0.797) (Figure S3).
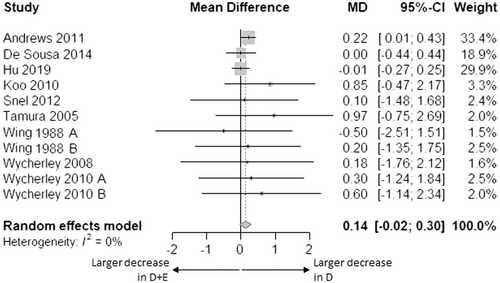
3.4.7 Fasting glucose
Fasting glucose decreased in both groups. Change in fasting glucose was not statistically different between D + E and D (p = 0.086) (Figure 5).
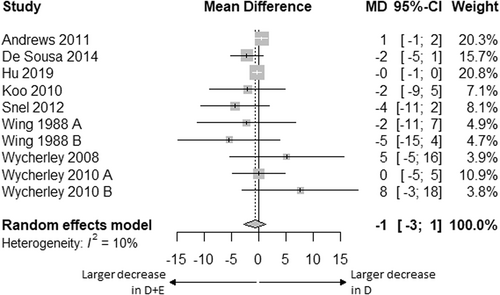
3.4.8 HbA1c
HbA1c decreased in both groups. Change in HbA1c was not statistically different between D + E and D (MD: −1 mmol/mol [95% CI: −3; 1], p = 0.463; −0.1% [95% CI: −0.2; 0.1], p = 0.497) (Figure 6; Figure S4).
3.4.9 HOMA-IR
HOMA-IR decreased in both groups. Change in HOMA-IR was not statistically different between D + E and D (MD: +0.01 [95% CI: −0.40; 0.42], p = 0.915) (Figure S5).
3.4.10 Impact of exercise type and intensity
Subgroup analysis for the impact of endurance versus resistance exercise was not performed because only two studies involved resistance exercise.
Subgroup analysis for intensity of exercise showed no statistical differences (body weight, Q = 0.65, p = 0.422; BMI, Q = 0.06, p = 0.813; waist circumference, Q = 0.12, p = 0.731; fasting glucose, Q = 0.03, p = 0.863; HbA1c, Q = 2.52, p = 0.112) between the lowest (263–645 MET-minutes) and highest (840–3612 MET-minutes) exercise intensities on the additional effect of exercise to hypocaloric diet (Figures S6–S10).
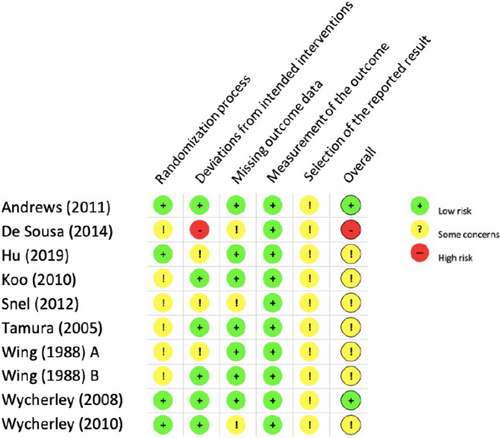
3.5 Risk of bias
Figure 7 presents the risk of bias assessment. The majority of studies had some concerns about the risk of bias, and one study had a high risk of bias due to a high risk of deviations from the intended interventions. The predominant source of information for the assessment was the journal article. None of the selected studies had a study protocol or statistical analysis plan available. Therefore, the domain ‘Selection of the reported result’ was judged as ‘some concerns’ for all studies.
No risk of non-reporting bias was found using the Egger's test. Outliers were found in funnel plots of waist circumference23, 26 and fat mass in kg,23 which could indicate the possibility of a systematic difference between studies of higher and lower precision.
3.6 Study heterogeneity
No significant effect heterogeneity was observed, except for the outcome of waist circumference. The relatively low number of studies included (n = 7) may have caused the high heterogeneity (83%) for waist circumference.20 Explanatory factors were sought in the method of measurement of waist circumference and in participant characteristics. Methods of measurement were not reported, and potential confounders sex, age, and duration of diabetes were often missing at study population levels. Sensitivity analyses by leaving studies out did not give indications for other potential confounders for waist circumference. Therefore, no meta-regression was performed.
4 DISCUSSION
We evaluated the additional effects of exercise to hypocaloric diet on body weight, body composition, glycaemic control and cardio-respiratory fitness in adults with overweight or obesity and type 2 diabetes. Except for cardio-respiratory fitness, we found no benefits of exercise in addition to hypocaloric diet in this population. Body weight, body composition and glycaemic parameters improved independent of the addition of exercise in all selected studies. However, the number of included studies was limited and most effect sizes indicated towards a favourable direction for the intervention including exercise. In our meta-analysis, improvement in outcomes was evident in all studies independent of the addition of exercise, and without significant differences between the diet and diet plus exercise interventions. Possible explanations for the absence of significant differences may be the limited number of studies included in the meta-analysis and the relatively high proportion of small-scale studies, leading to a lack of precision35 and power.36 Another explanation for the limited additional benefits of exercise to hypocaloric diet may be compensation for exercise activity with a reduction in non-exercise physical activity, compromising an additional decrease in fat mass and body weight.37 Flack et al. showed that exercise energy expenditure of 3000 kcal/week is sufficient to exceed compensatory responses and reduce fat mass in overweight adults.38 However, only one study in our meta-analysis exceeded this value (approximately 6000 kcal/week in the study of Koo et al.), while exercise energy expenditure was much lower in the other studies (ranging from 440 to 2200 kcal/week, approximately). Data on realized negative energy balance were not available. The relatively short intervention duration of most studies in our meta-analysis could also be seen as a possible explanation for the absence of additional effects of exercise. Nine out of 11 studies had intervention durations of up to 16 weeks, which may have been too short to find between-group differences in our outcome parameters. However, a categorization of studies according to study duration does not clearly indicate such impact (Figures S11–S14). Variety in caloric intake may also have confounded our results, as it is known that very low-calorie diets (VLCD) yield higher weight loss than, for example, low-calorie diets.39 The study of Snel et al. was the only study that used VLCD and seemed to have a more pronounced decrease in waist circumference (Figure S2) and fat mass (Figure 4) upon the addition of exercise.
Our results are partially in line with the meta-analysis of Sardeli et al., who did not find significant differences in the reduction of body weight and fat mass between caloric restriction plus resistance exercise and caloric restriction only in older adults with obesity. However, they showed that resistance exercise can prevent the loss of lean body mass induced by caloric restriction.13 Our meta-analysis included only two studies involving resistance exercise and could not confirm this finding of Sardeli et al. for individuals with type 2 diabetes. This result seems in line with the meta-analysis of Lee et al., which did not show increased lean body mass upon resistance training in older adults with type 2 diabetes.40 However, protein intake41 and exercise program was not optimized for the preservation of fat-free mass during weight loss in the studies included in our meta-analysis, except for the high-protein study of Wycherley et al. combining a high-protein diet with resistance exercise.31 In their study, body composition was relatively improved in the diet plus (resistance) exercise group, with higher weight loss (predominantly as fat mass) compared to the diet-only group, and a similar loss of fat-free mass.
Our meta-analysis on fat mass suggests that the addition of exercise to hypocaloric diet could lead to improved body composition by additional reduction of fat mass. However, the confidence interval was wide and statistical significance was absent, for the reasons discussed above. Similarly, the addition of exercise could lead to an additional reduction of waist circumference, but high heterogeneity between studies may have added to the absence of statistical significance.
In adults with type 2 diabetes, there is substantial evidence that exercise improves glycaemic control.14, 15 Exact working mechanisms are unknown, but exercise induces beneficial adaptations in many tissues, like muscle, liver, pancreas, fat cells and vascular tissue, leading to improvements in glycaemic control.42 Remarkably, the reduction in fasting glucose tended to be lower when exercise was added to hypocaloric diet compared to hypocaloric diet alone. However, the difference between interventions is of limited magnitude. Because reductions in diabetes medication can be expected in the exercise groups to prevent hypoglycaemia, such changes may have influenced the meta-analysis of fasting glucose and HbA1c. Nine out of 11 studies reported changes in the number or percentage of participants taking diabetes medication. Seven studies reported a reduction in diabetes medication use, which occurred in both groups. In four of these studies, the reduction in diabetes medication was higher in the diet plus exercise group, though not statistically different or not statistically evaluated. In one study, diabetes medication was stopped in both groups as part of the study protocol.27 Overall, a hypothetically greater reduction in diabetes medication in the diet plus exercise group could explain the lack of additional effect of exercise on the reduction in fasting glucose, while being beneficial.
We did not find a beneficial effect of exercise in addition to hypocaloric diet on HbA1c. This was unexpected, considering the effects of exercise itself in type 2 diabetes as reported in previous meta-analyses.14, 15, 43 Limited duration of interventions does not seem to explain the absence of effect on HbA1c (Figure S14), but heterogeneity in the study populations may have added to our finding. The study populations in Andrews et al.24 and Hu et al.23 consisted of adults with newly diagnosed type 2 diabetes only. Disease progression may be of influence on the outcomes studied, with larger reductions in HbA1c observed in studies with participants with diabetes of relatively short duration (<6 years).44 A recent paper on exercise for the management of type 2 diabetes stated that improvements depend on exercise type and intensity. Combined resistance and endurance exercise, higher intensity of endurance exercise, and high-intensity interval training may lead to larger reductions in HbA1c.19 Our subgroup analysis for intensity of exercise could not confirm a statistical difference in HbA1c between lower and higher exercise intensity. However, exercise may not have been intense enough. Indication for the effectiveness of higher exercise intensity is also suggested by the significant associations between change in insulin sensitivity and change in physical activity in the studies of Koo et al.33 and Tamura et al.28
The impact of the type of exercise could not be evaluated in a subgroup analysis because of the limited number of available studies including resistance exercise. Moreover, these studies were from the same authors and shared the same methodology, making them dependent to some extent. A qualitative evaluation of categorized forest plots according to exercise type suggests differential effects of type of exercise are absent (Figures S15–S18). However, there was a slight tendency for the additional effect of resistance exercise on body weight loss.
Our qualitative synthesis indicated that the addition of exercise to hypocaloric diet increased VO2max. The benefit of exercise for cardio-respiratory fitness in obesity and in type 2 diabetes has previously been shown,45 with higher exercise intensity leading to a higher increase in VO2max in adults with type 2 diabetes. This effect is caused by improved oxygen delivery due to increased cardiac output and capillary density.46
The main strength of our systematic review and meta-analysis is the application of the Cochrane method, warranting reproducibility and reliability.
Based on a limited number of studies, our work indicates that the addition of exercise to hypocaloric diet in adults with overweight or obesity and type 2 diabetes leads to improvement of cardio-respiratory fitness, but we found no evidence for benefits in other outcomes. However, negative effects of exercise seem absent and effect sizes almost exclusively indicate towards a favourable direction for the combined intervention. Besides, it is known that exercise is important for weight loss maintenance in the longer term.47, 48
The potential beneficial effect of exercise in addition to hypocaloric diet on body composition and glycaemic control remains to be confirmed in larger-scale long-term randomised controlled trials. Future research could focus on the impact of exercise type and intensity on body composition and glycaemic control, to be able to optimize the exercise component in the treatment of type 2 diabetes.
In conclusion, we did not find evidence for additional effects of exercise to hypocaloric diet in adults with overweight or obesity and type 2 diabetes on body weight, body composition or glycaemic control while cardio-respiratory fitness improved. The limited number of studies, reduction in anti-diabetes medication, and potential compensatory behaviour for exercise energy expenditure may explain the absence of additional effects of exercise to hypocaloric diet in this meta-analysis.
AUTHOR CONTRIBUTIONS
RGM: study design, article selection and data extraction, analysis and interpretation of the data, drafting the manuscript; MH: article selection and data extraction, analysis and interpretation of the data, drafting the manuscript; AH: study design, article selection and data extraction, interpretation of the data, drafting the manuscript; MTS: study design, analysis and interpretation of the data, critical review of the manuscript; IB: interpretation of the data, critical review of the manuscript; PJMW: study design, interpretation of the data, critical review of the manuscript; KAB: conception and study design, interpretation of the data, critical review of the manuscript, supervision; MT: conception and study design, interpretation of the data, critical review of the manuscript, supervision; All authors provided final approval of the version to be published and agreed to be accountable for all aspects of the work.
ACKNOWLEDGEMENTS
We gratefully acknowledge the expert assistance of Wichor M. Bramer, biomedical information specialist at Erasmus Medical Centre, Rotterdam, The Netherlands, in supervising the search strategy and executing the search. This research was supported by the Dutch Research Council (NWO) (grant number 023.009.065).
CONFLICT OF INTEREST STATEMENT
The authors declare no conflict of interest related to this research.
Open Research
DATA AVAILABILITY STATEMENT
The data set generated for the meta-analysis is available from the corresponding author upon reasonable request.


