Metabolic profiles of fish nodavirus infection in vitro: RGNNV induced and exploited cellular fatty acid synthesis for virus infection
Youhua Huang and Ya Zhang contributed equally to this study.
Funding information: China Agriculture Research System, Grant/Award Number: CARS-47-G16; National Key R&D Program of China, Grant/Award Number: 2018YFD0900504; National Natural Science Foundation of China, Grant/Award Numbers: 31930115, 31772877
Abstract
Red-spotted grouper nervous necrosis virus (RGNNV), the causative agent of viral nervous necrosis disease, has caused high mortality and heavy economic losses in marine aquaculture worldwide. However, changes in host cell metabolism during RGNNV infection remain largely unknown. Here, the global metabolic profiling during RGNNV infection and the roles of cellular fatty acid synthesis in RGNNV infection were investigated. As the infection progressed, 71 intracellular metabolites were significantly altered in RGNNV-infected cells compared with mock-infected cells. The levels of metabolites involved in amino acid biosynthesis and metabolism were significantly decreased, whereas those that correlated with fatty acid synthesis were significantly up-regulated during RGNNV infection. Among them, tryptophan and oleic acid were assessed as the most crucial biomarkers for RGNNV infection. In addition, RGNNV infection induced the formation of lipid droplets and re-localization of fatty acid synthase (FASN), indicating that RGNNV induced and required lipogenesis for viral infection. The exogenous addition of palmitic acid (PA) enhanced RGNNV infection, and the inhibition of FASN and acetyl-CoA carboxylase (ACC) significantly decreased RGNNV replication. Additionally, not only inhibition of palmitoylation and phospholipid synthesis, but also destruction of fatty acid β-oxidation significantly decreased viral replication. These data suggest that cellular fatty acid synthesis and mitochondrial β-oxidation are essential for RGNNV to complete the viral life cycle. Thus, it has been demonstrated for the first time that RGNNV infection in vitro overtook host cell metabolism and, in that process, cellular fatty acid synthesis was an essential component for RGNNV replication.
1 INTRODUCTION
Cellular metabolism maintains normal cell growth and reproduction, as well as ongoing homeostasis. Viruses, as obligate intracellular parasites, are incapable of metabolising on their own and are completely dependent upon host metabolism to provide energy and macromolecule biosynthesis for successful viral replication (Fritsch & Weichhart, 2016). Therefore, viruses have evolved to alter and utilise host cell metabolic changes for virus progeny generation (Goodwin, Xu, & Munger, 2015; Sanchez & Lagunoff, 2015). In response, the host has developed diverse countermeasures to trigger effective defensive antiviral responses in order to combat viral infection (Fritsch & Weichhart, 2016; Miyake-Stoner & O'Shea, 2014). Thus, studies on the interaction between viruses and cell metabolism not only provide theoretical information on the mechanism of viral infection, but also provide a new target for clinical treatment of viral infection.
Metabolomics is an approach that has been developed and applied to measure the abundance of all metabolites in cells and organisms. Human cytomegalovirus (HCMV) was the first eukaryotic virus chosen to investigate metabolic changes in infected cells (Munger, Bajad, Coller, Shenk, & Rabinowitz, 2006). Subsequently, global changes in cellular metabolic profiles were investigated in cells infected by different viruses, including human immunodeficiency virus (HIV) (Hollenbaugh, Munger, & Kim, 2011), herpes simplex virus (HSV) (Vastag, Koyuncu, Grady, Shenk, & Rabinowitz, 2011), Kaposi's Sarcoma-associated herpesvirus (KSHV) (Delgado, Sanchez, Camarda, & Lagunoff, 2012), hepatitis C virus (HCV) (Sun et al., 2013) and hepatitis B virus (HBV) (Li et al., 2015). Various cell metabolic pathways, such as glycolysis, fatty acid synthesis and glutamine synthesis are disrupted or rearranged by these viruses (Chen et al., 2011; Chi et al., 2018; Fu et al., 2017; Su et al., 2014; Sun et al., 2013; Vastag et al., 2011). For example, HCMV not only induced glycolysis, but also profoundly increase the delivery of carbon from glucose to the tricarboxylic acid cycle (TCA) cycle to fuel fatty acid biosynthesis. In contrast, HSV-1 geared carbon metabolism toward pyrimidine biosynthesis. This suggested that different viruses might drive diverse host cells to execute distinct, virus-specific metabolic programs (Vastag et al., 2011).
Among multiple core cellular metabolic pathways, lipid metabolism has received particular attention in recent years due to its crucial role in virus and bacterial infection (Fernández-Oliva, Ortega-González, & Risco, 2019; Pombo & Sanyal, 2018; Sharma, Recuero-Checa, Fan, & Dean, 2018). To date, a number of viruses such as HSV, HBV, Epstein Barr virus (EBV), Japanese encephalitis virus (JEV), HCMV and West Nile virus (WNV) were shown to disrupt or induce fatty acid synthesis for effective replication (Heaton & Randall, 2010; Kao et al., 2015; Martín-Acebes et al., 2014). For example, HCV infection destroyed multiple cell lipid metabolic pathways, leading to increased cholesterol and sphingolipid content, changes in phospholipid metabolism, and disruption of fatty acid transport in mitochondria (Roe, Kensicki, Mohney, & Hall, 2011). DENV and WNV infection were shown to increase de novo synthesis of free fatty acids by redistributing fatty acid synthase (FASN) to replication sites and up-regulating activity (Leier, Messer, & Tafesse, 2018). For DNA viruses, vaccinia infection, and in particular virion assembly, relied on the synthesis and mitochondrial import of fatty acids (Greseth & Traktman, 2014). Together, fatty acid synthesis has been demonstrated to be essential and crucial for the replication of multiple mammalian viruses, with few reports on fish virus propagation.
Nervous necrosis virus (NNV) is a non-enveloped positive-strand RNA virus classified in the family Nodaviridae (Bandín & Souto, 2020; Nishizawa, Furuhashi, Nagai, Nakai, & Muroga, 1997). According to International Committee on Taxonomy of Viruses, NNV has been classified into four genotypes: striped jack NNV (SJNNV), tiger puffer NNV (TPNNV), barfin flounder NNV (BFNNV) and red-spotted grouper NNV (RGNNV) (Shetty, Maiti, Shivakumar Santhosh, Venugopal, & Karunasagar, 2012). To date, NNV as a causative agent of viral nervous necrosis disease has become one of the most important threats to cultured marine and freshwater fish worldwide (Bandín & Souto, 2020). Recently, a number of NNV isolates have been identified from different species of fishes, including groupers, gilthead sea bream, Asian sea bass and tilapia (Crane & Hyatt, 2011). Although the evidence has shown that glutamine was required for RGNNV replication via replenishing the TCA cycle (Asim et al., 2017), the detailed mechanisms underlying which RGNNV manipulated the metabolic network of host cells remain largely uncertain.
In this study, in order to gain deep insight into metabolic profiles during RGNNV infection and to identify biomarkers for the diagnosis of virus infection, a metabolomic approach was introduced to illustrate how RGNNV infection can manipute host metabolism during the viral life cycle. Combined with orthogonal partial least-squares to latent structures discriminant analysis (OPLS-DA) and significance analysis for microarrays (SAM) analyses, key metabolites were screened in RGNNV-infected cells. Furthermore, the roles of crucial molecules or events related to fatty acid synthesis during RGNNV infection were investigated, including FASN, acetyl-CoA carboxylase (ACC), protein palmitoylation as well as fatty acid β-oxidation.
2 RESULTS
2.1 Metabolomic profiling of grouper cells in response to RGNNV infection
The global metabolic profiles of RGNNV infection in vitro were analysed by a LC–MS-based metabolomic approach. First, RGNNV infection was clarified by the observed cytopathic effect with numerous vacuoles occurring in the cytoplasm of virus-infected cells at 48 hr p.i. (Figure S1A). As the infection proceeded, the synthesis of RGNNV capsid protein was significantly increased as well as the percentage of dead cells (Image-It Dead Green Viability Stain) (Figure S1B,C). To explore the metabolic pathways affected by RGNNV infection, the metabolite levels were analysed between mock-infected and RGNNV-infected GS cells at different time points (12, 24 and 48 hr p.i.). Using the optimised LC–MS analysis protocol and subsequent processes (i.e. raw data conversion and normalisation, extraction of the peak m/z value and retention time), 1005 features at (ESI+) ion mode and 1061 features at (ESI-) ion mode were obtained in this experiment. The representative total ion current (TIC) chromatograms of mock- or RGNNV-infected cells (24 hr p.i.) indicated that the metabolic profiles in RGNNV-infected cells at 24 p.i. were significantly changed compared with mock-infected cells (Figure S1D). A total of 239 metabolites were detected and quantified, of which 48, 15, 10, 5, 3 and 19% were categorised to lipids, amino acids, nucleic acids, carbohydrate, carboxylic acid and others respectively.
To visualise the metabolic variations between mock- and RGNNV-infected groups, multivariate projection approaches such as PCA and OPLS-DA were used to identify the dynamic metabolic responses to RGNNV infection. The PCA score plots showed that the metabolic profiles in RGNNV-infected cells were significantly altered compared with mock-infected cells (Figure S2). The OPLS-DA model showed a distinct separation between the metabolite fingerprinting of the groups “mock-24 hr p.i.” and “RGNNV-24 hr p.i.” with R2X = 0.288, R2Y = 1, and Q2 = 0.954 under positive mode and R2X = 0.362, R2Y = 1, and Q2 = 0.978 under negative mode, suggesting that RGNNV infection notably changed the metabolism of GS cells (Figure 1a,b). According to the screening criteria (the variable importance in the projection (VIP) > 1 and p value <.05), among 239 metabolites, 53, 54 and 35 metabolites were differentially expressed under the positive and negative modes between mock groups and RGNNV infection groups at 12, 24 and 48 hr p.i. respectively. The relationship between differential metabolites was analysed by using the Pearson's correlation. The results indicated that differential metabolites in the related metabolic pathways were closely connected (Figure S3). At the different stages of RGNNV infection, including 12, 24, 48 hr p.i., the levels of 43, 29 and 14 metabolites were increased, whereas those of 10, 25 and 21 metabolites were decreased respectively (Figure 1c). A total of 71 metabolites were differentially regulated in RGNNV-infected cells compared with mock-infected cells (Table S1). Among them, 23 metabolites were detected in all three infection times, such as valine, phenylalanine, thyronine, palmitic acid, oleic acid, citrate acid, and eight, nine and six metabolites were only detected at 12, 24 and 48 hr p.i. (Figure 1d). Moreover, the heatmap analysis indicated that the differential metabolites examined in each group could be subjected to different metabolic pathways, including amino acid, carbohydrate, lipid and nucleotide metabolism (Figure 1e).
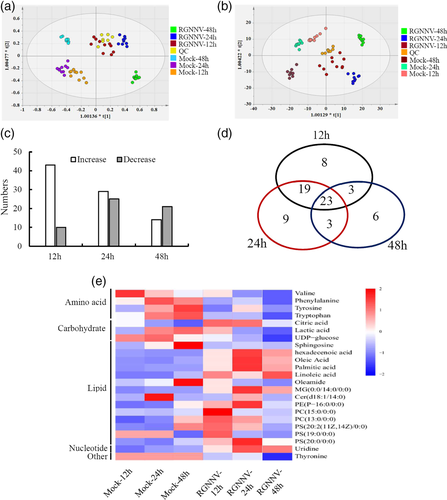
Further analysis indicated that the metabolites belonging to specific metabolic pathways were differently regulated by RGNNV replication. In RGNNV-infected cells, there was a general decrease in amino acid metabolism including most of the detected amino acids, such as valine, leucine, phenylalanine, tryptophan, arginine, and so on. However, a small number of amino acids increase in virus-infected cells, threonine was only increased in RGNNV-infected cells at 48 hr p.i., and glutamate was increased from 12 to 24 hr p.i. The results suggested that RGNNV infection disrupted amino acid metabolic pathways in vitro. As the infection progressed, the levels of metabolites involved in the citric acid cycle increased with respect to mock infection. Citric acid significantly increased by 4.28 folds at 48 hr p.i. Another TCA cycle constituent, succinic acid, increased by 1.25 folds at 24 hr p.i., and then decreased (Table S1). Interestingly, almost all of the detected metabolites involved in lipid metabolism were significantly increased by RGNNV infection, suggesting that lipid metabolism might play an important role in RGNNV infection.
2.2 Altered metabolic pathways during RGNNV infection
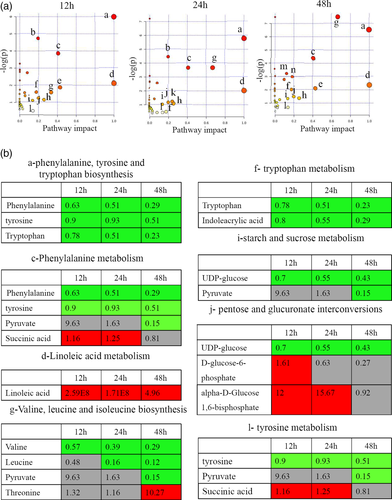
Differential metabolites were further analysed with MetaboAnalyst to demonstrate the effects of RGNNV infection on metabolic pathways in GS cells. When the impact-value threshold of pathway analysis was set to 0.10, there were 11, 11 and 12 pathways of potential change due to RGNNV infection identified in virus-infected cells at 12, 24, and 48 hr p.i. respectively. Among them, nine metabolic pathways were identified at all three time points, including phenylalanine, tyrosine and tryptophan biosynthesis, phenylalanine metabolism, linoleic acid metabolism, tryptophan metabolism, valine, leucine and isoleucine biosynthesis, glyoxylate and dicarboxylate metabolism, starch and sucrose metabolism, pentose and glucuronate interconversions and tyrosine metabolism. Taurine and hypotaurine metabolism was identified in virus-infected cells at 12 and 48 hr p.i.. Histidine metabolism and pyruvate metabolism were only identified in virus-infected cells at 24 p.i. and 48 hr p.i. respectively. The phenylalanine, tyrosine and tryptophan biosynthesis, phenylalanine metabolism, linoleic acid metabolism were the most significantly impacted pathways (Figure 2a) (Table S2). Notably, except for succinic acid, the altered metabolites involved in phenylalanine, tyrosine, tryptophan biosynthesis and metabolism pathway decreased in RGNNV-infected cells, suggesting that phenylalanine, tyrosine and tryptophan biosynthesis might play important roles during RGNNV infection. Interestingly, linoleic acid, an essential fatty acid, was not identified in mock-infected cells, while it was significantly induced in RGNNV-infected cells. This suggested that RGNNV infection might alter the fatty acids metabolism pathway (Figure 2b).
2.3 Screening of key metabolites associated with RGNNV infection
In order to identify the important differential metabolites in response to RGNNV infection, the SAM method was used to screen the most discriminant biomarkers in RGNNV-infected cells. As shown in Figure 3a, PE (P-16:0/0:0) and PC (15:0/0:0) were the most significant differential metabolites in the RGNNV-12 hr group compared with the mock-12 hr group. Compared with the mock-24 hr group and the mock-48 hr group, three metabolites were selected as biomarkers for the RGNNV-24 hr group, and four metabolites were selected for the RGNNV-48 hr group. Based on the SAM analysis, it is proposed that PE (P-16:0/0:0), oleic acid and tryptophan were shown to be the most important differential metabolites (Figure 3a).
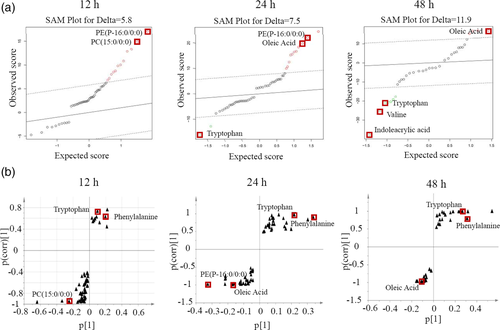
In addition, significantly regulated metabolites, obtained from OPLS-DA analysis, might be viewed as potential biomarkers. Discriminating variables were shown by S-plot analysis. Cut-off values were set as greater than or equal to 0.05 and 0.5 for absolute value of covariance p and correlation p respectively. Important biomarkers screened by component p [1] for separation between the virus-infected group and the mock-infected group, and the biomarker, should be present in both components based on the three S-plots. The results showed that tryptophan, phenylalanine and oleic acid were identified, however, they were significantly altered in the RGNNV-infected groups compared with mock-infected groups (Figure 3b). Combining with the results from the SAM analysis, it was speculated that oleic acid and tryptophan might be the potential biomarkers for RGNNV infection.
2.4 RGNNV infection significantly regulated lipid metabolism
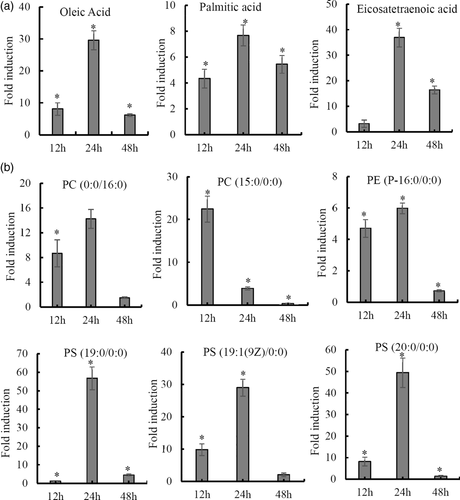
Due to the future potential for antiviral development, increasing attention has been given to the role of lipids and lipid metabolism during viral infection (Martín-Acebes, Vázquez-Calvo, & Saiz, 2016; Tongluan et al., 2017). In the current study, it was found that several representative metabolites in de novo lipogenesis, such as palmitic acid and oleic acid, were significantly increased after RGNNV infection (Figure 4a). Moreover, RGNNV infection significantly altered the levels of 15 phospholipids, including 10 phosphatidylserines (PS), 3 phosphatidylcholines (PC), 1 phosphatidylethanolamine (PE) and 1 phosphatidylinositol (PI) (Table S1). For example, the abundance of PC (15:0/0:0) reached the peak at 12 hr p.i., but gradually decreased in abundance with infection time. On the contrary, the abundance of PC (0:0/16:0), PS (20:0/0:0), PS (19:0/0:0), PS (19:1[9Z]/0:0) and PE (P-16:0/0:0) all reached the peak at 24 hr p.i., and then decreased at 48 hr p.i. compared with mock cells (Figure 4b). These data indicate that the modulation of cellular lipid metabolism might be crucial for RGNNV infection in host cells.
2.5 RGNNV infection induced the formation of lipid droplets
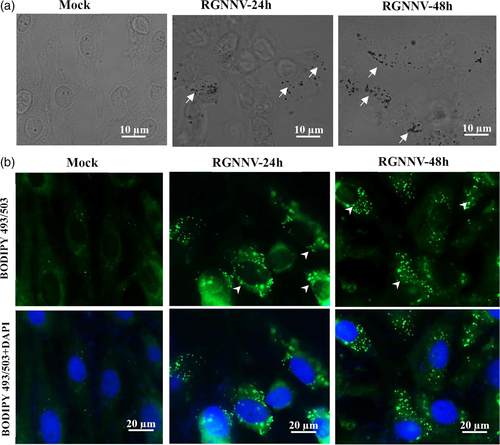
It has been demonstrated that long-chain fatty acids (LCFAs), such as oleic acid increases lipid droplet formation in multiple cells (Rohwedder, Zhang, Rudge, & Wakelam, 2014). To determine whether the increase of LCFAs evoked by RGNNV contributed to lipid droplet formation, mock- and RGNNV-infected cells were stained with Oil Red O. As shown in Figure 5a, few lipid droplets were observed in mock-infected cells, whereas higher levels of lipid droplets were detected in RGNNV-infected cells. Consistently, after staining with the neutral lipid-specific green fluorescent dye BODIPY 493/503, we found that the number of detectable lipid droplets was increased during RGNNV infection (Figure 5b). This observation suggests a link between lipid droplet metabolism and RGNNV replication.
2.6 Fatty acid synthesis is essential for RGNNV replication
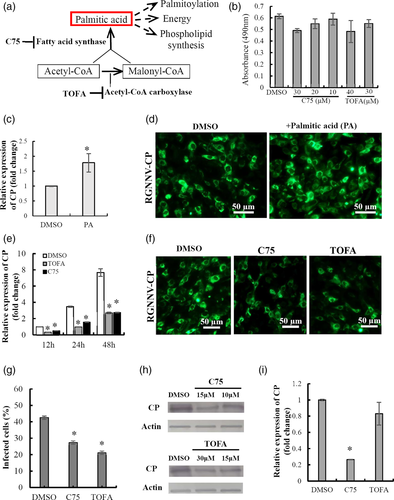
During the process of de novo fatty acid synthesis, acetyl-CoA carboxylase (ACC) catalyses acetyl-CoA to form malonyl-CoA. Next, fatty acid synthase uses malonyl-CoA and acetyl-CoA to catalyse subsequent successive reactions to form fatty acids, predominately palmitate (Figure 6a). To further assess whether fatty acid synthesis was essential for RGNNV replication, virus replication was evaluated with addition of exogenous palmitate. As shown in Figure 6c,d, it was found that the addition of palmitate significantly increased viral gene transcription as well as protein synthesis during RGNNV infection compared with DMSO-treated controls. This raised the question of whether enzyme activity of ACC and FASN were critical for RGNNV infection. To address this, TOFA, a competitive inhibitor of ACC, and C75, an inhibitor of FASN (Greseth & Traktman, 2014), were used to treat GS cells, and their effects on viral replication were determined. After determining the cell cytotoxicity of TOFA and C75 on cells (Figure 6b), effective doses of 30 μM TOFA and 15 μM C75 were used to pretreat cells before RGNNV infection. The results showed that the number of vacuoles induced by RGNNV infection was reduced in TOFA-treated and C75-treated cells compared with DMSO-treated cells (data not shown). As shown in Figure 6e, the transcripts of viral genes, including coat protein (CP) and RNA-dependent RNA polymerase (RdRp) were dramatically decreased after addition of TOFA or C75. However, the inhibitory effect of TOFA was stronger than that of C75. Immunofluorescence microscopy showed a reduction in staining for CP positive cells after treatment with TOFA or C75 when compared with DMSO-treated cells (Figure 6f). Quantitative analysis indicated that the percentage of infected cells was significantly reduced in TOFA- or C75-treated cells compared with DMSO controls (Figure 6g). Moreover, protein synthesis of CP decreased upon treatment with TOFA or C75 in a dose-dependent manner (Figure 6h). Further analysis indicated that FASN, but not ACC1, played a more crucial role during the process of RGNNV entry (Figure 6i).
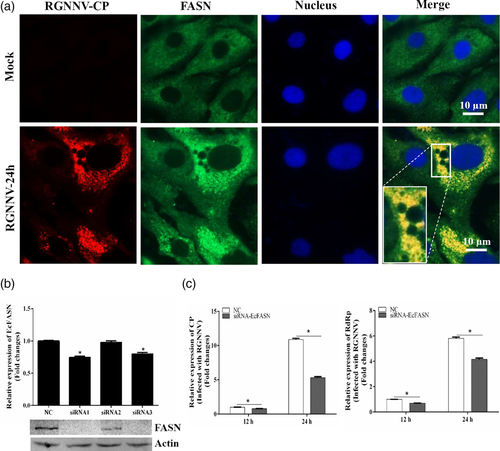
To clarify the detailed roles of FASN in RGNNV infection, the expression profiles of FASN in mock- and RGNNV-infected cells were detected using antibodies against FASN and RGNNV CP protein. In mock-infected cells, FASN was uniformly distributed throughout the cytoplasm. Notably, the localization of FASN in RGNNV-infected cells at 24 hr was altered, showing an accumulation and enhancement of fluorescence signal in the cytoplasm. Moreover, the bright fluorescence signal of FASN was observed to be partly co-localised with RGNNV CP in RGNNV-infected cells (Figure 7a). To further explore whether grouper FASN was essential for RGNNV replication, we first knocked down FASN in GS cells using siRNA transfection, and examined the potent silencing efficiencies of siRNAs on endogenous FASN. The relative expression level of grouper FASN in grouper cells was both significantly decreased in siRNA1- and siRNA3-transfected cells. Consistently, the synthesised FASN protein in siRNA1- and siRNA3-transfected cells was also significantly reduced compared with the negative control siRNA (NC)-transfected cells (Figure 7b). Then, siRNA1 was chosen to evaluate the effect of knock down of FASN on RGNNV replication. The results showed that knock down of FASN significantly inhibited RGNNV infection, demonstrated by the marked reduction in transcription of RGNNV core genes, including CP and RdRp (Figure 7c). Thus, it was speculated that FASN was essential for RGNNV replication, and fatty acid synthesis was crucial for RGNNV replication in the life cycle of RGNNV infection.
2.7 Inhibition of palmitoylation or phospholipid synthesis decreased RGNNV replication
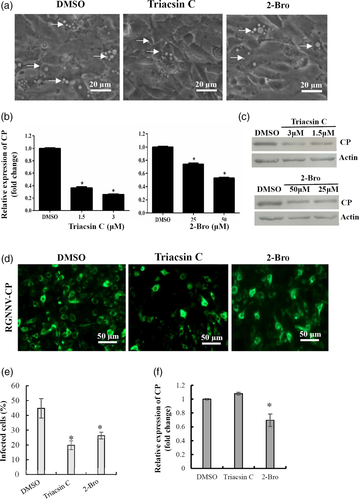
Palmitate has been proven to exert several biological functions, including protein palmitoylation, phospholipid synthesis or energy production. To determine the effects of protein palmitoylation on RGNNV infection, GS cells were treated with the palmitate analogue 2-bromopalmitate (2-Bro), which impairs palmitoylation by inhibiting palmitoyl acyl transferases (Greseth & Traktman, 2014). In addition, cells were treated with Triacsin C, which prevents the acylation of long-chain fatty acids and hence the initiation of phospholipid synthesis (Liefhebber, Hague, Zhang, Wakelam, & McLauchlan, 2014). As shown in Figure 8a, the number of the vacuoles and dead cells (Figure S4) induced by RGNNV infection were markedly reduced in 2-Bro or Triacsin C-treated cells compared with DMSO-treated cells. Treatment with 2-Bro or Triacsin C significantly decreased the transcription and protein synthesis of RGNNV CP compared with DMSO-treated cells (Figure 8b,c). Furthermore, immuno-fluorescence assay displayed a marked reduction of CP-positive fluorescence signal after treatment with 2-Bro or Triacsin C compared with DMSO (Figure 8d). Quantitative analysis indicated that the percentage of RGNNV-infected cells decreased from 44.72% in DMSO-treated cells up to 19.86% in Triacsin C-treated cells, and 26.38% in 2-Bro-treated cells respectively (Figure 8e). Further studies showed that 2-Bro, but not Triacsin C affected RGNNV infection through virus entry (Figure 8f). Together, these data showed that protein palmitoylation and phospholipid synthesis were both crucial for RGNNV replication.
2.8 Inhibition of fatty acid oxidation by etomoxir suppressed RGNNV replication
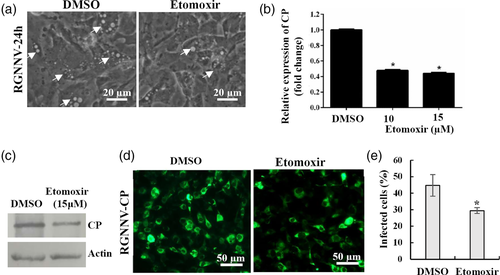
During the viral life cycle, palmitate has also been proven to play a major role to drive the TCA cycle and energy production for vial replication. Mitochondrial fatty acid oxidation was crucial in this process (Greseth & Traktman, 2014). To clarify whether fatty acid oxidation was essential for RGNNV infection, GS cells were treated with etomoxir, an inhibitor of fatty acid oxidation (FAO) (Heaton & Randall, 2010; Valle-Casuso et al., 2019). As shown in Figure 9a, the number of vacuoles and dead cells (Figure S4) induced by RGNNV infection were reduced in etomoxir-treated cells when compared with DMSO-treated cells. Moreover, transcription and protein synthesis were both significantly decreased in etomoxir-treated cells compared with DMSO controls (Figure 9b,c). Immunofluorescence microscopy showed that treatment with etomoxir decreased the fluorescence density of RGNNV CP during RGNNV infection. Quantitative analysis indicated that the percentage of RGNNV-infected cells decreased from 44.72% in mock-treated cells to 29.51% in etomoxir-treated cells (Figure 9d,e). Moreover, the inhibitory effect of etomoxir on RGNNV infection was not present in the process of RGNNV entry (data not shown). Based on these data, it is proposed that fatty acid oxidation is a critical event during RGNNV replication.
3 DISCUSSION
In recent years, there has been an increase in the frequency of viral nervous necrosis disease outbreaks in marine aquaculture. Although these outbreaks have caused great economic losses, no efficient therapeutic approaches have been developed to date. Research efforts have focused on investigating the action of numerous innate immune genes on RGNNV replication (Huang et al., 2015; Yang et al., 2016). However, particular host metabolic changes during RGNNV infection have not been elucidated. In the last decade, metabolomic techniques have been successfully applied in order to explore metabolic alterations required for the replication of many virus species. Virus-specific metabolic analysis not only provides new insights into understanding the mechanism of viral pathogenesis, but also facilitates the identification of novel potential targets for antiviral therapy (Delgado et al., 2012; Li et al., 2015; Sun et al., 2013). Much of the progress on metabolic changes during viral infection has been made on mammalian viruses, but few studies have focused on global metabolic profiles of lower vertebrate viruses, particularly in fish viruses.
In the present study, metabolic profiles were investigated using LC-Q/TOF-MS combined with multivariate statistical analysis. A total of 71 metabolites were differentially regulated in RGNNV-infected cell, 23 metabolites were determined over all three infection times. The altered metabolites suggested that multiple metabolic pathways were abnormal as a result of RGNNV infection. Increasing evidence showed that a number of core cellular metabolic pathways, including glycolysis, fatty acid synthesis and glutaminolysis, had been significantly altered by multiple virus families, including HCV, HIV, HSV and HCMV (Goodwin et al., 2015; Gou et al., 2017; Roe et al., 2011). For example, there was a significant increase in the relative levels of metabolites involved in nucleotide synthesis and RNA replication during early HCV infection (Roe et al., 2011). After classification of the relevant metabolites, different metabolic pathways, including amino acid, fatty acid, phospholipid and nucleotide metabolism were found to be significantly regulated by RGNNV infection. For example, all metabolites including valine, leucine, phenylalanine, tyrosine and tryptophan significantly decreased. This suggested that RGNNV infection severely disrupted amino acid metabolism in host cells. In contrast, during WSSV infection, viral infection induced an increase in several detected amino acids at 12 hr p.i., and the pattern of those amino acids were changed at 24 hr p.i. (Su et al., 2014). The differences in metabolic pathways caused by different viruses may be related to viral replication dynamics and the cell fate after infection.
Recent studies have shown that metabolomics is efficient for identifying small molecule biomarkers used in diagnosis and prognosis of cancer and viral diseases (Voge et al., 2016). In the present study, using the OPDL-DA and SAM methods, oleic acid and tryptophan were screened as the important differential metabolites for the diagnosis of the RGNNV infection. During viral infection, tryptophan metabolism could be enhanced by interferon by inducing indoleamine 2,3-dioxygenase. Interferon then altered metabolism and inflammation, and finally influenced viral replication (Fritsch & Weichhart, 2016; Li, Huang, Lemos, Mautino, & Mellor, 2012). Moreover, it has been shown that the IFN-γ-induced antiviral activity against measles virus can be overcome by the addition of excess amounts of l-tryptophan (Obojes, Andres, Kim, Däubener, & Schneider-Schaulies, 2005). Like other RNA viruses, RGNNV infection markedly up-regulates a variety of cytokines, including pro-inflammatory cytokines and interferon, indicating that RGNNV induces a strong innate immune response (Liu, Wang, Kwang, Yue, & Wong, 2016). Whether the changes of intracellular tryptophan levels were regulated by IFNγ during RGNNV infection requires further investigation.
Interestingly, RGNNV infection also induced an increase level of metabolites which involved in fatty acid biosynthesis, such as linoleic acid, palmitic acid, palmitic amide, oleic acid as well as eicosatetraenoic acid, suggesting that lipid metabolism was involved in RGNNV infection. For HCV, virus infection disrupts a number of lipid metabolic pathways and leads to an increase in both cholesterol and sphingolipid levels (Roe et al., 2011). Similarly, Dengue virus infection also up-regulates the levels of sphingolipids and a number of additional phospholipids (Perera et al., 2012). Like other RNA viruses, RGNNV infection induces the typical cytopathic effects in infected cells, evidenced by a large number of vacuoles and the abundant virions surrounded by the vacuolar membrane (Chen et al., 2006; Huang et al., 2011). As major constituents of the plasma membrane, sphingolipids, including sphingosine and sphinganine, were up-regulated in RGNNV-infected cells at early stage of infection, and then was gradually down-regulated, suggesting that phospholipid synthesis exerted critical roles during RGNNV replication. As an essential substrate for phospholipid synthesis or β-oxidation, fatty acyl-CoAs were generated and catalysed by acyl-CoA synthetases (Liefhebber et al., 2014). Inhibition of acyl-CoA synthetase activity by Triacsin C affected viral infection by suppressing viral RNA replication or protecting the virus from the cellular anti-viral response (Liefhebber et al., 2014; Nchoutmboube et al., 2013; Viktorova et al., 2018). Similarly, we also found that Triacsin C treatment significantly decreased the infection of RGNNV, as demonstrated by reduced viral gene transcription and protein synthesis in GS cells. Thus, a hypothesis was proposed that phospholipids participate in RGNNV infection either by affecting vacuole formation, or regulating the host antiviral state.
It has been well established that cellular lipid metabolism is induced and exploited by many viruses in order to facilitate viral multiplication. During de novo lipid biosynthesis, FASN acts as a key enzyme and exerts crucial roles in viral infection (Heaton et al., 2010). In the present study, FASN distribution was altered, and partly co-localised with CP protein during RGNNV infection. Moreover, pharmacological inhibition and RNA interference of FASN both significantly decreased RGNNV replication. Actions against RGNNV infection occurred at multiple stages of the viral life cycle, including virus entry and replication. In the pathogenesis of the Dengue virus, FASN was activated and recruited to the sites of viral replication by the viral nonstructural protein 3 (Heaton et al., 2010). In addition, inhibition of FASN by C75 also led to a significant decrease in Dengue viral replication (Tongluan et al., 2017). In this regard, it was speculated that fish RNA viruses, such as RGNNV, also exploit FASN in viral infections, including entry and replication as in mammalian RNA viruses (Yang et al., 2008). Likewise, lipid droplets, which hubs for lipid metabolism, were also demonstrated to provide the place for virus replication or assembly, such as Dengue virus and HCV (Herker & Ott, 2012; McLauchlan, 2009; Xu & Nagy, 2014). The data presented here also showed that lipid droplets were formed in RGNNV-infected cells, and Triacsin C markedly inhibited RGNNV replication by blocking the de novo synthesis of glycerolipids and cholesterol esters, indicating that lipid synthesis might play an important role in the process of RGNNV infection. Moreover, degradation of fatty acids by fatty acid β-oxidation was also essential for RGNNV replication, evidenced by the inhibitory effect of FAO inhibitor on viral gene transcription and protein synthesis. Similar actions of FAO were also demonstrated in both Dengue and measles infections (Heaton & Randall, 2010; Jordan & Randall, 2016; Pombo & Sanyal, 2018). Thus, the findings presented here suggest that RGNNV-induced lipid metabolism is required for RGNNV replication. However, the precise mechanism by which fatty acid synthesis is involved in RGNNV infection has yet to be resolved.
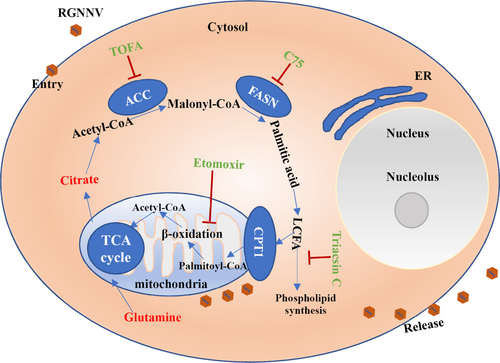
In summary, metabolic profiles during RGNNV infection were investigated using LC-Q/TOF-MS combined with multivariate statistical analysis. The results presented here showed that RGNNV infection altered key cellular metabolic pathways, including amino acid, fatty acid and nucleotide metabolism. Moreover, oleic acid and tryptophan were screened as important metabolite markers in response to RGNNV infection. RGNNV infection not only increased and accumulated some phospholipids in virus-infected cells, but also induced the formation of lipid droplets. RGNNV infection altered the localization of FASN, and FASN was confirmed to be essential for efficient viral replication. Moreover, critical events, including fatty acid synthesis, phospholipid synthesis and β-oxidation, were all essential for RGNNV infection. Taken together, these results demonstrated for the first time that RGNNV not only alters host cell metabolism, but also exploits cellular fatty acid biosynthetic pathway for efficient replication (Figure 10). These data will provide further insights into the pathogenesis of fish nodavirus and will contribute to understanding the interaction between viruses and host cells.
4 EXPERIMENTAL PROCEDURES
4.1 Cell and virus
Grouper spleen (GS) cells were established and maintained in our laboratory (Huang, Huang, Sun, Han, & Qin, 2009). GS cells were grown in Leibovitz's L15 medium containing 10% fetal bovine serum (Gibco) at 25°C. The RGNNV used in the study was prepared as described previously (Huang, Huang, Ouyang, & Qin, 2011).
4.2 Cell viability assay
Cell viability was performed using 3-(4,5-dimethylthiazol-2-yl)-2,5-diphenyltetrazolium bromide (MTT) assay as described previously (Zhang et al., 2019). Dead cells were stained with Image-It Dead Green Viability Stain (Invitrogen) as described previously (Delgado et al., 2012). In brief, DMSO- or inhibitor-treated infected cells were incubated with Image-It Dead Green Viability stain for 15 min. Cells were then imaged under the fluorescence microscope (Zeiss).
4.3 Metabolomics analysis
4.3.1 Metabolic profiling and metabolites analysis
Sample preparation: For analysis of metabolite profiles during RGNNV infection, GS cells were equally seeded and maintained in normal medium for 18 hours. Then, cells were infected with RGNNV or treated equivalent medium, for 1 hr, replaced with fresh medium and maintained for the indicated time interval post infection. For each time point, an additional group including mock-treated and infected cells were processed for cell counting. Mock- and RGNNV-infected cells each containing 1 × 10⁷ cells (n = 10) were harvested for metabolic analysis at 12, 24 and 48 hr p.i. All of the samples from two independent experiments which were performed in five replicates were prepared as described previously (Munger et al., 2006).
LC–MS analysis: All samples were extracted with 1 mL of methanol (Merck) containing 10 μL internal standards (2.9 mg/mL, dl-o-chlorophenylalanine). The samples were vortexed for 30 s, and lysed by ultrasonic waves at 50 KHz for 30 min. The mixture was centrifuged at 12 000 rpm/min for 10 min at 4°C. Supernatant (200 μL) was transferred to vials for LC–MS analysis (Majorbio Bio-Pharm Technology Co., Ltd., Shanghai, China).
The detection instrument was the LC-Q/TOF-MS (Agilent, 1,290 Infinity LC, 6530 UHD and Accurate-Mass Q-TOF/MS) with a C18 chromatographic column (Agilent, 100 mm × 2.1 mm, 1.8 μm). The separation conditions were as follows: column temperature, 40°C; flow rate, 0.35 mL/min; pressure limit, 800 bars; mobile phase A, 0.1% formic acid in water (v/v); mobile phase B, 0.1% formic acid in acetonitrile (v/v) and injection volume, 4 μL; and automatic injector temperature was 4°C. The gradient of the mobile phase was 5% mobile phase B at 0 and 1 min, 20% mobile phase B at 6, 50% mobile phase B at 9 min and 95% mobile phase B at 13 and 15 min.
Sample analysis was performed under the positive and negative ion modes. The mass parameters of positive ion modes (ESI+) were as follows: capillary voltage: 4 kV; sampling cone: 35 kV; source temperature: 100°C; desolvation temperature: 350°C; cone gas flow: 50 L/hr; desolvation gas flow: 600 L/hr; extraction cone: 4 V. The mass parameters of negative ion modes (ESI-) were as follows: capillary voltage: 3.5 kV; sampling cone: 50 kV; source temperature: 100°C; desolvation temperature: 350°C; cone gas flow: 50 L/hr; desolvation gas flow: 700 L/hr; extraction cone: 4 V. Nitrogen was as the cone or desolvation gas. The ion scan time was 0.03 s with a scan interval of 0.02 s. The mass scanning range was 50–1000 m/z. Leu-enkephalin was utilised as the lock mass, [M + H]+: 556.2771 Da for positive ion modes and [M–H]–: 554.2615 Da for negative ion modes.
Data preprocessing and statistical analysis: Feature extraction of the acquired LC–MS data was performed and preprocessed with Mass Profiler software (Agilent), and then normalised the peak area of metabolites and edited into a two-dimensional data matrix by Excel 2010 software, including retention time, compound molecular weight (mass), observations (samples) and peak intensity. The data after editing were subject to multivariate analysis using SIMCA-P 13.0 software (Umetrics AB, Umea, Sweden). The multivariate statistical analyses, including PCA, PLS-DA and OPLS-DA, were performed to test the difference between the metabolomic data and the mock group and virus groups. The quality of the models was described by the R2X or R2Y and Q2 values.
Differentially expressed metabolites were selected according to the variable importance in the projection (VIP) (>1) from OPLS-DA combined with the p value (<.05) from a two-tailed Student's t-test. The differential m/z candidates were putatively identified through searching the online Metlin database (metlin. Scripps.edu/) and the local KEGG databases (version 59, BGI TechSolutions Co., Ltd., Shenzhen, China).
4.3.2 Bioinformatics analyses
Hierarchical clustering was performed on the log transformed normalise date and was then completed in the R platform. The possible biological roles of differentially expressed metabolites were evaluated via enrichment analysis using MetaboAnalyst (http://www.metaboanalyst.ca/MetaboAnalyst/). To explore the most crucial metabolites related to RGNNV infection, OPLS-DA was conducted to recognise the sample pattern. Potential markers of interest were extracted from S-plots constructed following OPLS-DA, and markers were chosen based on their contribution to the variation and correlation within the dataset. Additionally, the significance analysis for microarrays (SAM) was also used to select the most discriminant and interesting biomarkers.
4.4 Immunofluorescence assay
Virus infection was evaluated by immunofluorescence staining for RGNNV CP. In detail, mock- and RGNNV-infected cells at indicate time points (12, 24 or 48 hr p.i.) were fixed in 4% paraformaldehyde at room temperature for 30 min, and then submerged in 70% ethanol at −20°C for 7 min. After washing with PBS, the coverslips were blocked by 2% bovine serum albumin for 30 min. For viral CP protein and cellular fatty acid synthase co-localization analysis, mock- or RGNNV-infected cells were incubated with mouse anti-CP antiserum (1:75) and rabbit anti-FASN (1:100) for 2 hr, and then stained with secondary antibody anti-mouse IgG Fab2 Alexa Fluor 555 and anti-rabbit IgG Fab2 Alexa Fluor 488 (1:100; Molecular probe). The distribution profiles of FASN and RGNNV CP were observed under fluorescence microscopy (Zeiss). To designate the localization of the nucleus, cells were stained with 6-diamidino-2-phenyl-indole (DAPI). The infected cells were quantified as the percentage of positive cells (green fluorescence) relative to the number of total cells (stained with DAPI) as described previously (Guo et al., 2012).
4.5 Lipid droplet staining
To detect the formation of lipid droplets during virus infection, cells were stained with Oil-Red-O, a specific stain for lipid droplets as described previously (Delgado et al., 2012). Mock- and RGNNV-infected cells were seeded in glass bottom dishes, fixed with 10% formalin in PBS for 1 hr, and washed with 60% isopropanol for 10 minutes. The cells were then stained with fresh Oil-Red-O (Sigma-Aldrich) in a working solution (Oil-Red-O 0.5% in isopropanol: water = 3:2) for 15 min. Then, the cells were washed with 60% isopropanol to remove background staining. Finally, cells were washed with dH2O, and fresh medium was added in glass bottom dishes for observation. Images were taken under bright field microscopy.
The occurrence of lipid droplets during RGNNV infection was evaluated by microscopic examination of cells stained with BODIPY® 493/503 (Invitrogen) as described previously (Viktorova, Nchoutmboube, Ford-Siltz, Iverson, & Belov, 2018). Mock or infected cells were incubated with 5 μM Bodipy 493/503 for 15 min and then stained with DAPI. Images were taken under fluorescence microscopy.
4.6 RNA extraction and quantitative PCR (qPCR)
To determine the virus replication dynamics, viral gene transcriptions were detected by qPCR. For example, after pretreatment with FAS inhibitors 5-(tetradecyloxy)-2-furoic acid (TOFA) (30 μM) or acetyl-CoA carboxylase (ACC1) inhibitor C75 (15 μM), GS cells were infected with RGNNV for different infection times (12, 24, 48 hr p.i.) respectively. Other inhibitors were also used as described above, including Triacsin C and 2-Bro which inhibited protein palmitoylation and phospholipid synthesis respectively. Total RNA from mock- or RGNNV-infected cells were isolated using the SV total RNA isolation system (Promega) according to the manufacturer's instruction. The RNA was reverse transcribed using ReverTra Ace qPCR RT Kit (TOYOBO). Amplification was examined using SYBR Green I Reaction Mix (Toyobo) in a Roche Light Cycler 480. Each sample contained three independent individuals collected for RNA extraction and gene expression analysis. The results were calculated based on the expression levels of targeted genes normalised to β-actin at the indicated time. The data were represented as mean ± SD. All the primers of target genes were described in the previous study (Huang et al., 2015). Statistical significance was determined with Student's t-test and the statistical significance was set at p < .05.
To further analyse the actions of different inhibitors on virus entry, cells were pretreated with inhibitors and infected with virus for 1 hr, as described previously (Zhang et al., 2019). Both the mock- or RGNNV- infected cells were collected for further qPCR analysis.
4.7 Western blotting assay
At the indicated time points, siRNA-transfected, mock- or RGNNV-infected cells were harvested and the pellets were resuspended in 1× lysis buffer (Cell Signalling Technology). SDS-PAGE and western blotting were performed as described previously (Huang et al., 2013). Equal amounts of protein were subjected to SDS-PAGE and then transferred to polyvinylidene difluoride membranes. After blocking with 5% nonfat dry milk, the membranes were incubated with the primary antibodies for 2 hr at room temperature, including anti-CP (1:3000), anti-FASN (1:3000) or anti-actin (1:5000). After washing with Tris buffer, the membranes were incubated for 1 hr with the HRP-goat anti-rabbit IgG (1:1000). Immunoreactive bands were visualised with diaminobenzidine.
ACKNOWLEDGMNETS
This work was supported by grants from the National Key R&D Program of China (2018YFD0900504), National Natural Science Foundation of China (31930115, 31772877), and China Agriculture Research System (CARS-47-G16).
CONFLICTS OF INTEREST
The authors declare no potential conflict of interest.
AUTHOR CONTRIBUTIONS
Youhua Huang, Xiaohong Huang and Qiwei Qin designed the study. Ya Zhang, Jiaying Zheng and Liqun Wang performed the experiments including RNA extraction, qPCR and cell toxicity analysis. Youhua Huang and Xiaohong Huang performed metabolic analysis, immune fluorescence assay and Western blotting assay. Youhua Huang wrote the paper. Qiwei Qin and Xiaohong Huang revised the paper. All authors reviewed the paper.


