Measuring the outcomes of lateral ridge augmentation using cone-beam computed tomography
Abstract
Objectives
Lateral ridge augmentation (LRA) is a surgical technique to gain bone prior to implant placement. Performing cone-beam computed tomography (CBCT) pre- and post-surgery allows for quantitative comparison of the buccal–lingual width and the vertical height of the edentulous ridges. This study used CBCT images to evaluate the bone regeneration following surgery.
Methods
A total of 30 cases from adult patients who underwent LRA and had high-quality CBCT images taken pre- and post-surgery from the same CBCT scanner were available for the retrospective study. Study data included linear measurements of the bone ridge width and height obtained from the middle of the edentulous ridge and a volumetric measurement of bone growth at the edentulous site observed on the CBCT scan.
Results
The reliability of the measurements was excellent as indicated by Intra-Class Coefficient values of 0.974 or higher. There was a significant mean bone increase from pre-surgery compared to post-surgery for both the linear and volumetric measurements. The linear bone gain ranged from 1.5 to 2.5 mm and volumetric gain from 250 to 750 mm3. However, two patients did not gain any bone. Multivariate regression showed the strongest predictors of bone gain post-surgery were the pre-surgery bone volume and a surgical site being in the mandible. For maxillary surgical sites, particularly anterior areas, the LRA surgeries were the least successful.
Conclusions
LRA before implant placement helped to increase bone for the majority of patients, particularly for surgical sites in the mandible. The quantitative analyses in the CBCT images showed excellent intra-examiner agreement.
Summary Box
What is known?
- CBCT imaging has become a valuable tool for planning implant placement.
- Bone width will impact the success of the implant, and there are a number of ways to promote bone growth prior to implant placement.
What this study adds?
- We report measurements of bone width gains from 2D and 3D analysis of CBCT images obtained pre- and post-lateral ridge augmentation surgery, and identify factors that affect bone growth.
1 INTRODUCTION
Bone grafting is an essential part of implant dentistry and is commonly performed by clinicians as a preparatory surgery for subsequent implant placement. For implant success, the buccal/lingual width of the bony ridge is crucial to ensure the stability of the implant.1 Many studies have shown that the thickness of the remaining bone around the implant has a substantial effect on implant success, and it has been noted that the minimal thickness of buccal bone adjacent to the implant needs to be 1 mm in the posterior region and 2 mm in the anterior region.2 Buccal bone thickness is crucial in maintaining mucosal and bone stability around the implant. In a study by Spray and colleagues, an inverse relationship was reported between pre-surgical buccal bone thickness and overall level of resorption post-surgery.3 Of importance, patients having less than 1.4 mm of buccal bone thickness experienced more horizontal bone loss. In contrast, those patients with a minimum of 1.8 mm of buccal bone thickness exhibited significantly less bone loss, and some gained buccal bone.3 Miyamoto and Obama reported that when the buccal bone thickness was more than 1.2 mm, there was less mucosal recession around the anterior implants.4 Therefore, the lateral ridge augmentation procedure should aim to increase the buccal bone thickness to a minimum of 1.5 mm.
Cone-beam computed tomography (CBCT) imaging is valuable in implant dentistry, and it is an important device for accurately measuring the width (buccal and lingual) and vertical height of the edentulous ridge in 3 dimensions.5-9 The optimized scanning conditions for acquiring quality CBCT images for evaluation of implant sites has been described for a number of machines.10, 11 CBCT is advantageous to determine appropriate length and width of a planned implant12 and for visualization of the mandibular canal.13 The present study evaluated the outcomes of lateral ridge augmentation in patients treated at the University of British Columbia (UBC), Canada graduate periodontics clinic by employing 2-dimensional and 3-dimensional CBCT image analysis. The study hypothesis was that lateral ridge augmentation increases the amount of bone, both linearly and volumetrically.
2 METHODS
This retrospective study was approved by the Institutional Clinical Research Ethics Board (H21-03330). Dental charts of all adult patients 18+ years old who underwent lateral ridge augmentation in the last 10 years at the UBC periodontics graduate clinic, for which quality pre- and post-surgery CBCT scans were available, were selected for further review. For standardization, only images obtained on the UBC Carestream 9300 CBCT scanner (Carestream Dental, Atlanta) were included in the study to avoid variation in field of view, resolution, and image quality. The exclusion criteria were incomplete pre- or post-surgical patient records or missing CBCT scans, and any images with metal artifacts or poor image quality that may impact image analysis. Based on these inclusion and exclusion criteria, a total of 30 cases with pre-and post-surgery CBCT images were available for the study.
Patient information and CBCT images were extracted from the clinical database and anonymized to protect patient privacy. The relevant clinical and demographic information was recorded: (1) type of technique and protocol employed for guided bone regeneration, (2) patient's sex, age, and date of lateral augmentation surgery, and (3) dates of the pre-surgery and post-surgery CBCT scans. In addition to the lateral ridge augmentation primary surgical procedure, all patients received a corticocancellous bone graft supported with a resorbable membrane. Augmentation surgeries took place at the Nobel BioCare University of British Columbia graduate clinic under the supervision of the periodontology clinic instructors.
For each patient, a CBCT with a dentoalveolar field of view (5 × 5 cm2) or a full-arch field of view (8 × 8 cm2, 10 × 5 cm2, or 10 × 10 cm2) was taken before and after the surgery (mean = 37 weeks post-surgery) using the Carestream CBCT machine, with scanning parameters listed in Table 1. Linear and volumetric measurements of the bone at the edentulous site before and after the lateral ridge augmentation surgery were taken from the CBCT images using MicroView software (ABA 2.2, Parallax Innovations, Ilderton, Canada). First the pre-surgery and post-surgery images were registered by selecting analogous points in the images as shown in Figure 1 and applying a rigid body transform to align the anatomy. Four analogous points were selected on easily identifiable landmarks on the root, enamel surface, maxillary sinus, bony prominences, and nerve canals. The pre- and post-surgery registered images were loaded side-by-side and reoriented to align the mid-line of the bone at the surgical site with the major axes of the images.
| Field of view (cm × cm) | X-ray energy (kVp) | Tube current (mA) | Voxel size (mm) |
|---|---|---|---|
| 5 × 5 | 90 (75–90) | 5 (4–8) | 0.2 (0.09–0.2) |
| 8 × 8 | 90 (85–90) | 4 | 0.18 |
| 10 × 5 | 90 (85–90) | 4 | 0.18 |
| 10 × 10 | 90 | 4 (4–5) | 0.18 |
- Note: Actual scans had some variation to account for different patient sizes and compositions, with the range of values used in brackets.
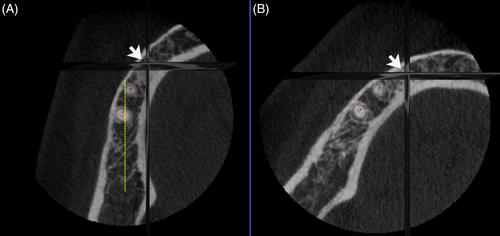
In order to increase the accuracy of linear measurements and predict the most accurate location of implantation, the mesial and distal measurements were performed for each bone ridge at three different locations (central, mesial, and distal). The midline (dotted yellow line shown in Figure 1) was defined as the midpoint of the anterior–posterior line and the central value was defined as the internal–external distance of the ridge at midline. The 1 mm anterior of the midline was captured and reported as a distal value and the 1 mm posterior of the midline was captured and reported as a mesial value. The linear measurement is shown in Figure 2A. This methodology was defined based on the tolerance of the drilling site of implantation and simulates the best practice for implant drilling options in real-life surgical procedures.9 The first measurement was at the highest point of the ridge, with four subsequent measurements with a distance of 1.8 mm (10 slices in the CBCT image) between the consecutive measurement points (at 0, 1.8, 3.6, 5.4, and 7.2 mm from the ridge). The linear measurement line was generated on the initial plan, and it was used as a guideline to find the midline of the bone and draw a vertical line for each slice of the image corresponding to the thickness of the ridge for a specific patient on that specific point.
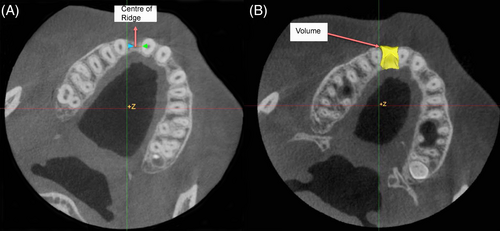
To measure the volumetric values, contours were drawn manually in the 3D image surrounding the bone defect at the highest point of the ridge. The contouring process was repeated in the same slices as the linear measurements (at 0, 1.8, 3.6, 5.4, and 7.2 mm from the ridge) and the shape was interpolated across all slices in the defined region to form a 3D region of interest that represented the bone volume in the CBCT image acquired before and the one acquired after the surgical procedure. The pre- and post-surgery images could be viewed side-by-side to verify accuracy and consistency of the contoured regions. All volumetric assessments were measured in mm3. The volumetric measurement is shown in Figure 2B.
All statistical analyses were performed using IBM SPSS version 28.0 software and the level of significance for all tests was set at p < 0.050. Given there were relatively approximately normal distributions of the study data, the pre- and post-surgery linear and volumetric measurements were compared by paired sample two-tailed t-test. In addition, given a relatively small study sample, the significance levels were also validated by the equivalent nonparametric Wilcoxon rank test. The intra-examiner agreement was tested by comparing the duplicate linear and volumetric pre- and post-surgery CBCT recordings of five randomly selected patients using the Intraclass Correlation Coefficient (ICC). Univariate and multivariate linear regression models were used, which tested two demographic predictors (sex and age) and three biological predictors (pre-surgery bone volume, surgery site being maxilla or mandible, and the location of the augmentation site).
3 RESULTS
The study included a total of 30 cases, of which 16 were males and 14 were females. The youngest patient was 22 years and the oldest patient was 84 years. Of all augmentation surgeries, 13 were done on the maxilla and 17 on the mandibula, and 8 of all were in the anterior and 22 in the posterior regions. To assess the intra-examiner reliability, all measurements were repeated in five randomly selected patients by a single examiner. The intra-examiner agreement was tested by the ICC employing the two-way fixed model and it was considered to be excellent as indicated by high ICC values (Table 2).
| Measurements | Pre-surgery images ICC (95% CI) | Post-surgery images ICC (95% CI) |
|---|---|---|
| Linear measurements (central) | 0.922 (0.982–0.997) | 0.922 (0.983–0.997) |
| Linear measurements (mesial) | 0.983 (0.962–0.933) | 0.987 (0.972–0.994) |
| Linear measurements (distal) | 0.979 (0.953–0.991) | 0.974 (0.942–0.988) |
| Volumetric measurements | 0.994 (0.948–0.999) | 0.999 (0.994–1.000) |
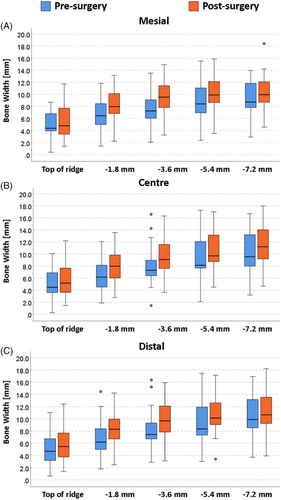
Linear bone width measurements in the pre-surgery and post-surgery images were taken along the midline of the edentulous region, 1 mm on the mesial side, and 1 mm on the distal side. Measurements were made at five locations including the top of the ridge and at 1.8 mm increments below the ridge, and are shown in Table 3. There were significant mean differences from pre-surgery to post-surgery in all three measurement locations (central, mesial, and distal) and at all measurement heights. These significant linear differences were observed with higher post-surgery mean values at all three locations (central, mesial, and distal) as compared to the pre-surgery values indicating that overall, bone grafting was successful to gain additional bone at grafted sites. Figure 3 shows the box plotted pre- and post-surgery values, where any outliers are indicated by blue or orange circles. Linear distances were consistently higher post-surgery as compared to the pre-surgery values with a relatively wide variation among patients at all measurement points. In the mesial measurements (Figure 3A), there was one extreme case (upper outlier) that had more bone post-surgically (18.4 mm) as compared to the rest of the patients sampled (ranging from 4.3 to 14 mm). In the central measurement (Figure 3B), there was one lower outlier where the pre-surgery horizontal distance was very small at 1.5 mm, while the post-surgical distance for this patient increased to 9.2 mm. On the other hand, there were two cases with more bone (upper outliers) as indicated by two pre-surgery distances (13.9 mm, 16.1 mm) as compared to other pre-surgery cases included in this current study. Looking at the distal measurements (Figure 3C), we see that there was one patient (lower outlier) who had substantially less bone post-surgery (3.8 mm) as compared to other patients. From the clinical point of view, the lower outliers observed after the surgery may be indicative of non-successful bone augmentation.
| Central | Mesial | Distal | |||||||
|---|---|---|---|---|---|---|---|---|---|
| Measurement location | Pre (mm) | Post (mm) | p-Values | Pre (mm) | Post (mm) | p-Values | Pre (mm) | Post (mm) | p-Values |
| Highest area of the ridge | 5.1 ± 2.4 | 5.6 ± 2.6 | 0.017 | 5.0 ± 2.2 | 5.7 ± 2.5 | 0.011 | 5.1 ± 2.7 | 5.9 ± 2.7 | 0.004 |
| 1.8 mm below | 6.4 ± 2.4 | 8.1 ± 2.7 | 0.003 | 6.8 ± 2.8 | 8.2 ± 2.6 | <0.001 | 6.9 ± 2.7 | 8.5 ± 2.7 | <0.001 |
| 3.6 mm below | 8.0 ± 3.0 | 9.8 ± 2.9 | <0.001 | 7.8 ± 3.0 | 9.8 ± 2.9 | <0.001 | 8.2 ± 3.0 | 9.9 ± 2.9 | <0.001 |
| 5.4 mm below | 9.1 ± 3.3 | 10.5 ± 2.9 | <0.001 | 8.9 ± 3.1 | 10.4 ± 2.9 | <0.001 | 9.3 ± 3.2 | 10.6 ± 2.8 | <0.001 |
| 7.2 mm below | 10.2 ± 3.3 | 11.4 ± 3.2 | <0.001 | 9.9 ± 3.3 | 11.0 ± 3.2 | <0.001 | 10.4 ± 3.3 | 11.3 ± 3.2 | <0.001 |
The overall distribution of volumetric data showed similar trends as the distribution of the linear measurements indicating an increase in bone volumes post-surgically. Figure 4 visualizes the relationship between the pre- and post-surgery bone volumes. The line in this figure shows that there was a high level of correlation between pre-and post-surgery bone volumes as indicated by the Pearson correlation coefficient of 0.967 (95% CI: 0.931–0.984). There was a significant mean increase in bone volume after the surgery (1330.7 ± 806.0 mm3) compared with the mean volume before the surgery (1076.2 ± 670.8 mm3) and a high degree of correlation (r = 0.967, p < 0.001) between the pre-surgery and post-surgery volume values. It is important to note that were two cases out of 30 studied where there was a slight decrease in bone volume post-surgically in one case by 26.3 mm3 (from 494.4 to 470.1 mm3) and in the second case by 21.4 mm3 (from 894.0 to 872.6 mm3).
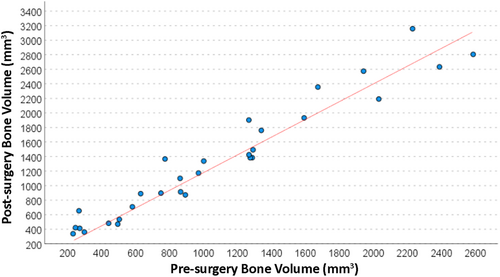
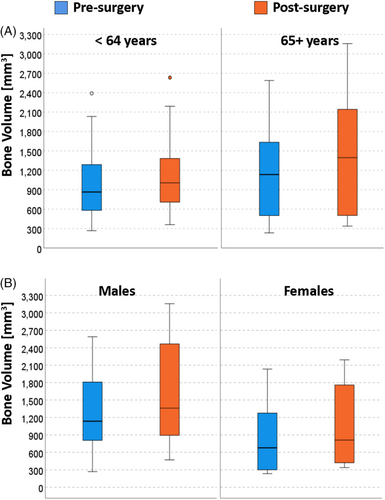
Figure 5A presents a partly unexpected finding showing that more bone was present at both observation times (pre-and post-surgery) in older patients (65+ years) as compared to the younger patients (≤64 years old). We think this can be explained that a more comprehensive consideration was taken prior to offering surgical ridge augmentation to older patients as compared to the younger ones. Figure 5B visualizes how pre-surgery and post-surgery bone volumes differed between males and females. The overall trend was that there was a substantial variation in these values particularly in the males' subgroup at both timepoints. Another clear trend visible is that females overall had lower pre-surgery and post-surgery bone volumes as compared to males.
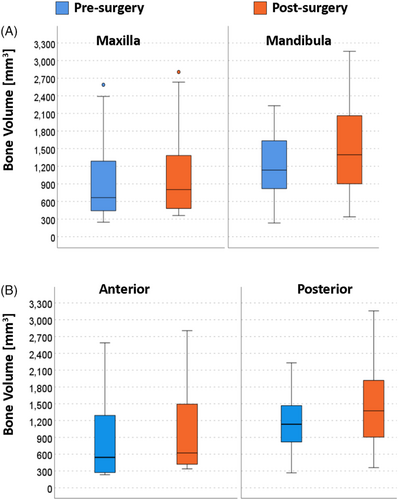
Jaw-related comparisons can be done by visualizing the data distribution presented in Figure 6A. One important trend we can see visually by comparing pre-surgery and post-surgery bone volumes is an overall low level of bone gain in cases where the bone was grafted in maxillary sites, while a better outcome can be observed (comparing pre-and post-surgery values) where grafting was performed in mandibular sites. Graft location-related trends can be observed in Figure 6B where distribution of the pre- and post-surgery bone volume values are presented separately for anterior and posterior sites. As expected, better post-surgery outcomes were observed in the posterior as compared to the anterior sites.
Regression results are presented in Table 4, where each of the five predictors are presented with unadjusted non-standardized (B coefficients) and their 95% CI values and unadjusted standardized β coefficients acquired from single predictor univariate regression models and adjusted standardized β coefficients acquired from a multivariate linear five-predictor regression model. The assumption of no multicollinearity among the predictors introduced into the multivariate linear regression model was fulfilled as indicated by tolerance values of each of the five individual predictors exceeding 0.600. This multivariate regression model with five predictors was significant (p = 0.012) and five predictors jointly explained 44.0% (R square = 0.440) of variation in the volumetric gain after the surgery. Of five predictors, three significant predictors of increased bone gain post-surgery were higher pre-surgery bone volume (adjusted β coefficient = 0.337; p = 0.009), older age (adjusted β coefficient = 0.294; p = 0.009), and grafts being placed in mandibles (adjusted β coefficient = 0.209; p = 0.011), while sex and grafting location were not significant predictors when adjusted for other predictors in the multivariate regression model.
| Predictors | B coefficients unadjusted (95% CI) | β coefficients unadjusted | p-Values |
|---|---|---|---|
| Sex | −79.5 (−254.1–95.1) | −0.174 (−0.83) | 0.359 |
| Age (≤64 vs. 65+) | 168.5 (3.6–333.3) | 0.368 (0.294) | 0.046 |
| Pre-surgery bone volume | 0.162 (0.043–0.280) | 0.467 (0.337) | 0.009 |
| Maxilla vs. mandible | 209.4 (51.7–367.1) | 0.457 (0.209) | 0.011 |
| Anterior vs. posterior | 161.7 (−15.2–338.6) | 0.334 (0.230) | 0.072 |
4 DISCUSSION
Since the introduction of implants in the field of dentistry, surgical bone augmentation has gained popularity due to its relatively high success rates as a treatment option for aiding the replacement of missing teeth with implants in edentulous sites or bone ridges. The current retrospective study evaluated the success of lateral ridge augmentation in regeneration of bone by retrospectively reviewing the charts and corresponding documentation of patients treated at the UBC Graduate Periodontics Clinic. We specifically evaluated the amount of bone gain by comparing 2D linear measurements and 3D volumetric bone measurements in the CBCT images taken pre- and post-surgery. Significant mean bone gain was achieved after the surgery at all three locations of the grafted sites (central, mesial, and distal). Horizontal bone gain (linear measurements) ranged from 1.5 to 2.5 mm and volumetric bone gain between 250 and 750 mm3.
Previous studies reported a direct association between implant success rates and the gained bone volume. Assessing the success of bone augmentation using CBCT has been reported in the literature by others over the past few years. Bone width has been assessed using CBCT for treatments performed with bone blocks,14, 15 and using autogenous bone16, 17 or autogenous tooth roots.18 Basma and colleagues showed that larger bone particles used during augmentation surgery resulted in a larger increase in bone thickness at the surgical site.19 Igalsias-Velazquez and colleagues demonstrated no difference in bone gain for a plasma-rich grow factor conglomerate compared to standard guided bone regeneration techniques.20 Kakar and colleagues showed an increase in bone in patients treated with a subperiosteal tunneling techniques in the mandibular alveolar ridge,21 while Deepika-Penmetsa and colleagues used a cortical lamina technique to produce a mean 3.1 mm increase in bone.22 Wang and colleagues observed significant increase in bone regeneration for a digital workflow compared with conventional workflow.23 The amount of bone growth observed in our study is consistent with published values and for the majority of patients, this gain fulfills the target of ensuring the bone width reaching a minimum of 2 mm necessary to enable a successful implant placement.
Prior to the introduction of CBCT to dentistry, panoramic radiographs were primarily used as a diagnostic tool for assessing anatomical landmarks.3, 24 However, the use of panoramic radiographs in implant dentistry has substantial limitations due to the superposition of structures in the images, leading to overestimation of the measured distances in the images.25 Several studies investigated the accuracy of 2D and 3D CBCT measurements and found that there was only approximately 1 mm mean discrepancy between the CBCT measurements and clinical measurements.26 Others have come to similar conclusions, with no significant difference between the measured and actual distances reported in images observed in cadaver heads27, 28 and slight overestimation of measured values in pig mandibles.29, 30 We expect that the measured values in the current study are accurate at a sub-voxel level (<0.18 mm), but any additional error may come from picking a slightly different part of the landmark. In the current study, a standardized approach was utilized to measure and compare two sets of CBCT images (before and after bone grafting surgical procedures). In addition, linear measurements were performed for the pre- and post-surgery images on five vertical points within an inter-distance of 1.8 mm between consecutive points and on three horizontal locations (central, mesial, and distal) with a 1 mm distance between them, generating a total of 30 individual linear measurements per case. In addition, two sets of volumetric measurements were acquired to indicate the pre- and post-surgery bone volumes. Given there was a total of 30 bone grafting cases, overall, we had a total of 32 individual measures per patient (three sites each consisting of five vertical linear measures and two volumetric pre- and post-surgery measurements). Similar trends in bone gain were identified when comparing pre- and post-surgery linear or volumetric measures, suggesting good accuracy in our measurements.
Limitations of this study include the acquisition parameters and patient population. As this was a retrospective study, the information in the charts may differ between patients or information may be entered into different fields, making patient selection more challenging. The image acquisition parameters (kVp, mA, field of view, resolution) did vary between patients, and even between imaging sessions for the same patient. Changing acquisition parameters can impact how the different tissues are visualized within the image, but in this study, all desired landmarks were adequately captured within the field of view and readily identified. A prospective study would be able to remove these sources of potential variability by obtaining the CBCT images using the same acquisition parameters and recording the same patient information at each visit.
5 CONCLUSIONS
After the lateral ridge augmentation surgery, there was a substantial variation in bone gain between patients ranging from 1.5 to 2.5 mm gain in horizontal bone width, and between 250 and 750 mm3 for gain in volumetric bone volume. In addition, there were 2 out of 30 patients who did not gain any bone after the surgery. We confirmed that quantitative CBCT imaging is a reliable technique for measuring both 2-dimensional and 3-dimensional bone parameters in images acquired before and after the lateral ridge augmentation surgeries. Our study suggests that lateral ridge augmentation prior to implant placement performed by periodontics specialty residents at the UBC graduate periodontics clinic was effective in most cases to increase bone width and volume.
AUTHOR CONTRIBUTIONS
Study design: Amir H. Mossadegh, Nancy L. Ford, Siddharth R. Vora, and Jolanta Aleksejuniene. Data collection and analysis: Amir H. Mossadegh, Nancy L. Ford, and Jolanta Aleksejuniene. Manuscript preparation: Nancy L. Ford and Amir H. Mossadegh. Manuscript revision: Nancy L. Ford and Jolanta Aleksejuniene.
ACKNOWLEDGMENTS
The authors acknowledge the UBC Faculty of Dentistry for access to the patient database, and funding from the UBC Faculty of Dentistry Graduate Research Fund. Data analysis was done using software at the Centre for High-Throughput Phenogenomics at the University of British Columbia, a facility supported by the Canada Foundation for Innovation, British Columbia Knowledge Development Foundation, and the University of British Columbia, Faculty of Dentistry.
CONFLICT OF INTEREST STATEMENT
The authors declare no conflicts of interest.
Open Research
DATA AVAILABILITY STATEMENT
The data that support the findings of this study are available on request from the corresponding author. The data are not publicly available due to privacy or ethical restrictions.


