Exploring Effects of Ecological Visual Analytics Interfaces on Experts' and Novices' Decision-Making Processes: A Case Study in Air Traffic Control
Abstract
Operational demands in safety-critical systems impose a risk of failure to the operators especially during urgent situations. Operators of safety-critical systems learn to make decisions effectively throughout extensive training programs and many years of experience. In the domain of air traffic control, expensive training with high dropout rates calls for research to enhance novices' ability to detect and resolve conflicts in the airspace. While previous researchers have mostly focused on redesigning training instructions and programs, the current paper explores possible benefits of novel visual representations to improve novices' understanding of the situations as well as their decision-making process. We conduct an experimental evaluation study testing two ecological visual analytics interfaces, developed in a previous study, as support systems to facilitate novice decision-making. The main contribution of this paper is threefold. First, we describe the application of an ecological interface design approach to the development of two visual analytics interfaces. Second, we perform a human-in-the-loop experiment with forty-five novices within a simplified air traffic control simulation environment. Third, by performing an expert-novice comparison we investigate the extent to which effects of the proposed interfaces can be attributed to the subjects' expertise. The results show that the proposed ecological visual analytics interfaces improved novices' understanding of the information about conflicts as well as their problem-solving performance. Further, the results show that the beneficial effects of the proposed interfaces were more attributable to the visual representations than the users' expertise.
1. Introduction
Detecting and resolving aircraft conflicts is one of the most critical tasks of Air Traffic Control (ATC). Performance of such tasks involves a deep understanding of the complex and highly dynamic three-dimensional spatial relationships between aircraft. Air Traffic Controllers (ATCo) develop strategies for dealing with conflict situations based on their mental picture of the current and future traffic situations [Fal82, WJ82]. An ATCos' mental picture is described as a cognitive map of reality relying on their perception of spatial relationships between aircraft [MK13]. Such mental pictures are shaped through years of practice and experience and can help them form a mental model pertaining to the safety-critical system they work with. For novice operators, such as ATCos in training, who have not yet formed a reliable mental picture, Conflict Detection and Resolution (CD&R) tasks are presumed even more challenging. In fact, research has shown that novices, who have not yet acquired high-level expertise and knowledge, struggle to construct a functioning mental model of complex situations [GTS10, LBW19]. Further, it takes time for novices to build up their mental models, their expertise and ability required to manage unanticipated events, in some domains more than ten years [EKTR93, FAA13].
While visualization and carefully crafted visual interfaces can play an important role in externalizing complex relations and assisting in the mental model formation process [LS10], the ATC domain has seen limited advances in this aspect. Current ATC interfaces focus primarily on displaying horizontal relations and do not support visualization of vertical relationships between aircraft in conflicting situations. Moreover, they suffer from a low level of visualising what-if and what-else constraints which are crucial to the dynamic nature of conflict situations. Consequently, current ATC interfaces cannot effectively aid operators in developing an accurate mental picture of traffic, especially during urgent situations. Supporting productive thinking through enhanced interactive visual representations can expedite this process especially for novices' training.
To address the cognitive task limitation of ATC interfaces, in a previous study, we proposed two Visual Analytics (VA) interfaces [ZWLY22] especially designed for performing CD&R tasks in ATC and evaluated them through a user-based experiment with domain experts. The proposed interfaces visualize occupied flight level (FL) and allow ATCos to analyze conflict situations in realtime on what-if trajectories. Moreover, a glyph-based visualization was applied, enabling ATCos to visualize and compare multidimensional information about solution spaces for all conflicts simultaneously (what-else solution constraints).
The design of the proposed VA interfaces was conducted based on an in-depth Work Domain Analysis (WDA) within the Ecological Interface Design (EID) framework. The advantage of WDA is that it reveals the structure underlying a complex problem enabling a user to build decision-making strategies in compliance with the system's operational goals [Nai13, BH17]. Relying on WDA, EID-based interfaces facilitate data extraction for users aiming to support productive thinking especially during complex and unfamiliar situations [BFE14]. By visualizing the constraints of the environment and their relationships, EID-based interfaces can enhance understanding of the domain complexities. The main contribution of our initial study was the design and validation of the visual encodings. The focus was on describing the visual items composing the systems and testing them with experts. Thus, the EID process and WDA details were not described in that paper. However, there was a positive effect observed of the VA interfaces on ATCos' decision-making which raised interest concerning their possible benefit to shaping novices' behaviour and was primarily attributed to the inherent characteristics of the EID methodology used for their design. This became the motivation for this second study and the reason why WDA is explicitly highlighted in this work.
To this end, this work describes the application of EID notions to two VA interfaces tailored for conflict handling in the ATC domain and, through a user-based experiment, explores their role and possible benefits in improving novices' understanding of conflict situations and their decision-making process for resolving them. The concrete contributions of this paper are as follows. First, we describe the WDA applied to analyze ATC CD&R and how relations and constraints were encoded in our ecological VA interfaces, to make them candidates for shaping novices' behaviour. Second, through a human-in-the-loop experiment, we assess the effects of these VA interfaces on shaping the behaviour of novices. Third, by conducting an expert-novice comparison study, we investigate the extent to which the success or failure of task accomplishments and the decision-making process are attributed to users' expertise or to the characteristics of the designed interfaces.
2. Related work
Previous research has shown that visualizing the underlying structure of a system improves the information flow between novices and systems, which can facilitate the creation of a mental model for them. In the field of visualization, various task abstraction techniques have been defined to create a coherent information flow between novices and complex systems. Most of these techniques are hierarchical, representing larger tasks as a sequence of smaller tasks [Sta00, GZ09, SSL∗11]. Amar et al. [AES05] proposed ten low-level visual analysis tasks derived from novice activities on a variety of data from various domains. Brehmer and Munzner [BM13], introduced a multi-level abstraction typology whichtranslated domain-specific tasks into interdependent visualization tasks. Building upon that, Munzner [Mun14] introduces a typology where tasks as actions are differentiated from targets (a set of items on which, actions are performed). A common weakness of the models mentioned above is that in the domain characterization step, none of the models describe criteria for defining tasks correctly [Mar17]. Another limitation of these models is that if tasks are ill-defined, the resulting system may work improperly [Mar17]. In this paper, we therefore use Work Domain Analysis (WDA), as an approach to map ATC-specific tasks to what users need to perform on the interface. The benefit of WDA is that, instead of focusing on the users' behavior, it focuses on the constraints imposed by the environment on them. This makes the analysis (and thus the resulting interfaces) independent of specific end users and tasks.
WDA is described as “the functional structure of the environment of actors” [Nai13] and was designed for detailed modeling of large complex systems. By defining the constraints, the technique offers a way of understanding the rationale for operators' behaviour. The WDA technique has been used for the development of EID-based interfaces in various applications, such as improving energy efficiency monitoring [HJ07, HJ14], railway driving performance [RBS∗21], road [BMM19] and maritime [VDMvP06, MBRT09, FSR18] traffic management, medical engineering [KB05, MFE12, LBK14], aviation [AMVPF05, BSMVP06, VDMVP08, BSM∗08, BMVP10, EVVD∗11, EBvPM13] and ATC [LCVPM11, KBMP14, MVBE∗15, BBE∗15, BBVPM17, EBP18]. Beyond interface design, WDA is widely used to systematically arrange large amounts of data enabling the analyst to effectively identify gaps and actions needed to resolve interface issues [MBG∗00, MSW∗00, Xu05]. It has been used to assess pilots' mental models in pilot-automation interaction [Xu05]; building mental models in training [Xu07]; and to support decision-making and process-control in the design of industrial training simulators [Hil07, Hil12, SAN19].
In the domain of ATC, Borst et al. [BVVPM16, BVVPM19] explored short term training effects of an EID-based solution space diagram concept on novices' knowledge development and performance in CD&R tasks. It was however limited to horizontal solution spaces and heading (HDG) clearances. In contrast, our interfaces visualize both horizontal and vertical solution spaces and in the experiment the control dimensions were not limited to the horizontal plane. This is the information that is not visualized on current ATC interfaces or on EID-based interfaces proposed previously. Moreover, this paper particularly focuses on exploring novices' improvements in understanding vertical spatial situations.
3. Applying WDA to VA interface development
This section describes the work domain analysis that was applied to ATC CD&R tasks as well as how the findings were mapped to three structural layers of the interface, and to the interface elements in the ecological VA interfaces. This step was not in focus and so not described in our initial publication [ZWLY22].
3.1. Work domain analysis of CD&R in ATC
WDA was applied to reveal the functional structure of ATC work when dealing with conflict situations. The application of WDA resulted in a hierarchical knowledge representation of CD&R tasks in the ATC domain composed of five functional levels, seen in Figure 1. By modeling the ATCos' work tasks in this manner, the constraints imposed on them during their work and the relationships (links) between these constraints could be revealed.
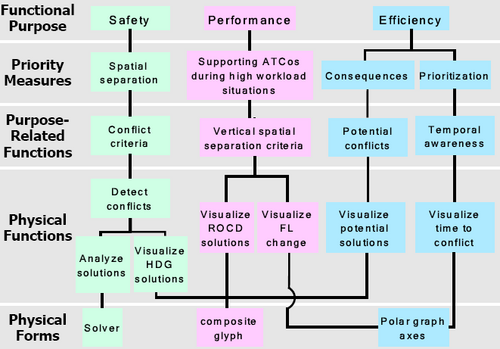
Functional layers of the ATC domain connected by means-end links. Coloured boxes represent priority measures, system functions and physical functions to meet goals of safety (green), efficiency (blue) and performance (pink). For clarity we have only included the aspects of the work domain that are most central to CD&R and that are implemented in the novel representations.
The “functional purpose” level describes the goals of ATC. The primary purpose of ATC is safety, which is maintained by separating aircraft with 5 nm lateral and 3 nm vertical distance. The additional objectives of particular focus in the current design are to improve users' efficiency and performance in CD&R.
The “priority measures” level presents the high-level values in ATC. These measures were identified through exploring the criteria which can be used to evaluate how well the system is fulfilling its functional purposes. To maintain safety, rules for spatial separation in ATC were followed. To strengthen performance, supporting ATCos during high workload situations was identified as a value measure. To meet the goal of efficiency, two priority measures were defined, namely, prioritizing conflicts resolution, and considering consequences of various resolution strategies. The motivation behind the aforementioned choice of measures is as follows. First, ATCos' improved temporal awareness leads to improved task prioritization resulting in decreased workload and improved efficiency [RL05, FN08]. Second, high rates of information flow on irrelevant detected conflicts and low level of “what-if” probe functionalities in current conflict detection tools can result in high workload for tactical controllers [BRA16], decreasing their efficiency.
The “purpose-related functions” level depicts the functions that the system must support so it can satisfy the priority measures and fulfill the functional purposes. To assure safe separation, conflict criteria must be derived. To support ATCos in high workload situations, determining vertical separation criteria (solution criteria to altitude and rate of climb or descent (ROCD) change) was identified as the important purpose-related function, motivated by thefollowing. First, studies have shown vertical separation requires less monitoring effort for ATCos. Thus, changing aircraft FL (as opposed to HDG and speed) is ATCos' preferred resolution strategy especially during urgent climb-descent conflicts [RN05]. Second, EUROCONTROL, identified a specific incident type in ATC, known as “Blind Spot” with a highly severe loss of separation. [BLCS14]. The incident usually occurs after an incorrect climb or descent clearance. In line with this, ATCos who participated in the study of [ZWLY20], requested a representation which provides insight about ROCD conflict criteria. To prioritize conflicts, temporal awareness regarding conflicts' urgency level should be increased. To determine the consequences of decisions, awareness regarding the criteria to avoid potential conflicts should be increased.
The “physical functions” level depicts the specific functionality afforded by interface objects. To find the conflict criteria, the interface should have functional units which could 1) detect in-conflict pairs, 2) solve conflict equations between aircraft pairs and recalculate upon state changes, and 3) visualize the criteria to resolve conflicts (done mostly via HDG change). To determine vertical spatial criteria, the interface should 4) visualize FL change and 5) ROCD solution space. To increase awareness regarding conflicts urgency and potential conflicts, the interface should 6) visualize time remaining to conflict, and 7) solution space for potential conflicts.
3.2. Derivation of the visual components
The fifth level of the functional layer hierarchy (Fig. 1) depicts “physical forms” of the system. For interface design purposes, this level corresponds to the visual items of an interface. Accordingly, the VA interfaces of this study were decomposed into three levels as depicted in Figure 2. The figure shows how the interfaces' structural properties are visualized at finer levels of detail when moving from layer 1 to layer 3. Each of the functional units derived from the functional layer hierarchy is assigned to one or more visualization components in the system. One goal may be achieved by several components. Therefore, block colors represent the main system goal that the corresponding component is designed to satisfy. For example, all of the components that visualize a solution space criteria satisfy the goal of safety. However, visualization of vertical solutions primarily supports operators' performance.
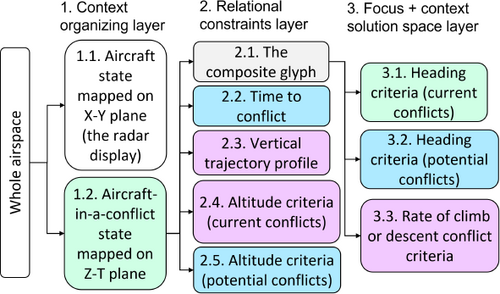
Structural property decomposition of the VA interfaces.
Figure 3 depicts a schematic representation of one of the proposed VA interfaces called, Angular Time-line Visualization (ATL-Viz). The visualization components are designed in compliance with the interface's structural property decomposition and the numbers on each item correspond to the numbers in Figure 2. The “context organizing” layer decomposes the airspace information into two contexts: aircraft states as mapped on X-Y plane (1.1) and a conflict-centric context, where information only for aircraft in conflict are visualized on the time-altitude display (1.2). The “relational constraints” layer assigns the “physical functions” level units (Fig. 1) to five components. Glyphs (2.1) represent aircraft in conflict. The angular and radial axes of the polar graph respectively are used to map time remaining to conflict (2.2) and aircraft vertical profile (2.3). Altitude conflict criteria (2.4) is shown with the same color as the aircraft vertical profile. Altitude criteria for potential conflict (2.5) is shown in grey (i.e. if aircraft M is sent to FL340, the conflict with N is resolved, but a conflict with P will be created). The “Focus+context” solution space layer directs users' focus to solution spaces visualized inside the glyph and is shown upon hovering the mouse over the aircraft icon. HDG criteria for current (3.1) and potential (3.2) conflicts as well as ROCD conflict criteria (3.3) are shown. The second VA interface, called RADial time visualization (RAD-Viz), follows the same structural components as ATL-Viz. However, on RAD-Viz, time and altitude information are mapped on inverted axes of the polar graph. Therefore, glyphs are positioned differently. A detailed description of ATL-Viz and RAD-Viz can be found in the supplementary material.
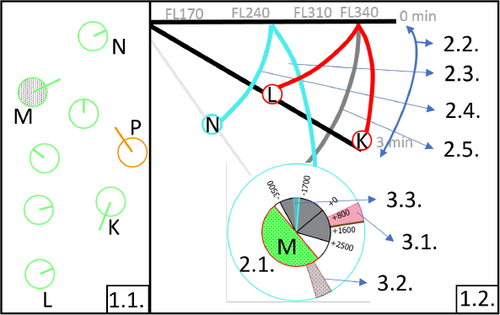
ATL-Viz consists of a radar screen (1.1) and the time-altitude display (1.2). Numbered visual items correspond to the structural properties (Fig. 2) obtained from the functional layers of Fig. 1. As can be seen, K and L will lose separation in 3 min. at FL310. M and N will lose separation at FL240. M is selected, thus its composite glyph is shown. If M is sent to FL340 or its HDG is changed to the patterned section (3.2), it will have conflict with P.
3.3. Task support in Traditional ATC interfaces
The CD&R tools in currently used ATC interfaces contain a radar screen to the left and a conflict and risk display (CARD) to the right. On the CARD, aircraft in conflict are detected and their call-signs are shown inside moving text labels. The labels are drawn on a graph, where time remaining to and distance at the separation loss are mapped on x and y axes (see Fig. 2 in [LSJ∗15]). Among the physical functions derived (Fig. 1), only “detect in-conflict pairs” is supported by current ATC interfaces which is visualized in form of these labels. A simplified simulated version of the current ATC interfaces was used in the experiment as the control condition.
4. Experimental design
In this paper, we conduct an expert-novice comparison to investigate the extent to which ATL-Viz and RAD-Viz effects are attributed to the users' domain expertise. To achieve this, we first replicated the evaluation study we conducted in our previous paper [ZWLY22], this time on novice users and subsequently compared the results of the two experiments. The experiment consisted of three parts: (1) a training session, (2) Study I to assess participants' effectiveness in understanding the information, and (3) Study II where the participants worked with the VA interfaces.
4.1. Research goals
By representing the domain work structure on a display, EID-based interfaces aim to create an “externalized mental model” of the complex system for the user [VR90], enabling them to understand and solve complex tasks. With this as a starting point, our main goal in this study was to explore whether the two VA interfaces, ATL-Viz and RAD-Viz, would enable novices to understand the relationship between aircraft in conflict and perform CD&R tasks. The following hypotheses were postulated:
- H1: The VA interfaces improve novices' effectiveness in understanding the relationship between aircraft in conflict.
- H2: The VA interfaces facilitate novices' decision-making.
- H3: Different ways of visualizing the same information about aircraft in conflict, mainly the temporal domain, affect novices' efficiency and performance in resolving conflicts.
- H4: The beneficial effects of the VA interfaces are attributed to the visual representations rather than the users' expertise.
4.2. Participants
Forty five students at Linköping University with backgrounds in various fields of science and engineering participated in the study. Two groups were formed and each group worked with one VA interface. Participants of the ATL-Viz group had an average age of 24.6 (SD = 3.23) and participants of the RAD-Viz group had an average age of 24.9 (SD = 3.45). The participants had no prior knowledge in ATC, and had not seen the VA interfaces previously.
4.3. Training session
All participants participated in a training session pre-recorded by the first author in form of a PowerPoint slideshow. The slide show began with video clips explaining: the ATC environment, how aircraft may enter in conflict with each other, how conflicts can be resolved, how information is visualized on the traditional ATC interface and on the proposed VA interfaces (ATL-Viz or RAD-Viz). Then a set of interactive slides containing seventeen multiple choice questions were displayed. The questions covered all visualization elements of the two interfaces introduced in the videos. A clickable button was available on each slide to give the participant the opportunity to watch a particular part of the video again and learn the concept. Once all questions were answered correctly, an embedded video explained the interactive features of the designed VA interface and the procedure to perform the main study. The video ended with instructing the participant how to run the study file. The PowerPoint slideshow generated a log file of the participant's interaction with the slides. The log files recorded times for participants' interactions and their answers, which were later analyzed. All participants completed the training sessions successfully.
4.4. Study I: Understanding conflicts
An essential aspect of the decision-making process is to understand and interpret the information accurately. To evaluate whether the VA interfaces can support novices in understanding the relationship between conflicts, a questionnaire containing ten questions was designed based on the exploratory spatiotemporal data analysis model of Andrienko et al. [AA06]. Five elementary tasks were designed to evaluate novices' understanding of individual elements of the visualization systems. Five synoptic tasks were designed to evaluate the role a whole set or subset of the visualization systems plays in giving a general insight about the situation to the user. T1 (elementary look up) aimed at evaluating how novices find the information about the FL at which two aircraft in conflict will lose separation. T2 (elementary comparison direct) and T3 (elementary comparison reverse) aimed at evaluating how participants determine vertical relations between aircraft in conflict. T4 and T5 aimed at evaluating how participants perform synoptic relation-seeking tasks on the glyph subset of the interfaces. i.e. understanding ROCD and HDG information leading to successful determination of conflict geometries. T6 (elementary comparison direct) and T7 (elementary comparison reverse) aimed at evaluating how participants determine temporal relations between aircraft in conflict. T8 (synoptic pattern identification) aimed at evaluating how participants identify and compare traffic patterns (density of aircraft in conflict) simultaneously on multiple elements (FL and time) of the interfaces. T9 (synoptic behaviour comparison) aimed at evaluating how fast participants learn and compare a particular aircraft characteristic (rate of climb). T10 (synoptic relation-seeking) aimed at evaluating how participants search for occurrence of a specified relation between specific characteristics of the aircraft in conflict. i.e. T10 asked participants to find an aircraft which required the largest HDG change (most deviation from the track) to have the conflict resolved. Considering the task types and the fact that novices needed to simultaneously compare all aircraft in conflict with each other, T8, T9 and T10 were the most difficult tasks to perform.
Study I was a mixed study design with two independent variables: 1. the VA interface (ATL-Viz or RAD-Viz) varied between participants, and 2. the display condition (control condition vs. VA interface) varied within participants. Thus, each participant performed each questionnaire task twice (20 questions in total); i.e. for a sample traffic situation visualized once on the control condition and once on their assigned VA interface (ATL-Viz or RAD-Viz).
4.5. Study II: CD&R on simulated scenarios
In Study II a simulation study was conducted to evaluate how novices' decision-making process was affected by the VA interfaces. Two traffic scenarios with varying traffic complexity (density of aircraft) were designed. The low- and high-traffic complexity scenarios contained 10 and 17 aircraft in single sector respectively. Both scenarios contained the same number of aircraft in conflictwith the same conflict geometries. Figure 4 depicts the designed conflict geometries and highlights differences between ATL-Viz and the control display in visualizing the conflicts. To determine the conflict geometry correctly, novices need to understand the aircraft flight phase (cruise, climb or descent) and whether aircraft are flying head-on or catch-up. To perceive such information on the ATL-Viz (likewise on the RAD-Viz), novices needed to understand the HDG information (from the outer circle of the glyph) and imagine the aircraft position in 2D correctly. For ROCD information, they could easily read values from the inner circle of the glyph. On the control display however, both aircraft relative position in 2D and flight phase on the label are explicitly shown. However, to determine solution spaces no information is shown on the control condition, requiring novices to either calculate or try out various options until the conflict label is eliminated from the CARD (indicating resolving the conflict). In contrast, on ATL-Viz and RAD-Viz, the solution spaces are explicitly visualized. Aircraft movement were simulated by linear kinematic equations and the solution spaces to conflicts were obtained from the equations presented in [ZWLY20].

Designed conflict geometries and their visualizations on ATL-Viz (top) and the control condition (bottom). (A) Head-on. (B) Catchup. (C) Crossing. (D) Head-on + distance bias. (E) Catch-up + distance bias. The green line on the glyph's outer circle and the colored line on the inner circle indicate aircraft current HDG and ROCD.
Study II was a mixed study design and contained three independent variables. 1. The VA interface varied between participants. 2. The complexity of traffic scenarios (two levels, i.e. low and high density traffic), and 3. the display condition (control display vs. the VA interface tested) varied within participants. Each participant worked with each scenario once on the control display and once on the VA interface. The order of appearance of scenarios and display conditions varied within participants. To prevent recognition of similar traffic patterns on the radar screen, traffic scenarios were rotated for different display conditions.
4.6. Dependent measures
A set of dependent measures were defined to assess the analysis goals of each study (Table 1).
| Study | Analysis goal | Defined measures |
|---|---|---|
| I | Effectiveness in understanding the information | Task completion time |
| Error rate | ||
| II | Interaction comparison | Nr. of clicks on radar screen |
| Nr. conflicts resolved on radar screen | ||
| Time to first interaction | ||
| Effectiveness in decision-making | Nr. of conflicts ignored | |
| Decision making duration | ||
| Time to accomplish CDR tasks | ||
| Resolution strategy | ||
| Workload | ||
| Task prioritization | Conflict resolution order | |
| Glyph usefulness | Mouse hover duration | |
| Nr. of ROCD/HDG resolutions on radar screen |
To analyze effectiveness of understanding the information (Study I), time to complete tasks and average error rate (number of participants who answered wrongly) were defined as measures. While, to analyze the decision-making process (Study II), we defined a number of measures to study the VA interfaces' abilities in improving novices' interaction, effectiveness in decision-making, task prioritization, and the usefulness of novel glyph design concepts.
To analyze and compare interaction effects of the interfaces on novices' behaviour, four measures were defined. Number of clicks regarding conflicts on the radar screen was measured to compare the VA interfaces' usefulness in conducting CD&R tasks. Number of conflicts resolved on the radar screen was measured to analyze the interfaces' usefulness in applying decisions. Interaction with the screens and implementing a decision was only possible on the radar screen, ATL-Viz and RAD-Viz. Since the radar screen was available in all display conditions, it was expected that the novices' mouse click activities on the radar screen decreased when working with the VA interfaces. Time to first interaction was measured to compare VA interfaces and the control display ability in encouraging users to engage in interaction with the interfaces.
To evaluate novices' effectiveness in decision-making, decision-making duration, Number of conflicts ignored, Time to accomplish CD&R tasks, resolution strategy and workload were measured. Decision-making duration was measured as the time it took for each participant to resolve each individual conflict. Since conflicts were not resolved in the same order by all participants, decision-making duration for each conflict was measured from the time the previous conflict was resolved. For the first resolved conflict, the time was measured from the beginning of the scenario. To be able to compare decision making duration, the simulation study prevented participants from moving to the next part without resolving all conflicts in the running part. However, participants' attempt to move to the next scenario without having all conflicts resolved was logged in the data. Conflicts remaining unresolved during these attempts were considered as ignored. Time to accomplish CD&R tasks was measured to analyze the extent to which VA interfaces improve novices' efficiency in accomplishing CD&R tasks. The time when the last remaining conflict was resolved was considered as time to have CD&R tasks accomplished. To evaluate workload, we collected interval data of users' workload ratings given within the range of 1 (lowest) to 100 (highest).
To evaluate novices' task prioritization, we analyzed the order of solving conflicts and to evaluate glyph usefulness the mouse hover duration over the glyphs was analyzed. In addition we analyzed whether or not the glyph was used to apply ROCD or HDG resolution strategies.
4.7. Procedure
The experiment was conducted during the COVID-19 pandemic. Restrictions prevented the experimenter from holding physical meetings with participants. Therefore study materials were sent to the participants via email and participants used their personal computers to participate in the study. The study began with a training session (as described in Section 4.3). The following parts of the experiment were implemented in python and integrated into a single executable file by the first author. A familiarisation session where the participants worked with the control display and one of the VA interfaces (depending on their group). A list of tasks was displayed one at a time, persuading participants to try various resolution strategies. Upon finishing all tasks on both displays, the Study I questionnaire was run. Then the Study II simulation session was run where the participants resolved conflicts in four scenarios (low and high complexity on each display condition). At the end of each scenario, they needed to rate the workload they experienced on a 1 to 100 scale. Participants were asked to run the study right after finishing the training session. The generated log files were sent back to the first author for analysis.
4.8. Data Exploration and outlier analysis
An outlier analysis was performed on all dependent measures by calculating the z-score (z = (x — μ)/σ, where x is the value of any data point, μ is the mean value and σ is the standard deviation) of all data points. With a particular focus on time-based dependent measures (questionnaire all tasks completion time, questionnaire individual tasks completion time, time to resolve all conflicts and decision-making duration for each individual conflict), a data point lying outside +/- 2σ was considered an outlier. Four novices of the RAD-Viz group and three novices of ATL-Viz group were considered as outliers based on their slow performance in performing questionnaire tasks and resolving conflicts. Therefore, the data for these seven participants were omitted.
4.9. Data analysis
The assumptions of normality of data distribution were tested on all dependent measures using Q-Q plots, Shapiro-Wilk test, skew and kurtosis tests. All dependent measures satisfied normality assumptions for the control conditions of the two groups. However, we decided to perform non-parametric statistical tests for three reasons. First, for ATL-Viz and RAD-Viz conditions Shapiro-Wilk normality was satisfied only for decision-making duration. Second, due to the outcome of the outlier analysis, the number of novices was reduced. Third, due to the relatively low number of ATCos in the previous expert study and outliers in the data, non-parametric statistical tests seemed more reliable for expert-novice comparisons.
For Study I, we collected dichotomous data for accuracy (correct/incorrect) and ratio data for completion time. We conducted Wilcoxon Signed Rank test for the 2 (Vis: ATL-Viz or RAD-Viz vs. control condition) x 10 (Tasks) within-novices evaluation. Mann-Whitney U test was performed to compare how novices in different visualization groups (ATL-Viz and RAD-Viz) responded to the questionnaire. Appendix 1 details the statistical results of Study I.
For Study II, Friedman's non-parametric ANOVA was used to determine within-novices effects of display conditions on dependent measures of the type ratio (time to engage in interaction, time to resolve conflict), interval (number of clicks regarding conflicts on radar screen, number of conflicts resolved on radar screen, number of conflicts resolved in the order of urgency, number of ROCD&HDG resolutions on radar screen) and ordinal (workload) data. To analyze nominal data of resolution strategies within novices, Fisher's exact test was used. Mann-Whitney U test was used to perform two comparisons i.e. to compare the effect of (a) ATL-Viz and RAD-Viz display conditions and (b) the two control conditions on decision-making measures between the two novices groups. Appendix 2 details the comparison results of Study II.
To compare effects of display conditions between ATCos and novices, two Mann-Whitney U comparisons were made on Study I and Study II dependent measures respectively. Comparisons were made for each scenario (low and high complexity) on each individual display condition (ATL-Viz, RAD-Viz, control conditions). Appendix 3 presents the results of these comparisons. Only significant results are reported for an alpha of 0.05. Dunn-Bonferroni post-hoc test was implemented whenever a significant effect was observed. All pairwise post-hoc tests were controlled for multiple comparisons and the analysis and conclusions obtained from the experiments were based on a consideration of all results combined, not results from a single statistical test.
There was no significant effect of scenario complexity on any of the dependent measures, so in the paper we only report the results for the high-complexity scenario. Detailed statistical results for all scenarios (low/high-complexity) are included in appendices 2, 3.
5. Results
In this section, we report the statistical results for each analysis goal defined per study (Table 1) in a separate section. Each section focuses on reporting within-participant comparisons for each ATL-Viz and RAD-Viz group. When comparing the results between ATL-Viz and RAD-Viz (see Table 3 in Appendix 1 and Table 5 in Appendix 2), a significant effect was found only for one measure: novices' time to first interaction with the display. Post-hoc tests supported the finding indicating that novices engaged in interaction with ATL-Viz significantly earlier (Mdn = 2.0, IQR = 1.2) than RAD-Viz (Mdn = 5.0, IQR = 2.0).
5.1. Effectiveness in understanding the information
The Wilcoxon Signed Rank test revealed a trend in support of the VA interfaces' ability to improve novices' effectiveness in understanding the relationship between aircraft in conflict. ATL-Viz novices accomplished questionnaire tasks significantly faster (p < .000) in the ATL-Viz condition (Mdn = 288.9, IQR = 198.4) compared to the control condition (Mdn = 456.7, IQR = 253.0). Similarly, RAD-Viz novices accomplished all tasks significantly faster (p < .000) in the RAD-Viz condition (Mdn = 265.0, IQR = 97.4) compared to the control condition (Mdn = 498.2, IQR = 212.2). Novices made significantly (p < .000) less number of errors in the ATL-Viz condition (Mdn = 1.5, IQR = 1.0) than in the control condition (Mdn = 5.0, IQR = 2.25). Similarly, RAD-Viz novices made significantly (p = .001) less number of errors in the RAD-Viz condition (Mdn = 1.0, IQR = 3.0) compared to the control condition (Mdn = 4.0, IQR = 2.75). No significant effect of display conditions was found between the ATL-Viz and RAD-Viz groups when comparing task completion time and average number of errors. Figures 5 and 6 compare novices' time to accomplish each individual task of the questionnaire and average error rate between all display conditions. All tasks, except for 4, 5, 6 and 7 were accomplished faster and more accurately in the VA interface conditions compared to the control conditions. Even though novices answered task 7 faster on the control conditions, most of them answered it incorrectly. When working with the control display, ATL-Viz novices answered tasks 4 and 5 faster and RAD-Viz novices answered these tasks more accurately. This indicates that novices understood conflict geometries easier when using the control displays in the control condition compared to the VA interfaces.
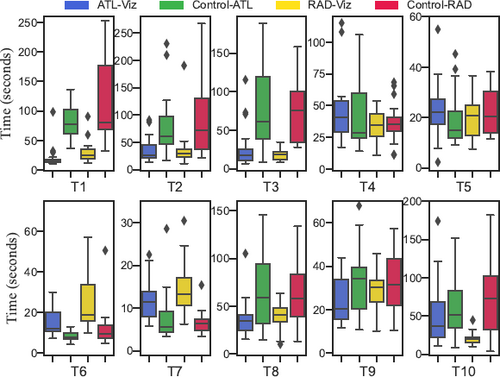
Study I task completion time in the control conditions
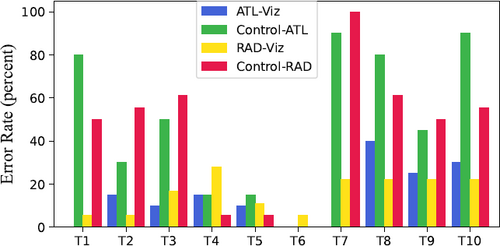
Study I average error rate (number of novices answered a question wrong) in different display conditions.
5.2. Interaction comparison
Novices made significantly less clicks regarding conflicts on the radar screen when working with ATL-Viz (χ2(3) = 43.63, p < . 000) and RAD-Viz (χ2(3) = 47.48, p < .000) compared to the control display. Similarly, novices resolved significantly less conflicts on the radar screen when working with ATL-Viz (χ2(3) = 54.0, p < .000) and RAD-Viz (χ2(3) = 50.65, p < .000). Both findings were supported by post-hoc tests. Novices' time to start interacting with the interface was significantly affected by the display conditions. Novices engaged in interacting with the interface significantly earlier in the ATL-Viz (χ2(3) = 50.7, p < .000) and RAD-Viz (χ2(3) = 28.0, p < .000) conditions than the control display. Pairwise comparisons supported the finding that novices' interaction was improved on the VA interfaces.
5.3. Effectiveness in decision-making
The statistical results revealed a trend in support of the VA interfaces' ability in enhancing novices' effectiveness in decision-making. Analyzing participants' attempt to move to the next scenario without solving all conflicts, showed a significant effect of ATL-Viz (χ2(3) = 22.6, p < .000) on novices' ability to detect all conflicts. Digging deeper into the data, we found that eight ATL-Viz novices and four RAD-Viz novices intended to skip solving the least imminent conflict (conflict E) when working with the control condition. None of these twelve novices intended to skip any conflict on the VA interface they worked with. Six of them intended to skip conflict E during both encounters with the control display (low and high complexity scenarios) while the others intended to skip conflict E only when working with the control display for the first time. When working with the VA interfaces neither novices nor ATCos intended to skip solving any of the conflicts except for one novice of the ATL-Viz group who intended to skip solving conflict D when working with ATL-Viz for the first time.
In the ATL-Viz group, novices' decision-making duration was significantly affected by the display conditions for conflicts B (χ2(3) = 16.2, p = .001), C (χ2(3) = 22.6, p < .000) and D (χ2(3) = 10.4, p = .02). Post-hoc tests confirmed a significant decrease in novices' decision-making duration when working with ATL-Viz than the control display. In the RAD-Viz group, no significant effect of display conditions was observed in decision-making duration for conflicts A and B. A significant effect was observed for conflicts C (χ2(3) = 23.0, p < .000) and D (χ2(3) = 8.14, p = .04). Post-hoc pairwise comparisons supported the findings indicating that novices' decision-making time reduced when working with RAD-Viz compared to the control condition.
Figure 7 compares novices' decision-making duration per conflict for each display condition: ATL-Viz, RAD-Viz and the two control conditions. As can be seen, in the ATL-Viz condition, novices spent less time to resolve all conflicts as compared to other display conditions. Novices' time to accomplish CD&R tasks improved significantly when working with ATL-Viz (χ2(3) = 30.7, p < .000) and RAD-Viz (χ2(3) = 19.12, p < .000) compared to the control displays. Post-hoc tests supported the finding. No significant effect of display conditions was found neither on the resolution strategies nor on the workload ratings.
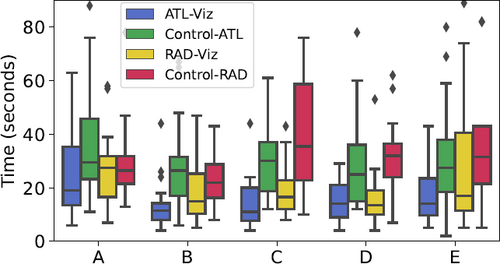
Novices' decision-making duration (as measured from the previous resolved conflict) in high complexity scenario.
5.4. Task prioritization
Figure 8 shows the order with which novices resolved conflicts on different interfaces. When working with the control display, RAD-Viz novices resolved conflicts based on the order of urgency (except for one who resolved conflicts C and D in a reverse order). Four ATL-Viz novices did not follow the order of urgency on the control display. A comparison between novices performance on ATL-Viz and the corresponding control display (Fig. 8 top left with top right), signifies that more novices followed the order of urgency on the ATL-Viz display. However, the contrary is true for RAD-Viz. The number of novices who did not follow the order of urgency increased from 1 on the control display to 6 on the RAD-Viz.
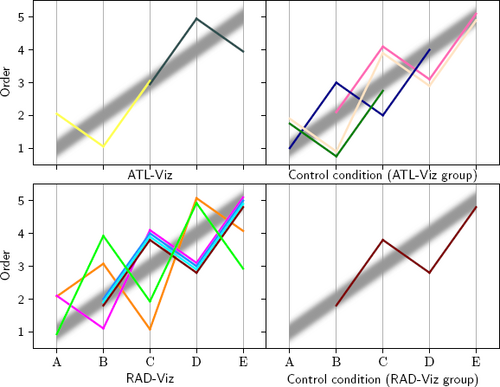
Novices' order of resolving conflicts on different interfaces. The thick grey line depicts novices who followed the order of urgency, coloured lines correspond to those who did not follow it.
5.5. Glyph design usefulness
Analyzing the number of ROCD & HDG resolutions made on the radar screen, a significant effect was found for both ATL-Viz (χ2(3) = 51.8, p < .000) and RAD-Viz (χ2(3) = 49.9, p < .000). Post-hoc tests indicated that significantly fewer ROCD & HDG resolutions were made on the radar screen when working with ATL-Viz (Mdn = 0, IQR = 0) compared to the control display (Mdn = 4, IQR = 2.2). Similarly, significantly fewer ROCD & HDG resolutions were made on the radar screen when working with RAD-Viz (Mdn = 0, IQR = 0) compared to the control display (Mdn = 4, IQR = 1.7). The results indicated that, even though the radar screen was available in both display conditions, novices used the glyph to apply their decision.
6. Results of expert-novice comparisons
This section compares the dependent measures between expert AT-Cos (obtained from the experiment conducted in our initial paper [ZWLY22]) and novices (as presented in Section 5). Comparisons were made between 20 novices and 7 ATCos in the ATL-Viz group, and 18 novices and 7 ATCos in the RAD-Viz group. Detailed statistical results can be found in Appendix 3. Figure 9 compares effectiveness measures for understanding the information (Study I) between ATCos and novices. For task completion time, Mann-Whitney U tests indicated a significant effect of expertise only in the RAD-Viz condition (U = 1.51, p = .003) where novices completed questionnaire tasks significantly faster (Mdn = 265.3, IQR = 97.4) compared to ATCos (Mdn = 453.3, IQR = 105.2). Figure 9 (right) shows that while the median is the same for novices and experts in the RAD-Viz condition, the variation among novices is large. ATCos' performance is more homogeneous. This indicates that novices' performance is more difficult to predict than ATCOs. Comparing error rate, a significant effect of expertise was found only in the ATL-Viz condition, where more novices (Mdn = 15.0, IQR = 10.0) than ATCos (Mdn = 0.0, IQR = 0.0) answered questions wrongly. Furthermore, Figure 9 (right) shows that novices' accuracy when working with ATL-Viz is more homogeneous than in other display conditions. In other display conditions, expertise had no significant effect on accuracy. While many novices completed the questionnaire faster than many ATCOs, novices also had a higher error rate than ATCOs. Overall, novices were faster to complete the tasks, but varied more in terms of accuracy. As depicted by the figure, when working with the VA interfaces, both novices and ATCos performed faster and more accurately compared to when working with the control display.
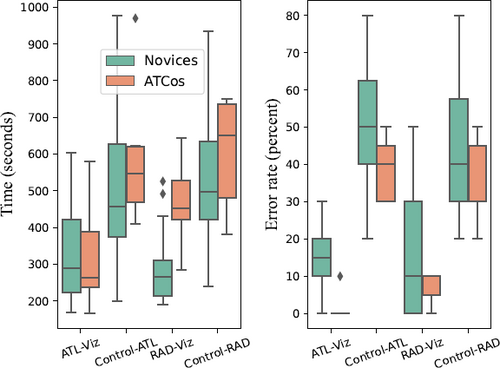
Comparison between novices' and ATCos' efficiency in understanding the information about conflicts (Study I) on ATL-Viz and RAD-Viz and the control display. Control-ATL and Control-RAD refer to the control condition in ATL-Viz and RAD-Viz groups.
A significant effect of expertise on workload was found only in the control condition of the RAD-Viz group. Mann-Whitney U tests indicated that novices experienced significantly (U = 7.30, p = .026) higher workload (Mdn = 69.0, IQR = 21.25) than experts (Mdn = 50.0, IQR = 32.5). Experts' less cognitive load experience could be due to their familiarity with the control display.
A significant effect of expertise was found on time to start interacting with the interface for the ATL-Viz condition (U = 3.04, p = .043). Post-hoc tests revealed that novices engaged in interaction with the interface significantly earlier (Mdn = 2.0, IQR = 1.25) than the experts (Mdn = 5.0, IQR = 3.5). Regarding time to accomplish CD&R tasks, a significant effect of expertise was found in all display conditions except for the control condition of the ATL-Viz group. Post-hoc tests supported the findings indicating that novices accomplished CD&R tasks significantly earlier than ATCos.
Regarding glyph design usefulness, a significant (U = 3.04, p = .003) effect of expertise was found on the number of ROCD and HDG resolutions made on the radar screen in the ATL-Viz condition. Novices made less (Mdn = 0.0, IQR = 0.0) ROCD and HDG resolutions on the radar screen than ATCos (Mdn = 0.0, IQR = 1.0). On the contrary, when working with the control displays, novices made more ROCD and HDG strategies compared to AT-Cos. Analysing total mouse hover duration over glyphs, a significant (U = 1.69, p = .008) and a marginally significant (U = 3.21, p = .06) effect of expertise was found in the RAD-Viz and the ATL-Viz conditions respectively. In both conditions novices mouse hovered over glyphs less (ATL-Viz: Mdn = 41.50, IQR = 28.25 & RAD-Viz: Mdn = 48.50, IQR = 40.5) than ATCos (ATL-Viz: Mdn = 54.0, IQR = 81.5 & RAD-Viz: Mdn = 112.0, IQR = 71.5).
7. Discussion and conclusion
In this study we presented how the WDA technique is applied to the design of VA interfaces for safety-critical systems, to show constraints and solutions. For the domain of ATC, we described how a WDA mapping of CD&R tasks led to the development of visual items on two previously designed VA interfaces; ATL-Viz and RAD-Viz. We investigated the effects of these interfaces on novices who were unbiased by visual representations on existing ATC systems. By further comparing the study results between novices and expert ATCos we investigated whether the success or failure of task accomplishments can be attributed to individuals' expertise or the characteristics of the designed VA interfaces.
Regarding the first hypothesis (H1), the results confirmed that the proposed VA interfaces improved novices' effectiveness in understanding the situations about aircraft in conflict. This is based on the finding that novices answered the questions about the conflict situations significantly faster and more accurately in the VA interface conditions than the control display. More specifically, the VA interfaces improved novices' understanding of complex conflict situations (answering T8, T9 and T10 faster and more accurately).
Regarding the second hypothesis (H2), we conclude that the proposed VA interfaces improved novices' decision-making process. First, the fact that 31% of novices initially missed detection of the least imminent conflict on the control display while they had detected and resolved all conflicts successfully on the VA interface they worked with, indicates that the linear visualization of time on the control display may jeopardize early detection of less imminent conflicts for novices. On the contrary, ATL-Viz and RAD-Viz encouraged novices to detect and resolve less imminent conflicts early. Second, the VA interfaces significantly improved novices' interaction, time to make a decision and time to accomplish CD&R tasks. This was reflected by all respective dependent measures.
Regarding the third hypothesis (H3), the following two findings showed that ATL-Viz improved novices' performance more effectively than RAD-Viz. First, comparing display effects on resolution time, novices spent the least amount of time on resolving conflicts when working with ATL-Viz compared to other displays. The fact that ATL-Viz novices resolved conflicts faster than RAD-Viz novices indicates that ATL-Viz expedites understanding the glyph information required to make a decision. Third, the finding that novices who did not resolve conflicts with the order of urgency on the control display, did follow the urgency order when working with ATL-Viz indicates that ATL-Viz encourages novices to resolve conflicts in relation to the urgency order. RAD-Viz on the contrary did not improve conflict resolution prioritization neither for novices nor for experts [ZWLY22]. These two findings confirm that visualization of time on the angular axis of the polar graph (implying a clock metaphor) improves novices' ability to prioritize CD&R tasks based on urgency. This finding is supported by [GT99], where subjects who developed good temporal awareness made fewer errors and prioritized their work more effectively.
Regarding the fourth hypothesis (H4), on the one hand, ATCos understood the information about conflicts on the VA interfaces more accurately (less errors) than novices even though they spent more time on performing the tasks. In addition, ATCos hovered the mouse on the glyphs longer than novices. This could be due to the fact that ATCos are likely to search, see, and/or interpret information in the glyphs differently from novices. ATCos may think of alternative solutions, weighing their options, before deciding. These two findings support the notion that the beneficial effects of the VA interfaces are attributed to the users' expertise. Four other findings, on the other hand, point in another direction. First, on the VA interfaces both ATCos' and novices' effectiveness in understanding the information improved compared to the control condition. Second, when applying ROCD/HDG resolutions, both ATCos and novices interacted with the glyph significantly more than the alternative option they had on the radar screen. Third, when working with the control condition, novices missed the detection of theleast imminent conflict while on the VA interfaces both novices and ATCos detected all conflicts successfully. Fourth, ATL-Viz encouraged novices to resolve conflicts in relation to urgency. This was not the case for RAD-Viz and the control condition. The latter finding shows that ATL-Viz encourages novices to behave like an expert in terms of detecting conflicts and prioritization of resolving them. Weighing together all the findings above, we conclude that the beneficial effects of the VA interfaces are more attributable to the visual representations rather than the users' expertise.
The fact that no significant effect of the proposed VA interfaces on the resolution strategies was found neither among novices nor experts, indicates that the designed VA interfaces do not promote a specific resolution type. This further confirms the nature of EID interfaces which are designed based on a functional model of the work domain rather than specific tasks performed by specific users as is common in other interface design methodologies.
Overall, the results suggest that the VA interfaces did improve novices' understanding of the conflict situations as well as their problem-solving performance. Comparing the two VA interfaces in this study, we conclude that the metaphoric visualization of time on ATL-Viz structures users' behaviour in task prioritization regardless of their expertise. Finally, based on the fact that ATL-Viz encouraged novices, with no prior knowledge in ATC, to detect and prioritize conflict resolutions like ATCos, we further conclude that the proposed VA interfaces support successful understanding of the complex situations for both experts and novices.
The potential value and generalizable contribution of our work to design of VA interfaces for other safety-critical systems can be found in three aspects. First, introducing the idea of applying WDA for mapping domain-specific process-related tasks (solution spaces) to interface functions is generalizable to VA design. Second, since ATC goals are similar to other safety-critical domains, most of the derived interface functionalities as well as the three structural decomposition layers of Figure 2 are transferable to other safety-critical domains (e.g. emergency response). Third, the finding that our interfaces improved novices' understanding of the information indicated that the designed ecological VA interfaces have the potential to be used for enhancing novices' understanding of a complex domain. We believe this finding takes the first step to train operators of safety-critical domains based on visualization design.
Our VA interfaces, built upon the WDA technique, visualize solutions based on the ATC work domain. Different ATCos however, have different tendencies in resolving conflicts. Thus, one future direction of our work is to help novices learn these strategies by adjusting suggestions of the interfaces depending on the ATCos' behaviour. Another future direction is to explore our VA interfaces effects on skill- and knowledge- acquisition; to see whether novices' learning is improved even after the interface support is removed.
Acknowledgments
We thank Anders Ynnerman with KAW Scholar Grant for his valuable contribution and support. We also thank Miriah Meyer for her helpful comments on the early draft of this paper.


