Cancer cell-derived CD69 induced under lipid and oxygen starvation promotes ovarian cancer progression through fibronectin
Abstract
Cancer tissues generally have molecular oxygen and serum component deficiencies because of poor vascularization. Recently, we revealed that ICAM1 is strongly activated through lipophagy in ovarian clear cell carcinoma (CCC) cells in response to starvation of long-chain fatty acids and oxygen and confers resistance to apoptosis caused by these harsh conditions. CD69 is a glycoprotein that is synthesized in immune cells and is associated with their activation through cellular signaling pathways. However, the expression and function of CD69 in nonhematological cells is unclear. Here, we report that CD69 is induced in CCC cells as in ICAM1. Mass spectrometry analysis of phosphorylated peptides followed by pathway analysis revealed that CD69 augments CCC cell binding to fibronectin (FN) in association with the phosphorylation of multiple cellular signaling molecules including the focal adhesion pathway. Furthermore, CD69 synthesized in CCC cells could facilitate cell survival because the CD69–FN axis can induce epithelial–mesenchymal transition. Experiments with surgically removed tumor samples revealed that CD69 is predominantly expressed in CCC tumor cells compared with other histological subtypes of epithelial ovarian cancer. Overall, our data suggest that cancer cell-derived CD69 can contribute to CCC progression through FN.
Abbreviations
-
- ARNT
-
- arylhydrocarbon receptor nuclear translocator
-
- CCC
-
- cell surface E-cadherin
-
- ECAD
-
- E-cadherin
-
- >EMT
-
- epithelial–mesenchymal transition
-
- EOC
-
- epithelial ovarian cancer
-
- FAD
-
- focal adhesion
-
- FAK
-
- focal adhesion kinase
-
- FN
-
- fibronectin
-
- HIF
-
- hypoxia-inducible factor
-
- HP-Alb
-
- high-purity albumin
-
- ICAM-1
-
- intercellular adhesion molecule-1
-
- LCFA
-
- long-chain fatty acid
-
- MS
-
- mass spectrometry
-
- >MS/MS
-
- tandem mass spectrometry
-
- NF-κB
-
- nuclear factor-κB
-
- NS
-
- nonspecific
-
- NT
-
- nontumorous
-
- SSH
-
- serum starvation and hypoxia
-
- SSN
-
- serum starvation and normoxia
-
- TCGA
-
- The Cancer Genome Atlas
-
- TGF-β1
-
- transforming growth factor-β1
-
- TMA
-
- tissue microarray
-
- VIM
-
- vimentin
1 INTRODUCTION
Many solid tumor regions are exposed to low oxygen (O2) tension because of poor vascular density and aberrant vascular structure compared with normal tissues.1 The induction of hypoxia-inducible transcription factors followed by the activation of their target genes is a critical mechanism for the response and adaptation to severe O2 deficiency.2 In addition to limited O2 supply, blood components such as hormones, growth factors, and nutrients become less available to cancer cells under these hypoxic conditions. Thus, cancer cells must adapt to both O2 and plasma factor insufficiencies for tumor progression.
Epithelial ovarian cancer is the most lethal gynecological malignancy worldwide.3, 4 Epithelial ovarian cancer is classified into multiple histological subtypes.4 Clear cell carcinoma is common in some Asian and European countries, including Japan, and has a poor survival rate compared with other histological subtypes.5 The biology of EOC including CCC has been revealed but is not fully understood.5
Recent studies reported that an insufficient plasma lipid supply in the cooperation of hypoxia is lethal and that multiple cellular adaptation mechanisms have roles in cancer progression.6-8 We have also shown that ICAM1, which encodes ICAM-1 protein, is strongly activated by Sp1–HIF-2α interactions in CCC cells that are exposed to SSH.9, 10 We revealed that LCFAs and O2 deficiencies followed by lipophagy-driven degradation of lipid droplets causes stabilization of NF-κB binding to induce synergistic ICAM1 expression.10 ICAM-1 contributes to cell survival under SSH and tumor growth.9
We showed that multiple genes such as KLF6,9 JUN,9 and FVII11 are also synergistically activated in CCC cells with O2 depletion in response to LCFA (KLF6 and JUN)9 and cholesterol (FVII)11 insufficiency. Our cDNA microarray analysis further identified CD69 as one such gene. CD69 is a type II C-lectin that is synthesized in limited immune cells and plays roles in the immune response as a homodimer.12-14 However, there have been no reports of the expression of CD69 in nonhematological cells, including leukemia cells. Thus, in this study, we aimed to determine the role of CCC cell-derived CD69 to better comprehend the biology of ovarian cancer.
2 MATERIALS AND METHODS
2.1 Cells and culture conditions
See Data S1.
2.2 Small interfering RNA transfection
2.3 Reagents
See Data S1.
2.4 cDNA microarray analysis
We analyzed cDNA microarray data obtained in our previous studies.9
2.5 Establishment of cell lines stably introduced with shRNAs
For silencing of CD69 mRNA expression, we used the SureSilencing shRNA plasmid kit (Qiagen Sciences) designed to specifically knock down human CD69 gene expression. Transfection of CD69 shRNA expression vectors and its negative control shRNA vector was undertaken using Lipofectamine 2000 reagent (Life Technologies). Independent cell lines stably expressing shRNAs were selected using G418 as a selection reagent.
2.6 Real-time RT-PCR
CD69 and 18S ribosomal RNA transcript levels were determined as previously described.9 See Data S1 for primers and probes used.
2.7 Western blot analysis
Western blotting was carried out as previously described.9 See Data S1 for primary Abs used. Other Abs were previously described.10
2.8 Chromatin immunoprecipitation
2.9 Cell viability assay
Cell viability was evaluated by MTS assay using the CellTiter96 kit (Promega) and Countess automated cell counter (Invitrogen) according to the manufacturer's instructions.
2.10 Transwell assays
The motility of cancer cells was analyzed by Transwell assay using 24-well Boyden chambers.15 Briefly, for migration assays, cells suspended in serum-free medium were added to the upper chamber. The lower chamber was filled with 600 μL serum-free medium containing FN (10 μg/mL). After 48 h of incubation, cells on the lower side of the membrane were fixed and stained with Giemsa. The numbers of cells on a single membrane were counted in eight randomly chosen fields using a light microscope (×10).
2.11 Fibronectin coating of culture dish and cell adhesion assay
Culture plates were covered with human FN (10 μg/mL) and incubated at 37°C for 1 h. Plates were then washed twice with PBS. The culture plate was then treated with 100 μL 1 mg/mL BSA/PBS at 37°C for 1 h and then washed with PBS. Cultured cells were dissociated using Accutase (12679-54; Nacalai Tesque). Cells treated with Ab or control IgG were seeded into the FN-coated wells and incubated at 37°C for 1 h. Cells that had adhered to the bottom of the well were counted by MTS assays. Anti-β1-integrin Ab (P5D2, ab24963) was purchased from Abcam.
2.12 Proteomic identification of phosphorylated proteins
Phosphorylation of proteins at serine, threonine, and tyrosine residues in OVSAYO cells was determined by proteomic analysis.16, 17 Briefly, OVSAYO cell lines transfected with nonspecific or CD69-targeted shRNA were cultured under SSH conditions for 48 h. Cells were lysed and protein extracts were prepared. Peptides were purified and subjected to shotgun LC-MS/MS analysis. Data were quantified by label-free protein relative quantitation analysis using Progenesis LC-MS software (Nonlinear Dynamics).
2.13 Flow cytometry
Cells (106) were dissociated using Accutase and washed once with PBS. For detection of cell surface ECAD, cells were suspended in PBS with 3% BSA and incubated with anti-ECAD Ab (20874-1-AP; Proteintech) (2 μg/mL) and control IgG (I8104; Sigma) (2 μg/mL) for 2 h. Cells were then washed with PBS and incubated with Alexa488-conjugated secondary Ab (A-11008; Molecular Probes) for 1 h. Cells were washed once with PBS, and then resuspended in 1 mL PBS for flow cytometry using the BD FACSAria II (BD Bioscience). For CD69, experiments were carried out with slight modifications using anti-CD69 Ab (ab51862; Abcam). For β1-integrin (CD29), phycoerythrin-conjugated Ab (#555443; BD Pharmingen) and control IgG (#555749; BD Pharmingen) were used.
2.14 Immunofluorescence
For immunocytochemistry of ECAD and VIM, cells (5 × 10⁴) were seeded into 4-well chamber polystyrene vessels (#354114; Corning) and then cultured under the indicated conditions. Following experiments were carried out as previously described.10
2.15 Immunohistochemistry
Routinely processed formalin-fixed, paraffin-embedded specimens were prepared from 130 EOC patients for a TMA (Table S1) and for 77 whole-slide sections of CCC (Table S2) at Kanagawa Cancer Center Hospital.10 Immunohistochemistry was undertaken9 using anti-CD69 (#373798; Santa Cruz Biotechnology) and anti-FN (A0245; Dako) Abs. Immunoreactivity was visualized as previously described.10
2.16 Scoring of IHC and survival analysis
Acquisition of IHC images and scoring of CD69 and FN expression was carried out as previously described.10 Alternatively, evaluation of CD69 staining scoring in whole-slide sections was carried out using the H-score method.18 Kaplan–Meier analysis and multivariable analysis with the Cox regression method was undertaken as previously described.10
2.17 Animal experiments
OVISE (5 × 10⁶) cells expressing NS-shRNA or CD69-shRNA were injected into the peritoneal cavity of female NOD-SCID mice (n = 6, per group) (Charles River Laboratories Japan, Inc.). After 2 months, the mice were killed. Blood was collected into a one-tenth volume of 0.1 M sodium citrate buffer directly from the heart under general anesthesia with isoflurane. Plasma was prepared from the blood supernatant after centrifugation (3000 g for 10 min.). Orthotopic inoculation of cancer cells (3 × 10⁴ cells/injection) into mouse ovaries was carried out as previously published19 with slight modifications.
2.18 Enzyme-linked immunosorbent assay for albumin
Albumin levels in mice plasma were determined using the mouse albumin ELISA kit (Bethyl Laboratory Inc.) according to the manufacturer's protocol.
2.19 Statistical analysis
Two datasets were compared using t-tests and the Mann–Whitney U-test. P values of less than 0.05 were considered statistically significant. Statistical analysis of the comprehensive phosphopeptide analysis was undertaken as previously described.16, 17
3 RESULTS
3.1 Synergistic CD69 expression in CCC cells in response to simultaneous deprivation of O2 and LCFAs
We examined our reported cDNA microarray data9 and found that CD69 was robustly expressed in the OVSAYO cells upon exposure to SSH (Figure 1A,B). Real-time RT-PCR analysis revealed that CD69 mRNA levels in OVSAYO and OVISE cells exposed to SSH were synergistically increased compared with cells cultured under other conditions (Figure 1C). Western blot analysis revealed induction of CD69 in response to SSH at 24 and 48 h in CCC cells, along with similar induction of a hypoxia marker HIF-2α (Figure 1D).
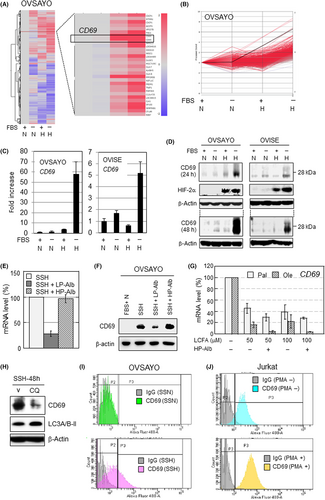
We further analyzed CD69 expression in four additional CCC cell lines (Figure S1). Two of the four lines examined showed constitutive (OVMANA) or constitutive but slightly hypoxia-driven (JHOC-7) induction of CD69. We decided to primarily use OVSAYO and OVISE cell lines in further investigations because we focused on SSH-driven CD69 expression in this study.
We previously found that LCFA insufficiency causes robust expression of ICAM1 in CCC cells under hypoxia.9 Therefore, we next examined whether the same trend can be seen in CD69 expression. Real-time RT-PCR showed that the SSH-driven CD69 expression in OVSAYO cells was canceled by the addition of low-purity albumin, which includes LCFAs (Figure 1E). In contrast, HP-Alb failed to cancel it. The same trend was observed in protein expression (Figure 1F). We next tested whether LCFAs can suppress the induction of CD69 expression, as in ICAM1.9 OVSAYO cells were cultured under SSH for 16 h in the presence or absence of LCFAs. The RT-PCR analysis revealed that CD69 expression was repressed, and that the suppression was highest with coculture with HP-Alb (Figure 1G), as in the case of ICAM1.9 This downregulation was higher in the presence of the unsaturated LCFA oleic acid compared with the saturated palmitic acid, presumably because oleic acid is a primary source of lipid droplets.8 Furthermore, we found that SSH-driven CD69 expression was canceled by chloroquine treatment (lipophagy inhibition), as in the case of ICAM1 expression10 (Figure 1H).
We tested whether transcription factors involved in SSH-driven ICAM1 expression are also responsible for CD69 expression. Unlike ICAM1,9, 10 CD69 expression was primarily dependent on HIF-1α (Figure S2A). This synergistic gene expression was also dependent on NF-κB and Sp1, but not on ARNT, as in the case of the ICAM1 gene9 (Figure S2A,B). Chromatin immunoprecipitation assay showed that HIF-1α and Sp1, but not HIF-2α, bind to the same GC-rich site within the CD69 promoter region20 (Figure S2C,D). Control experiments showed that both HIF-1α and ARNT bind to the vascular endothelial growth factor gene hypoxia response element, although HIF-2α binding was very low (Figure S2D). As expected, we found that NF-κB (RelA subunit) binds to known consensus motifs20 (Figure S2C,D). Flow cytometry revealed that CD69 was not detected in OVSAYO cells cultured under SSN (Figure 1I). As expected, we found that CD69 is increased on the surface of OVSAYO cells in response to SSH (Figure 1I), as in the case of positive control experiments with PMA-treated human T cell leukemia (Jurkat) cells (Figure 1J). Thus, these data indicate that expression of CD69 can be strongly induced and expressed on the cell surface in CCC cells in response to SSH-driven lipophagy.
3.2 CD69 is predominantly expressed in CCC tissue
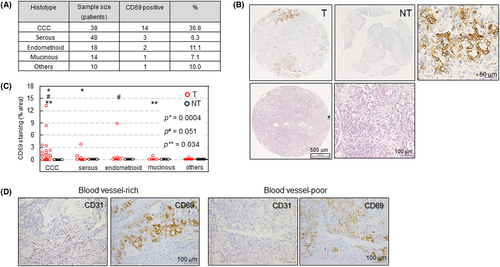
We next examined whether CD69 is expressed in EOC tissues (Table S1). Immunohistochemistry was undertaken using a TMA composed of 130 surgically removed EOC tissues (Figure 2A) and their NT counterparts including ovarian tubal tissue. We identified positive CD69 expression in approximately 36.8% (14/38) tumor (not immune) cells of CCC tissues, although other histological subtypes showed low expression (Figure 2A,B). No CD69 expression was observed in NT samples (Figure 2B). Hematoxylin and eosin staining of tissues with a typical CCC appearance is shown in Figure 2B. Quantitative analysis revealed that the proportion of CD69-positive areas was significantly higher in tumor cells of CCC tissues compared with that in other histological subtypes (Figure 2C). We found that CD69 expression was predominant within blood vessel-poor hypoxic areas (Figure 2D) because 29 out of 35 (83%) CD69-positive CCC specimens showed this expression pattern (see Figure S3 for additional cases). However, CD69 expression within blood vessel-rich areas was also possible (17%) (Figures 2D and S3), consistent with its constitutive expression in some cell lines (Figure S1). We excluded CD69 staining of potential tumor-infiltrated cells sporadically existing in tumor tissues (Figure S4), which were CD3+ T lymphocytes21, 22 (Figure S4).
3.3 CD69 does not contribute to the viability of CCC cells under SSH conditions
To understand the role of CD69, we prepared OVSAYO and OVISE cell lines that stably express either NS- or CD69-shRNAs. Western blotting showed that CD69 was robustly induced only in NS-shRNA cells in response to SSH (Figures 3A and S5A). We found that CD69-shRNA cells proliferated similarly under normoxia with FBS compared with the control NS-shRNA cells (Figures 3B and S5B). Time course MTS assays revealed that the viability of CCC cells under SSH was not affected by CD69 knockdown at least within the tested time period (Figures 3C and S5C). The same results were obtained in experiments under SSN (Figures 3C and S5C), in which CD69 was not induced. Thus, CD69 does not affect cell proliferation under SSH.

3.4 CD69 affects intracellular signaling in OVSAYO cells
CD69 is involved in the activation of signaling proteins in human immune cells, such as ERK,22, 23 AKT,21 JAK3,24 and STAT5.24 However, whether CD69 can cause cellular signaling in CCC cells is unclear. Thus, we next undertook a proteomic analysis to identify phosphorylated proteins in response to CD69 induction using OVSAYO cells. Nonspecific- and CD69-shRNA cells were cultured under SSH for 48 h. The phosphorylation levels of peptides extracted from cells at serine, threonine, and tyrosine residues were comprehensively analyzed. Shotgun LC-MS/MS analysis16, 17 revealed that 88 proteins were phosphorylated in response to CD69 expression (Figure 3D). We found that proteins, including FAK, talin, and catenin δ1, were phosphorylated at multiple residues in NS-shRNA cells compared with CD69-silenced cells (Figure 3D,E [see Table S3 for details]). We did not find increased phosphorylation of signaling proteins such as ERK, AKT, JAK3, or STAT5. Furthermore, we confirmed by western blotting that ERK and AKT phosphorylation in control cells was not changed in CD69-silenced cells (Figure 3F). Pathway analysis of the identified proteins with altered phosphorylation using the Kyoto Encyclopedia Genes and Genomes and DAVID bioinformatic database (https://david.ncifcrf.gov/home.jsp) revealed that multiple cellular signaling pathways are potentially activated in OVSAYO cells in association with CD69 expression (Table S4). We focused on the FAD pathway because this pathway ranks highest (13 genes/total 88 genes) (Table S4).
Focal adhesion kinase is a component of FAD and associates with integrins on the cell surface.25,26 Integrin activation, followed by phosphorylation of FAK at multiple tyrosine sites,25, 26 can enhance the motility and invasiveness of cancer cells through FN,27, 28 a component of the ECM. Thus, we undertook western blot analysis to determine whether FAK is phosphorylated in response to SSH-mediated CD69 induction in OVSAYO cells. Activation of FAK in response to cell surface ligand–integrin interaction is initiated by autophosphorylation of Tyr397, which allows FAK to be further phosphorylated at Tyr576 and Tyr861 sites, resulting in full kinase activity.27, 28 Western blot analysis showed that the phosphorylation at Tyr861 in control OVSAYO cells cultured under SSH was diminished by CD69 knockdown (Figure 3G, left panels), consistent with LC-MS/MS data. However, phosphorylation at Tyr397 was not affected by CD69 knockdown. In contrast, the phosphorylation at both Tyr397 and Tyr861 residues in response to ligand (FN) treatment of OVSAYO cells cultured under the same conditions27 was blocked in CD69-silenced cells (Figure 3G, right panels labeled with SSH → FN), suggesting that CD69 is required for the observed FN-dependent FAK (Tyr397) phosphorylation under SSH.
We further examined CD69-dependent phosphorylation of proteins that associate with the formation of FAD29-31 by western blotting. We found that phosphorylation of talin and catenin δ1 was dependent on CD69 in OVSAYO cells (Figure S6), consistent with the results of LC-MS/MS. Notably, the S425 residue of talin was phosphorylated in response to CD69 expression, although this phosphorylation was not detected by mass spectroscopy (Figure 3E). Collectively, data revealed a solid linkage between self-production of CD69 and phosphorylation of signaling molecules associated with FAD formation in CCC cells.
3.5 CD69 enhances CCC cell binding to FN under SSH
Fibronectin is abundant in the peritoneal environment. Indeed, cancer-associated mesothelial and stromal tissues can secrete FN.32, 33 Thus, using Transwell assays, we examined whether CCC cell migration to FN occurs in a CD69-dependent manner. OVSAYO cells stably expressing NS-shRNA exposed to SSH showed considerable migration to FN (Figure 3H). However, this motility was significantly diminished in cells without CD69 expression (Figure 3H). Motility was unaffected in both NS- and CD69-shRNA cells under SSN (Figure 3H), in which CD69 was not induced.
β1-integrin functions as a heterodimeric complex with various integrin α-subunits such as α5-integrin and is a primary ligand for FN, collagens, and laminin.25, 34 We next examined whether CCC cell–FN binding can be influenced by cell surface β1-integrin. Flow cytometry analysis revealed that the cell surface expression of β1-integrin was independent of CD69 expression and did not differ between control and CD69-silenced cells cultured under SSH (Figure 3I,J). Cell adhesion assays showed that adhesiveness was higher for control OVSAYO cells compared with CD69-silenced cells (Figure 3K). This was true for OVISE cells (Figure S5D). The increased adhesion activity was fully diminished by anti-integrin Ab treatment to the level of CD69-silenced cells treated with negative control IgG (Figure 3K). Thus, CD69-dependent adhesiveness to FN is likely mediated through β1-integrin rather than through direct CD69–FN interactions. CD69-independent adhesion ability was also diminished by this Ab treatment because the basal adhesion activity of cells also depends on β1-integrin (Figure 3K).
3.6 CD69 expression is crucial for survival of OVISE cells in the peritoneal cavity
To determine whether self-production of CD69 could function in the survival of CCC cells in vivo, we undertook xenograft tumor experiments. We used OVISE cells for this purpose because of the favorable tumorigenicity of this cell type in immune-deficient mice. Cells stably expressing shRNA were injected into the peritoneal cavity of female NOD-SCID mice to establish a model of clinical peritoneal dissemination of EOC (Figure 4A). Animal weight, ascites generation, plasma albumin level (a cachexia marker),35 and viability of cancer cells was assessed approximately 2 months after cancer cell inoculation. The volume of ascites prepared from control mice was larger than that of CD69sh mice (Figure 4B). The ELISA assays revealed that plasma albumin levels in control mice were significantly lower than those in CD69sh mice (Figure 4C).
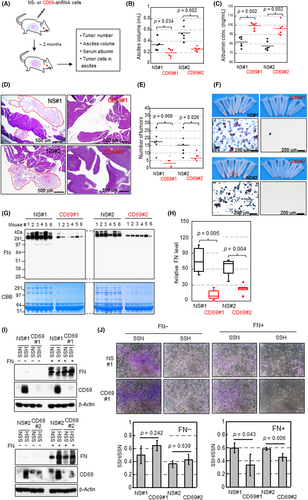
Microscopic analyses revealed that tumor nodules were primarily found in the retroperitoneal space around the pancreas (Figure 4D), spleen, and adipose tissues (data not shown) of control mice. The number of tumor nodules was higher for the control tumor than for the CD69-silenced tumor (Figure 4E). Ascites prepared from control mice but not from CD69sh mice contained a number of cancer cells, as revealed by the amount of cell pellets (Figure 4F) and cytopathological analyses (Figure 4F). Western blot analysis showed that FN levels in the supernatants of ascites in control mice were significantly higher than those prepared from CD69sh mice (Figure 4G,H).
3.7 Fibronectin confers a survival advantage to SSH-cultured cells in a CD69-dependent manner
We further tested the effect of CD69 expression on the proliferation of tumor cells orthotopically injected into ovarian bursa. As in cases of intraperitoneal xenograft, tumorigenicity was higher for control cells than CD69-silenced cells (Figure S7A), although tumor formation was impaired (Figure S7B) because the number of cells inoculated was limited36 compared with the peritoneal tumor model. Immunohistochemistry showed that, unlike CD69 and HIF-1α, orthotopic tumors were FN-positive throughout the tumor region (Figure S7C,D).
We next tested whether the viability of OVISE cells under SSH could be enhanced by FN treatment. OVISE cells were seeded onto FN-coated and noncoated dishes, and then the viability of cells cultured under SSN and SSH for 72 h was compared. Western blotting using whole-cell lysate showed that CD69 was similarly expressed in response to SSH in the presence and absence of FN (Figure 4I). We found that cell viability was higher for control cells than CD69-silenced cells cultured on FN-coated dishes, although no difference was detected for cells cultured without FN (Figure 4J). Thus, FN likely confers a survival advantage to cells in a CD69-dependent manner.
3.8 CD69 causes EMT in an FN-dependent manner
Epithelial–mesenchymal transition is a critical malignant phenotype with reduced cell–cell tight junctions37-40 and is often associated with tumor cell-derived FN.37 Although the examined CCC cells did not produce FN by themselves (Figure 4I), tumor cells were exposed to an FN-rich environment in vivo (Figures 4G,H and S7D). Furthermore, our phosphopeptide analysis showed that tight junction proteins occludin40 and ZO-240 were modified in response to CD69 expression (Table S3). Thus, we next interrogated the possibility of whether the CD69-external FN axis causes EMT in CCC cells. Western blotting showed that SSH-cultured control (NS#1) cells expressed VIM, a critical mesenchymal marker, in FN-coated dishes (Figure 5A). Vimentin was also induced in NS#2 cells. However, this was independent of FN-coating (Figure 5A), suggesting clonal diversity regarding VIM expression because parental OVISE cells can express VIM without FN treatment (data not shown). Vimentin was not induced in either CD69-silenced cells (Figure 5A). E-cadherin, a critical marker of the epithelial phenotype in EMT, was reduced with VIM induction.36-38 CD69-dependent reduction of ECAD expression was not necessarily evident by western blotting (Figure 5A). The ECAD reduction was clearer in both control and CD69-silenced cells under immunofluorescence staining with permeabilized cells (Figures 5B and S8). The same trend was observed for VIM and ECAD expression in OVSAYO cells (Figure S9A), in which CD69 expression was partially suppressed.
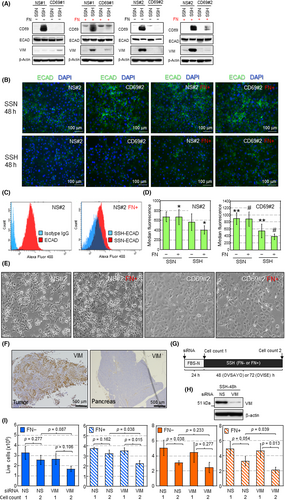
Recently, it was suggested that csECAD is decreased by disturbance of its relocalization rather than transcriptional repression to cause EMT.38 Thus, we further tested whether csECAD was decreased in SSH-cultured cells. Flow cytometry with unpermeabilized cells and an Ab recognizing the extracellular domain of ECAD revealed that csECAD levels decreased under SSH compared with SSN (Figures 5C,D and S8). Fibronectin coating facilitated the reduction of csECAD in control cells (Figure 5D). This effect was not observed in CD69-silenced cells (Figure 5D). Unlike CD69-silenced cells, NS-shRNA cells caused actual morphological changes with mesenchymal reduced cell–cell contact (Figures 5E and S8). Immunohistochemistry of OVISE tumor tissue grafted in mice showed that, unlike adjacent normal pancreatic tissue, VIM was highly expressed in tumor cells (Figure 5F). Conversely, IHC also showed that, unlike adjacent normal pancreatic cells, csECAD was not obviously identified in tumor cells (Figure S10).
Accumulating evidence has shown that VIM plays roles in EMT-driven survival of various cancer cell types under stress conditions.39, 41 Thus, we tested whether this occurs in CD69-driven EMT. Control OVISE and OVSAYO cells were treated with siRNA to silence VIM expression (Figures 5G,H and S9B) and then further cultured under SSH on FN-coated and FN noncoated dishes. We found that the viability of CCC cells cultured on FN-coated dishes under SSH (cell count 2) was significantly decreased compared with the initial cell viability (cell count 1) by VIM knockdown (Figure 5I). Collectively, these data suggest that CD69 can confer EMT phenotypes through FN.
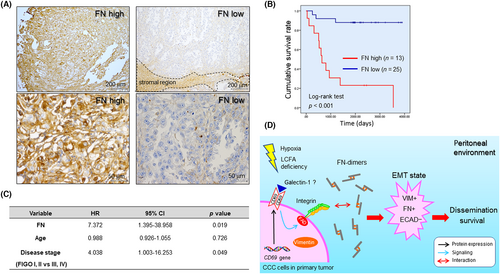
3.9 Fibronectin associated with cancer cells is a prognostic factor of CCC
Fibronectin expressed in tumor stroma and cancer cells is associated with malignancy42-44 and is correlated with the poor prognosis of ovarian serous carcinoma patients.44 Furthermore, the Human Protein Atlas (https://www.proteinatlas.org) showed that the FN transcript level in the TCGA cohort is significantly associated with the poor prognosis of many cancer types including lung, stomach, renal, and ovarian serous carcinoma. Furthermore, the Human Protein Atlas showed that CD69 transcript levels correlated with both good (breast cancer, ovarian serous carcinoma) and poor (renal cancer, pancreatic cancer) prognosis in multiple cancer types. However, the effect of CD69 and FN on the prognosis of CCC patients has not been reported. Thus, we next examined relationship between cancer cell-derived CD69, FN associated with cancer cells, and the prognosis of CCC patients. We first examined by IHC whether CD69 was correlated with the prognosis of CCC patients using a TMA (Figure S11A) and whole-tissue sections (Figure S11B, Table S2), but did not find an association between them. We next undertook IHC for FN (Figure 6A). Scoring expression levels followed by Kaplan–Meier analysis revealed that FN levels were strongly correlated with the poor prognosis of CCC (Figure 6B). Multivariable analysis showed that FN is a prognostic factor, with a risk ratio of 7.372, which is greater than that of the disease stage (Figure 6C). Collectively, the level of cancerous FN dictates the prognosis of CCC patients.
4 DISCUSSION
In this study, we provided a novel concept that CD69 is strongly expressed in epithelial, nonhematological CCC cells, as in ICAM1.10 Induced CD69 protein is responsible for FN-driven EMT, potentially contributing to the poor prognosis of CCC patients. This differs from the function of ICAM-1, which enables CCC cells to become more resistant to SSH-driven apoptosis.9, 10
Conformational changes of β1-integrin likely increased the association of CCC cells with FN because components of the FAK complex that closely associate with integrin activation are phosphorylated in relation to CD69 induction. The present study revealed that multiple signaling molecules other than ERK and AKT are phosphorylated in response to CD69 expression. However, the question arises as to how cell surface CD69 can be activated without a ligand supply from blood plasma. Epithelial ovarian cancer cells might autonomously synthesize functional ligands for CD69 (Figure 6D), as supported by a study reporting that galectin-1 can be a functional ligand for CD69, resulting in T cell differentiation.45 Indeed, we detected galectin-1 expression in CCC cells (Figure S11C). Ligand-independent signaling could also be possible, as in epidermal growth factor receptor signaling.46
The major form of EOC metastasis is peritoneal dissemination. Previous studies reported that FN levels are high in ovarian tumor stroma and ascites because cancer cells can promote the secretion of FN from NT cells in peritoneal environments.32, 33 Indeed, we showed that FN is abundant in the ascites and tumor cells of mice inoculated with CD69-expressing cells. Given that ascites FN levels were consistent with tumor burden in the peritoneal cavity, CCC cells may induce FN production from mesothelial cells through cytokines.33, 37 However, our comprehensive analysis and ELISA (data not shown) did not detect CD69-driven phosphorylation of SMAD or secretion of TGF-β1, respectively. Thus, the canonical TGF-β1–phospho-SMAD axis33, 37 is not involved in CD69–FN interaction-driven EMT.
This study first determined that tumor FN but not CD69 in CCC clinical specimens is significantly correlated with the poor prognosis of patients, although the sample size was limited. Given that FN facilitates tumor progression through multiple molecular mechanisms across many cancer types,42, 43 aggressiveness and prognosis might primarily depend on FN rather than tumor cell-derived CD69, as shown in this study. However, the relative importance of CD69 could vary between CCC cases given our OVISE tumor model.
In the present study, we could not fully exclude the possibility that CD69 detected in clinical CCC specimens was partly derived from immune cells. CD69 is known to play roles in antitumor immunity,47, 48 and indeed, CD69 expression in the TCGA cohort is significantly associated with better prognosis in many cancer types, including ovarian serous carcinoma. In contrast, CD69 expressed in T cells can cause protumoral effects, and therefore can be potentially targeted for cancer immunotherapy.14 Thus, co-existence of anti- and protumor CD69 together with tumor FN level might explain the lack of association between CD69 expression and prognosis in the current CCC patient cohort. In this case, tumor-FN rather than tumor-CD69 might be a better therapeutic target of CCC with blocking Abs33 and Ab–drug conjugate targeting extra domains of FN.42, 43
In summary, our data provide evidence as to how cancer cell-derived CD69 is expressed and functions in CCC progression. However, it is currently unclear whether this is possible in other cancer types. Further studies of CD69 synthesized in epithelial tumor cells in a larger patient cohort and multiple cancer types could lead to the generation of widely applicable diagnostic and therapeutic strategies.
ACKNOWLEDGMENTS
We thank H. Nikki March, PhD, from Edanz for editing a draft of this manuscript.
FUNDING INFORMATION
This work was supported by grants from the Japanese Ministry of Education, Culture, Sports, Science and Technology to T.K. (grant no. 25830097), and to S.K. and Y.M. (grant nos. JP16H06277 and JP22H04923).
CONFLICT OF INTEREST STATEMENT
The authors declare that they have no competing interests.
ETHICS STATEMENT
Approval of the research protocol by an institutional review board: Approved by institutional review board at Kanagawa Cancer Center Research Institute (No. 177).
Informed consent: Written consent was obtained from all patients.
Registry and registration no. of the study/trial: N/A.
Animal studies: Animal experiments were approved by institutional review board at Kanagawa Cancer Center Research Institute.


