High levels of chromosomal instability facilitate the tumor growth and sphere formation
Funding information
This work was supported by the Advanced Research Laboratory, Canon Medical Systems Corporation; JSPS KAKENHI Grant Numbers 18H02434, 22H02614; MEXT KAKENHI Grant Numbers, 18H04896, 21H05738; and grants from the Takeda Science Foundation to Kozo Tanaka, JSPS KAKENHI Grant Numbers 16H06635, 18 K15234, 20 K16295; JST ACT-X Grant Number JPMJAX2112; Uehara Memorial Foundation, Kanae Foundation for the Promotion of Medical Science, Yamaguchi Ikuei Foundation, and Gonryo Medical Foundation to Kenji Iemura. This work was also supported by the Platform for Advanced Genome Science (PAGS; JSPS KAKENHI Grant Number 16H06279)
Abstract
Most cancer cells show chromosomal instability (CIN), a condition in which chromosome missegregation occurs at high rates. Growing evidence suggests that CIN is not just a consequence of, but a driving force for, oncogenic transformation, although the relationship between CIN and tumorigenesis has not been fully elucidated. Here we found that conventional two-dimensional (2D) culture of HeLa cells, a cervical cancer-derived cell line, was a heterogenous population containing cells with different CIN levels. Although cells with high-CIN levels (high-CIN cells) grew more slowly compared with cells with low-CIN levels (low-CIN cells) in 2D monolayer culture, they formed tumors in nude mice and larger spheres in three-dimensional (3D) culture, which was more representative of the in vivo environment. The duration of mitosis was longer in high-CIN cells, reflecting their higher mitotic defects. Single-cell genome sequencing revealed that high-CIN cells exhibited a higher karyotype heterogeneity compared with low-CIN cells. Intriguingly, the karyotype heterogeneity was reduced in the spheres formed by high-CIN cells, suggesting that cells with growth advantages were selected, although genomic copy number changes specific for spheres were not identified. When we examined gene expression profiles, genes related to the K-ras signaling were upregulated, while those related to the unfolded protein response were downregulated in high-CIN cells in 3D culture compared with 2D culture, suggesting the relevance of these genes for their survival. Our data suggested that, although CIN is disadvantageous in monolayer culture, it promotes the selection of cells with growth advantages under in vivo environments, which may lead to tumorigenesis.
Abbreviations
-
- CIN
-
- chromosomal instability
-
- CNV
-
- copy number variation
-
- ER
-
- endoplasmic reticulum
-
- GSEA
-
- gene set enrichment analysis
-
- PCA
-
- principal component analysis
1 INTRODUCTION
Most cancer cells have abnormal numbers of chromosomes; this is called aneuploidy.1, 2 Aneuploidy in cancer cells is usually caused by CIN, a condition in which chromosome missegregation occurs at a high rate.3-5 Recent studies have revealed that aneuploidy and CIN are not just the consequences of oncogenic transformation, but play causative roles in tumor formation and progression.6, 7 However, how CIN promotes tumorigenesis has not yet been fully understood.
Although aneuploidy is a hallmark of cancer that is associated with tumorigenesis and poor prognosis, many studies have revealed that aneuploidy is detrimental to cellular fitness, reducing tumor growth and promoting cell death.8 This contradictory relationship between aneuploidy and cancer is known as “the aneuploidy paradox.”9 Aneuploidy suppresses cellular growth because aneuploid cells are under various stresses.10 In particular, imbalance in gene expression caused by copy number changes due to aneuploidy results in proteotoxic stress, a cellular stress elicited by unfolded and misfolded proteins.11 To reduce the frequency of unfolded and misfolded proteins in the ER, an adaptive response called the unfolded protein response is activated.12 Proliferation of aneuploid cells is also suppressed by mechanisms triggered by p53 activation.13-15 In addition to these detrimental effects of aneuploidy, CIN produces genetic heterogeneity as a result of continuous chromosome missegregation, which may facilitate the appearance of cells that acquire growth advantages.7, 16 CIN in cancer cells is therefore supposed to be in a level sufficient for both producing genetic heterogeneity and assuring clonal survival.17
CIN levels differ between cancer cell lines,18 and may be related to their tumorigenic potential. However, the diverse genetic backgrounds between cell lines hamper the clarification of the relationship between CIN level and tumorigenic potential. Here, we showed that a culture of HeLa cells, a cervical cancer-derived cell line,19 was a heterogenous population containing cells with different CIN levels. By isolating cells with high-CIN and low-CIN levels, we addressed how the CIN level was related to cell proliferation and tumorigenic potential. We compared cell growth between two-dimensional (2D) monolayer culture and three-dimensional (3D) sphere culture. Mounting evidence has suggested that the 3D culture is more representative of the in vivo environment compared with the 2D culture, offering particular benefits in cancer biology.20-23 We found that cells with high-CIN levels grew slowly in 2D culture, although they formed larger spheres in 3D culture and produced tumors in nude mice, representing the aneuploidy paradox. Using this experimental setting, we delineated how CIN facilitates the acquisition of tumorigenic potential.
2 MATERIALS AND METHODS
2.1 Cell culture and drug treatment
HeLa Kyoto, U2OS, and RPE-1 cells were grown at 37°C in a 5% CO2 atmosphere in DMEM (Nacalai Tesque), supplemented with 10% FBS. The HeLa Kyoto cell line is a popular subline of HeLa cells, a human cervical carcinoma-derived cell line, which is suitable for mitotic study due to its slow migration.24 In spheroid culture, cells were seeded to round-bottomed ultra-low attachment 96-well plates (Corning) at 1000 cells/well in renal epithelial cell growth basal medium (REBM) without FBS, and supplemented with B-27 Supplement (Thermo Fisher Scientific), N-2 Supplement (Thermo Fisher Scientific), and 10 μM ROCK inhibitor Y-27632 (FUJIFILM Wako).
2.2 MTT assay
Cells were grown in 96-well plates (As One) at 1000 cells/well for 12 h. In 3D culture conditions, cells were grown in round-bottomed ultra-low attachment 96-well plates at 1000 cells/well for 4 days. To evaluate the growth of different clones, cells were cultured for 0–4 days. To examine their sensitivity to Raf kinase inhibitor V (Merck), MEK inhibitor I (Merck), tunicamycin (Cayman Chemical), and toyocamycin (Cayman Chemical), cells were treated with these drugs at different concentrations for 48 h in 2D culture and for 10 days in 3D culture. Then cells were incubated with 0.5 mg/mL MTT (Nacalai Tesque) for 4 h, followed by incubation with 5% SDS in 5 mM HCl for 12 h. Absorbances at 550 and 690 nm were measured using SpectraMax® M2e (Molecular Devices).
2.3 Live cell imaging
Cells were grown in glass chambers (Thermo Fisher Scientific). At 1 h before imaging, the medium was changed to pre-warmed Leibovitz's L-15 medium (Thermo Fisher Scientific) supplemented with 20% FBS and 20 mM HEPES, pH 7.0. In 3D culture conditions, spheroid cultured cells were dropped into a 3.5-cm glass-bottomed dish (MatTek Corporation) with REBM supplemented with B-27 Supplement, N-2 supplement, and 10 μM ROCK inhibitor Y-27632, and covered with mineral oil (Merck). The dish was coated with 0.5% poly(2-hydroxyethyl methacrylate) (Merck) in 95% ethanol before cell seeding for 24 h. Cells were treated with SiR-DNA (Spirochrome) for 6 h before imaging. Recordings were made at 37°C, as described previously.25-29 Z-series of three sections in 3-μm increments were captured every 3 min. Image stacks were projected. Images were collected with an Olympus IX-71 inverted microscope controlled by DeltaVision softWoRx (Cytiva) using a ×20 0.75 NA UPlanSApo objective lens (Olympus). All cells were tracked using the ImageJ program with the plug-in TrackMate.30
2.4 Mouse xenograft model
In total, 5 × 10⁶ HeLa cells were suspended with PBS, and were injected subcutaneously into flanks of 12-week-old athymic nude mice (BALB/cAJcl-Foxn1nu; CREA Japan). Before injection, mice were anesthetized with isoflurane (Escain; Pfizer). Tumor size was measured every week using digital calipers. Tumor volumes were calculated using the formula v = width2 × length/2.
2.5 Genome sequence analysis
Bulk genomic DNA from HeLa and RPE-1 cells were isolated using the QIAamp DNA Mini Kit (QIAGEN). Library preparation was performed using the Tru DNA Nano Library Prep Kit (Illumina). The quality of tagmented DNA was checked using a 2100 Bioanalyzer (Agilent Technologies). Whole genome sequencing was performed using the NovaSeq6000 system (Illumina). Sequential reads were acquired with paired ends of 150 bp and a depth of 4× to 10×. The short reads were processed with cutadapt version 1.1731 to trim adapter sequences detected by FastQC software (available at https://www.bioinformatics.babraham.ac.uk/projects/fastqc/). Then, reads were mapped to the human reference genome (UCSC hg19) without the Y chromosome using BWA version 0.7.17-r1188,32 and were merged using SAMTools version 1.9.33 The chromosome copy number was estimated using HMMcopy version 1.34.034 in 100 kb bins. The HMM copy utils version 0.1.1 was utilized to generate read counts, GC-contents, and mappability profiles. The mappability profile was based on the alignability track (wgEncodeCrgMapabilityAlign50mer) obtained from the UCSC Genome Browser.
2.6 Single-cell genome sequence analysis
2.7 RNA sequence analysis
Total RNA was isolated using the RNeasy Mini Kit (QIAGEN). Library construction and RNA-seq were performed using the Illumina sequencing platform (Rhelixa). The read counts were quantified using RaNa-Seq, which is a cloud platform for quantifying FASTQ files in RNA-seq data.37 Heatmap analysis, PCA, and preranked GSEA were performed using iDEP.94.38
2.8 Statistical analysis
The Mann–Whitney U-test was used for comparison of dispersion. For comparisons between all groups, the Kruskal–Wallis test was used with the Steel–Dwass post hoc test. For comparisons between single groups and multigroups showing normal distribution, Dunnett's post hoc test was used after a one-way ANOVA test. Repeated measures ANOVA was used for comparison of repeated observations. Bonferroni correction was used for comparison of multiple samples in repeated measures ANOVA. All statistical analyses were performed using EZR,39 which is a graphical user interface for R (R Core Team, R: A language and environment for statistical computing, https://www.R-project.org/, [2018]). More precisely, it is a modified version of R commander designed to add statistical functions frequently used in biostatistics. Samples for analysis in each data set were acquired in the same experiment, and all samples were calculated at the same time for each data set.
3 RESULTS
3.1 2D culture of HeLa cells contains clones with different CIN levels
By observing HeLa cells in conventional 2D culture, we noticed that the length of the cell division cycle differed considerably from cell to cell. When we tracked individual cells for 75 h in live cell imaging, we found that, whereas some cells divided and proliferated rapidly, some cells did so slowly (Figure 1A). The number of cell division ranged from 0 to 5 during the period (Figure 1B). Notably, 30% of cells did not divide during the 75-h observation. These data suggested that the HeLa cell culture comprised heterogenous cell populations in terms of their proliferation potential.
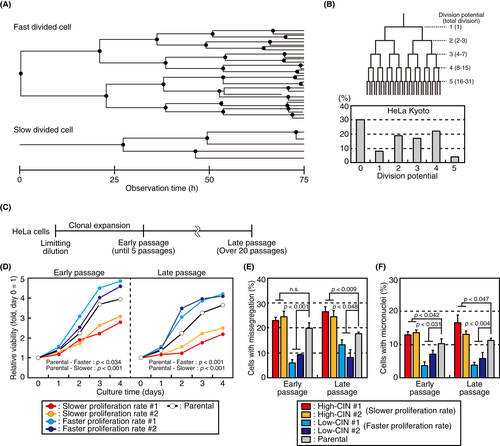
To explore the underlying cellular property that causes different proliferation potential, we isolated single cells from a HeLa cell culture and evaluated their growth using the MTT assay (Figure 1C). As expected, growth rate of isolated clones differed considerably: some cell clones grew faster, while others grew more slowly compared with parental cells (Figure 1D). Then we verified whether the different proliferation levels between cell clones were maintained through passages. As shown in Figure 1D, clones that grew faster compared with the parental cells in early passage (faster growing rate #1, 2) also grew faster after more than 20 passages. Conversely, clones that grew more slowly in the early passage (slower growing rate #1, 2) grew more slowly even in the late passage, indicating that proliferation potential is maintained through passages.
As HeLa cells are a cervical cancer-derived cell line that exhibits CIN,18 we explored the possibility that the heterogeneity of proliferation potential between cell clones was related to the difference in CIN levels. We picked up two clones each that showed faster or slower growth compared with the parental cells (faster/slower growing rate #1, 2; Figure 1D). Then we examined the percentage of chromosome missegregation in mitotic cells as well as the percentage of micronuclei-containing cells among interphase cells as indices of CIN. Intriguingly, slow-growing cells showed higher rates of chromosome missegregation and micronuclei formation compared with the parental cells, whereas fast-growing cells showed lower rates (Figure 1E,F), suggesting that the proliferation potential of individual cells was inversely correlated with their CIN levels. Therefore, we renamed faster growing rate #1, 2 and slower growing rate #1, 2 as low-CIN cells #1, 2 and high-CIN cells #1, #2, respectively. We further observed the mitotic progression of these cells in live cell imaging. As shown in Figure S1A,B, high-CIN cells took longer to progress through prometaphase and metaphase compared with low-CIN and the parental cells, irrespective of chromosome missegregation, implicating that mitotic defects underlie their slow growth. Some cells showed multipolar division, a kind of chromosome missegregation, in which we could not discriminate prometaphase and metaphase. Collectively, we found that the HeLa cell culture contained cells with different CIN levels that were characterized by different proliferation potentials.
To examine whether the inverse relationship between the CIN levels and the proliferation rates was a specific phenomenon observed only in HeLa cells, we isolated clones of U2OS cells, an osteosarcoma-derived cell line, and compared the CIN levels and proliferation rates. As shown in Figure S1C,D, there was a tendency that U2OS cell clones with higher micronuclei formation rates proliferated more slowly compared with the clones with lower micronuclei formation rates, suggesting that the inverse relationship between the CIN levels and the proliferation rates was also seen in other cell lines.
3.2 High-CIN cells exhibit higher ability to form tumors and spheres compared with low-CIN cells
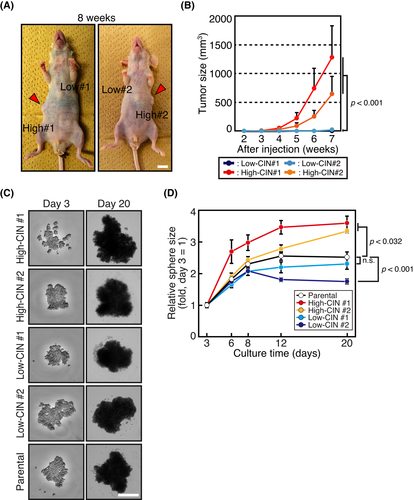
Next, we tested how CIN levels affected tumorigenic potential. First, we examined tumor formation in a xenograft model. In contrast with the growth in 2D culture, high-CIN cells formed tumors in nude mice, while low-CIN cells did not form discernible tumors (Figure 2A,B), suggesting that a high-CIN level increases tumorigenic potential. Next, we studied sphere formation of low-CIN and high-CIN cells in 3D culture under non-adherent serum-free conditions. This is a commonly used in vitro method that is more representative of the in vivo environment and enriches subpopulations with stem cell properties.20, 21, 40, 41 As shown in Figure 2C,D, high-CIN cells formed larger spheres, and low-CIN cells formed smaller spheres compared with the parental cells, corroborating the idea that high-CIN cells had a higher tumorigenic potential compared with low-CIN cells. High-CIN cells showed a higher rate of chromosome missegregation (Figure S2A) and took longer to progress through prometaphase and metaphase compared with low-CIN cells in 3D culture (Figure S2B), showing that cells maintained their CIN levels in 3D culture.
3.3 High-CIN cells have a higher karyotype heterogeneity, which is reduced upon sphere formation
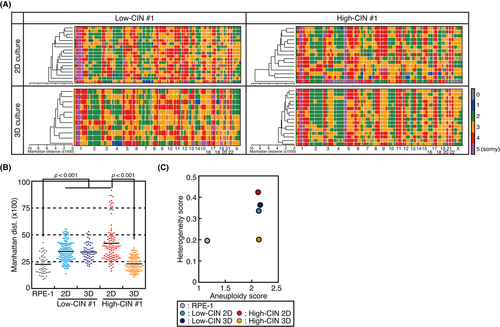
We determined the CNV of low-CIN and high-CIN cells in 2D and 3D culture, searching for characteristic changes corresponding to different CIN levels and culture conditions. As shown in Figure S3A, HeLa cells are a near-triploid cell line that exhibits extensive aneuploidy, including not only whole chromosome or arm level alterations, but also focal CNVs, as reported previously.19 In contrast, RPE-1 cells, a non-transformed diploid cell line, did not show CNVs other than the previously reported gain of the long arm of chromosome 10.42 Unexpectedly, CNVs of the individual clones in 2D and 3D culture exhibited a high similarity, and CNVs specific for 3D culture were not found (Figure S3A). Furthermore, clustering analysis showed that the cells were not clustered by CIN level, but similarity was seen between low-CIN #1 and high-CIN #1, and also between low-CIN #2 and high-CIN #2 (Figure S3A). Therefore, we could not find CNVs specific for high-CIN cells (Figure S3A). These data suggested that differences in CIN levels and culture conditions did not correspond to particular CNVs in our experimental settings.
To reveal the heterogeneity of low-CIN and high-CIN cells in 2D and 3D culture, we performed single-cell genome sequencing for low-CIN #1 and high-CIN #1 cells, and determined the CNVs at the single-cell level. In 2D culture, high-CIN cells showed higher CNV differences between cells, in which a highly aneuploid cell was included that was nullisomy for several chromosomal regions (Figure 3A). CNV differences were demonstrated by Manhattan distance,43 which represented cumulative copy number differences between cells (Figure 3A,B). As a reference, the Manhattan distance of RPE-1 cells was lower compared with that of HeLa cells (Figure 3B).18 Intriguingly, Manhattan distance was reduced in sphere culture in high-CIN cells, whereas it did not change in low-CIN cells (Figure 3A,B). This could be interpreted as showing that a cell population with a growth advantage in sphere culture condition was selected in high-CIN cells, whereas this type of cell did not exist in low-CIN cells. To reveal karyotype heterogeneity, we evaluated heterogeneity score, which represents the degree of chromosomal variety, as well as aneuploidy score, which represents the severity of numerical aneuploidy.36 Aneuploidy score was comparable between low-CIN and high-CIN cells, irrespective of the culture conditions (Figure 3C). This was probably because ploidy status was predicted based on focal copy number changes and was consistent with the similarity of the genomic structures between low-CIN #1 and high-CIN #1 cells (Figure S3A). In contrast, heterogeneity score was higher in high-CIN cells in 2D culture compared with low-CIN cells. In line with the data shown in Figure 3B, the heterogeneity score of high-CIN cells was reduced in 3D culture to a level comparable with that of RPE-1 cells, whereas it was not reduced in low-CIN cells (Figure 3C). We further compared CNVs between bulk genome and scrambled single-cell genome sequencing data. As shown in Figure S3B, the scrambled single-cell genome faithfully recapitulated the bulk genome, obscuring the difference in the CIN levels. However, when we compared the standard deviation (SD) of copy numbers, it was larger in high-CIN cells compared with low-CIN cells in 2D culture, while it was reduced in high-CIN cells in 3D culture (Figure S3B), confirming the results in Figure 3B,C. Overall, these data suggested that CIN levels corresponded to karyotype heterogeneity in 2D culture, but cells with growth advantages were selected from the heterogenous population in high-CIN cells in 3D culture.
3.4 K-ras signaling pathway upregulation and unfolded protein response downregulation occur in high-CIN cells upon transition from 2D to 3D culture
To explore the changes in gene expression depending on the CIN levels and culture conditions, we examined the gene expression profiles in low-CIN and high-CIN cells under 2D or 3D culture using RNA sequencing. Cluster analysis showed that the gene expression profiles were clearly distinguished between 2D and 3D cultures (Figure S4A). In addition, similarities in the gene expression profiles were seen between low-CIN #1 and high-CIN #1, as well as between low-CIN #2 and high-CIN #2, consistent with the genome sequencing data (Figure S4A). In the PCA, cells in 2D and 3D cultures were separated by the first principal component that was characterized by the cell cycle and that may reflect the difference in cell growth conditions with or without serum (Figure S4B). The second principal component separated low-CIN #1 and high-CIN #1 from low-CIN #2 and high-CIN #2, as in the CNV analysis (Figure S4B). In contrast, low-CIN and high-CIN cells were separated by the third principal component, which was characterized by the immune response and response to cytokines, in combination with the first principal component (Figure S4B), suggesting that low-CIN and high-CIN cells could be characterized by cellular response to various stimuli.
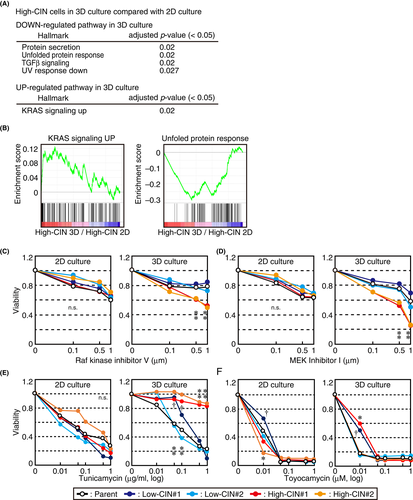
Next, we performed GSEA to analyze gene expression changes due to different CIN levels and culture conditions. As shown in Figure S4C, genes related to cell proliferation, categorized as K-ras and IL6 JAK-STAT3 signaling genes, were downregulated in high-CIN cells in 2D culture, probably reflecting reduced cellular fitness. In 3D culture, these terms were not enriched in high-CIN cells compared with low-CIN cells, although genes categorized as MYC targets, E2F targets, and G2/M checkpoint were enriched and were also related to cell proliferation. When gene expression was compared in low-CIN cells between 2D and 3D cultures, genes related to cell proliferation were downregulated in 3D culture, supposedly due to reduced cell growth in the 3D culture conditions without serum (Figure S4D). No terms were enriched for genes upregulated in low-CIN cells under 3D culture. Notably, we found that genes related to K-ras signaling were upregulated in high-CIN cells in 3D culture compared with 2D culture (Figure 4A,B). As the K-ras signaling pathway is a widely known hallmark of cancer,44 these results implied that cells acquiring oncogenic potential were selected for sphere formation. In addition, genes related to the unfolded protein response were downregulated in high-CIN cells in 3D culture (Figure 4A,B) and were not seen in low-CIN cells (Figure S4D). To validate the requirement of K-ras signaling in sphere growth, we examined cell viability in the presence of inhibitors for Raf and MEK kinases, which were MAP kinase kinase kinase and MAP kinase kinase, respectively, that act downstream of K-ras.45 High-CIN cells in 3D culture were particularly sensitive to these inhibitors compared with low-CIN cells in 2D and 3D culture and high-CIN cells in 2D culture (Figure 4C,D), indicating that K-ras signaling is especially required for the viability of spheres formed by high-CIN cells. To evaluate the role of the unfolded protein response in cell viability, we treated cells with tunicamycin, which induced the unfolded protein response by accumulating unfolded proteins through the disturbance of ER homeostasis, or toyocamycin, which suppressed the unfolded protein response by inhibiting IRE1, an ER stress sensor. Tunicamycin reduced the viability of cells in 3D cultures for low-CIN cells but not high-CIN cells, whereas it reduced the viability of both low-CIN and high-CIN cells in 2D culture (Figure 4E), suggesting that high-CIN cells forming spheres were resistant to ER stress. Conversely, toyocamycin reduced the viability of both low-CIN and high-CIN cells in 2D and 3D cultures (Figure 4F), suggesting that the unfolded protein response was required for cell viability, irrespective of the CIN levels and culture conditions. In summary, these data suggested that a population of high-CIN cells that acquired upregulation of K-ras signaling and resistance to ER stress was selected in 3D culture.
4 DISCUSSION
Here we report that high-CIN HeLa cells form tumors in nude mice and larger spheres in 3D culture compared with low-CIN cells, although high-CIN cells grew more slowly in 2D culture. Single-cell genome sequence analysis showed that high-CIN cells had a higher genetic heterogeneity in 2D culture, which was reduced in 3D culture. Our data suggested that CIN is detrimental for cell growth in monolayer culture conditions, but facilitated the acquisition of growth advantages under in vivo environments through increases in genetic heterogeneity (Figure 5). This is in line with the idea that genetic heterogeneity underlies the role of CIN in tumorigenesis and provides an explanation for the aneuploidy paradox.7, 9, 16
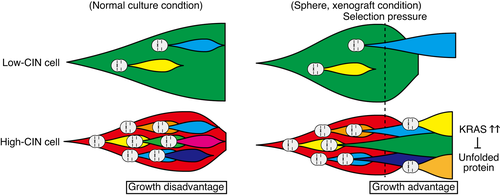
Our data showed that genetic heterogeneity in HeLa cells also led to differences in the CIN level, which enabled us to assess the effect of the CIN level on the common background. The effect of the CIN level was previously addressed by experimentally changing the level of the spindle assembly checkpoint.46 In contrast, we utilized the CIN acquired intrinsically in cancer cells, which allowed us to evaluate the effect of CIN under more physiological conditions. The CIN level was inversely correlated with the growth rate in 2D cultures, probably reflecting the mitotic defects in CIN cells, and was represented by the increase in mitotic duration in high-CIN cells. It is interesting that the CIN levels in isolated clones were maintained through passages, even though differences in CIN levels supposedly arose during the culture of these clones. We assumed that the CIN levels of the descendant cells diverged from their original levels within a certain range during passages. Why do fast-growing low-CIN cells not dominate over slow-growing high-CIN cells during the maintenance of the culture? We suppose that even if high-CIN cells are outcompeted by low-CIN cells, the loss is compensated by other high-CIN populations newly produced by chromosome missegregation.
In our experiment, we could not detect the specific CNVs that could discriminate low-CIN and high-CIN cells. It is known that gains or losses of particular chromosomes are frequently seen in certain types of tumors, suggesting that these CNVs conferred tumorigenic potential to the cells.47 Characteristic karyotypic changes in tumors were also reported when CIN was experimentally induced in non-transformed cells.48, 49 As numerous copy number changes originally existed in HeLa cells,19 CNVs in shorter genomic regions under the detection level in our analysis (<100 kb) may be responsible for the differences in the CIN level. It is also formally possible that some epigenetic changes underlie the differences in the CIN level.
Heterogeneity of CNVs was reduced in high-CIN cells in sphere cultures, although CNVs did not significantly change at a population level. As the CIN level did not change in sphere cultures, cells with growth advantages were supposedly selected continuously in high-CIN cells, resulting in the reduction of heterogeneity. Recent studies have also demonstrated that CIN accelerates the evolution of resistant cells under anticancer drug treatment by increasing karyotype heterogeneity.50, 51 In our analysis, the genetic changes selected in high-CIN cells under sphere culture were not detected, which may also be because they were below the detection level. In contrast with high-CIN cells, CNV heterogeneity did not change in low-CIN cells, suggesting the absence of cells that acquired growth advantages. Analyzing more clones by single-cell genome sequencing is necessary to confirm that CNV heterogeneity is reduced in sphere cultures as a result of selection of cells with growth advantages. Single-cell RNA sequencing analysis will also provide further information on the gene expression profiles of the subpopulations in high-CIN cells with growth advantages in sphere cultures.
Gene expression profiles showed that K-ras signaling was upregulated in high-CIN cells in 3D culture. We also found that high-CIN cells were specifically sensitive to the inhibitors of the K-ras signaling pathway in 3D culture. K-ras signaling is a well established pathway for oncogenic transformation.52 Our data suggested that K-ras signaling pathway upregulation was related to the acquisition of tumorigenic potential in high-CIN cells. It was also suggested that inhibition of the K-ras signaling pathway can be a strategy to eradicate CIN cancer cells. Although we cannot exclude the possibility that K-ras signaling upregulation leads to reduced karyotype heterogeneity, previous reports have suggested that K-ras signaling alternatively induces CIN,53 making this possibility unlikely. In high-CIN cells under 3D culture, the expression of the unfolded protein response genes was downregulated. CIN cells are under proteotoxic stress, and depend on unfolded protein response to deal with ER stress caused by excessive amount of proteins.11 The downregulation of the unfolded protein response genes in high-CIN cells under 3D culture can be explained as they are resistant to ER stress. A recent paper reported that activating RAS and RAF mutations reduced ER stress by enhancing proteasome capacity in multiple myeloma cells.54 A similar mechanism may also function in HeLa cells and promote cell survival. Another possibility is that reduced karyotype heterogeneity in high-CIN cells under 3D culture leads to a decrease in proteotoxic stress.
Although CIN is related to tumorigenesis and tumor progression,6, 7 it can also be a target for cancer therapy. As excessive CIN is detrimental to cell survival, increasing CIN above a tolerable level is now considered an efficient way to target CIN cancer cells.5 Conversely, whether reducing CIN is effective to suppress tumor progression through reduction of genetic heterogeneity is under debate.55 Our results showing that low-CIN cells did not form tumors in nude mice and large spheres in 3D culture suggested the potential of this strategy. As our study was mainly focused on HeLa cells, further study is required to examine whether the high-CIN population promotes tumorigenesis in general. Studies focusing on the CIN level will contribute to the further elucidation of the relationship between CIN and cancer, and the development of strategies to target CIN for cancer therapy.
AUTHOR CONTRIBUTIONS
Hayato Anzawa and Kengo Kinoshita analyzed genome and RNA sequence data. Ryo Funayama and Keiko Nakayama performed single-cell genome sequencing. Runa Iwakami performed experiments using U2OS cells. Kenji Iemura performed rest of the experiments. Kenji Iemura and Kozo Tanaka wrote the manuscript. Kozo Tanaka supervised the work.
ACKNOWLEDGMENTS
The authors thank T. Hirota for HeLa Kyoto and U2OS cell lines, and H. Hochegger for the RPE-1 cell line. We also thank members of the K. Tanaka laboratory for discussions, Y. Yoshizaki for careful reading of the manuscript, and A. Harata for technical assistance. We thank M. Kikuchi and K. Kuroda for technical assistance in single-cell genome sequencing. We also acknowledge the technical support of the Biomedical Research Core of Tohoku University Graduate School of Medicine.
DISCLOSURE
The authors declare no competing financial interests. Kozo Tanaka is a current Editorial Board Member of Cancer Science.
ETHICAL STATEMENT
Approval of the research protocol by an Institutional Reviewer Board: N/A. Informed consent: N/A. Registry and the registration no. of the study/trial: N/A. Animal studies: Animal experiments were conformed to “Regulations for Animal Experiments and Related Activities at Tohoku University,” reviewed by the Institutional Laboratory Animal Care and Use Committee of Tohoku University, and approved by the President of Tohoku University (2019AcA-023).


