Analysis of microbiome in gastrointestinal stromal tumors: Looking for different players in tumorigenesis and novel therapeutic options
Abstract
Preclinical forms of gastrointestinal stromal tumor (GIST), small asymptomatic lesions, called microGIST, are detected in approximately 30% of the general population. Gastrointestinal stromal tumor driver mutation can be already detected in microGISTs, even if they do not progress into malignant cancer; these mutations are necessary, but insufficient events to foster tumor progression. Here we profiled the tissue microbiota of 60 gastrointestinal specimens in three different patient cohorts—micro, low-risk, and high-risk or metastatic GIST—exploring the compositional structure, predicted function, and microbial networks, with the aim of providing a complete overview of microbial ecology in GIST and its preclinical form. Comparing microGISTs and GISTs, both weighted and unweighted UniFrac and Bray–Curtis dissimilarities showed significant community-level separation between them and a pronounced difference in Proteobacteria, Firmicutes, and Bacteroidota was observed. Through the LEfSe tool, potential microbial biomarkers associated with a specific type of lesion were identified. In particular, GIST samples were significantly enriched in the phylum Proteobacteria compared to microGISTs. Several pathways involved in sugar metabolism were also highlighted in GISTs; this was expected as cancer usually displays high aerobic glycolysis in place of oxidative phosphorylation and rise of glucose flux to promote anabolic request. Our results highlight that specific differences do exist in the tissue microbiome community between GIST and benign lesions and that microbiome restructuration can drive the carcinogenesis process.
Abbreviations
-
- ASVs
-
- amplicon sequence variants
-
- GI
-
- gastrointestinal
-
- GIST
-
- gastrointestinal stromal tumor
-
- HR-GIST
-
- high risk gastrointestinal stromal tumor
-
- LEfSe
-
- linear discriminant analysis coupled with effect size
-
- LR-GIST
-
- low risk gastrointestinal stromal tumor
-
- MET
-
- metastatic
1 INTRODUCTION
Gastrointestinal stromal tumor is a rare soft tissue sarcoma of the GI tract arising from the interstitial cells of Cajal, with an incidence of 1–1.5 per 100,000. Preclinical forms of GIST, small (<1 cm) asymptomatic lesions, also called microGISTs, are much more common, occurring in 20%–30% of the general population.1-3 The majority of GIST patients harbor specific driver mutations in the KIT or PDGFRA genes (85%–90% of cases), or, in a smaller percentage of cases, in other genes, including NF1, BRAF/RAS, and SDH.4 Interestingly, in microGISTs, driver mutations can already be detected.1, 5 Therefore, considering that <0.1% of microGISTs progress to cancer, it is clear that these mutations are necessary, but insufficient events to foster tumor progression.1
Despite significant breakthroughs in target therapies with the development of “smart drugs,” such as imatinib and other tyrosine kinase inhibitors, drug resistance is common and remains a relevant clinical issue. The hypothesis is that the microenvironment of solid tumors continues to confound therapeutics and, in this context, growing importance is being given to the surrounding environment in which the cancer itself grows. In particular, in recent years, studies have suggested a role of the microbiota residing in the GI tract (i.e., the gut microbiota) in the development and prognosis of GIST.6-8 Most of the available information concerns the luminal or fecal microbiota (usually referred to as the gut microbiota), which is well known to consistently communicate with the host, establishing a mutualistic relationship, whose breakdown can have serious repercussions on the host health.7 More recent evidence also underlines the relevance of the tissue microbiota in promoting tumor growth and influencing therapy.9, 10 However, knowledge of complex host–microbiota interactions in cancer tissue is still limited, especially for GIST, and is completely absent for microGISTs.7, 11, 12
In light of these considerations, we profiled the microbiota of GI tissue specimens in three different patient cohorts, microGIST, LR GIST, and HR or MET GIST. Specifically, we explored compositional structure, predicted function, and microbial networks, with the aim of providing a complete overview of microbial ecology in GIST and its preclinical form.
2 MATERIALS AND METHODS
2.1 Sample collection
The main clinical characteristics of analysed patients are summarized in Table S1. Formalin-fixed, paraffin-embedded samples (n = 60) were collected from Caucasian patients at the Policlinico Universitario Fondazione Agostino Gemelli (Rome, Italy), between 2009 and 2015. The study was approved by the institutional ethics committee (Protocol n. UCSC9421/18-15338/18-ID1969). The investigated cases included 30 microGISTs, 15 LR, and 15 HR/MET GISTs. MicroGISTs were identified during investigational procedures for common symptoms; GIST risk assessment was evaluated according to the AFIP criteria.13 To reduce potential bias related to the driver mutation, we primarily selected a homogeneous cohort of GIST patients, with a KIT primary mutation. However, given the rarity of microGISTs, we also included five lesions with a PDGFRA alteration to include a larger number of cases.
2.2 Tissue microbiota profiling: 16S rRNA gene sequencing, bioinformatics, and biostatistics
Total DNA was isolated from FFPE tumor samples, using the RecoverAll Total Nucleic Acid Isolation Kit (Thermo Fisher Scientific), according to the manufacturer’s protocol. Two expert pathologists examined tissue slides to confirm the diagnosis and to ensure the inclusion of cancer tissue. To check the risk of contamination we also isolated DNA from the edges of the FFPE block as negative control (wax not containing tissue sample). The extracted DNA was then subjected to microbiota analysis. Briefly, the V3–V4 hypervariable regions of the 16S rRNA gene were amplified by using universal primer pairs with Illumina overhang adapter sequences. Polymerase chain reaction products of approximately 460 bp were purified using a magnetic bead-based clean-up system, indexed by limited-cycle PCR using Nextera technology, and additionally purified using Agencourt AMPure XP magnetic beads (Beckman Coulter). Indexed libraries were pooled at an equimolar concentration, denatured, and diluted before loading onto the MiSeq flow cell. Sequencing was carried out on an Illumina MiSeq platform using a 2 × 300 bp paired-end approach. Sequencing reads were deposited in the NCBI Sequence Read Archive (BioProject ID PRJNA748200).
Raw sequence data were first quality checked by using FastQC. The PCR primers were removed from raw reads by applying cutadapt.14 Subsequently, the retained paired-end reads were denoised into ASVs15 by applying DADA2 (version 1.10.1).16 Amplicon sequence variants were taxonomically annotated by using the QIIME217 classify-sklearn plugin and the release 138 NR 199 of the SILVA database.18 Contaminant ASVs were identified by using decontam19 and those assigned as chloroplast and mitochondria were removed from subsequent analysis. Retained ASVs were multialigned by applying MAFFT20 and the obtained multiple sequence alignment was used to build a maximum-likelihood phylogenetic tree in FastTree 2. The R packages phyloseq (1.26.1)21 and vegan (2.5-6)22 were used to measure alpha (intrasample) and beta (intersample) diversity. For this purpose, ASV counts were normalized by using rarefaction (depth values settled to 15,000). In particular, the Shannon and Simpson indices were used as measures of alpha diversity, and the Bray–Curtis and weighted UniFrac23 dissimilarity matrices were used to measure beta diversity. Statistical differences in alpha diversity indices were assessed using the KW followed by W tests.
We used PERMANOVA to infer the explained variability in beta diversity data. Prediction of metagenome metabolic pathways was carried out by using PICRUSt224 with the MetaCyc database25 as a reference. Associations between taxa/pathways and the tested conditions (i.e., microGISTs, LR, and HR/MET GISTs) were sought by applying LEfSe.26 To deal with the compositional nature of ASV counts, the data were normalized by geometric mean of pairwise ratios (GMPR)27 and DESeq2 was applied to compare abundances. Microbial networks were inferred using the NetCoMi framework.28 In particular, ASV counts were normalized by applying the mclr (modified centered log-ratio transformation) procedure and the network estimation was undertaken using SPRING, which transforms the estimated partial correlations into dissimilarities through the “signed” distance metric.29 The inferred similarities were used as edge weights.
Node clusters were inferred using the fast-greedy algorithm. For each estimated network, the hub node identification was achieved based on the degree (number of adjacent nodes), betweenness (ability of the network to connect sub-networks), closeness (a measure of how close a node is to other nodes), and Eigenvector (a node is central if the connected nodes are also central) centrality proprieties and considering the nodes with the highest centrality values. Finally, the network comparison was carried out in NetCoMi by using 1000 permutations. p-Values were corrected for multiple comparisons using the Benjamini–Hochberg method. A false discovery rate of 0.05 or less was considered as statistically significant.
3 RESULTS
Approximately 4.2 million paired-end reads (mean ± SD, 70,600 ± 16,800) were generated across all samples; following the trimming, merging, and denoising procedures approximately 59% of the initial sequences were retained. Overall, 5574 ASVs were obtained and according to the taxonomic classification, 232 chloroplast and mitochondrial sequences were identified and removed from further analysis. Thirty additional ASVs were identified as contaminants by using decontam and removed from analysis.
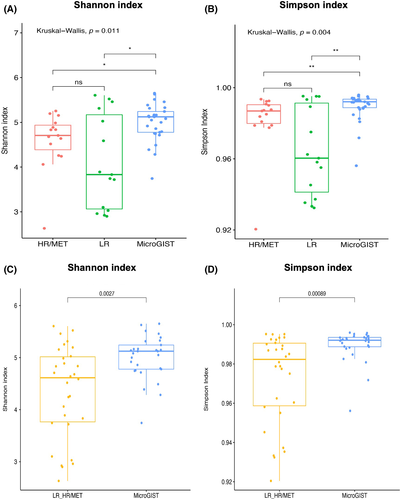
After stratifying for microGIST, LR GIST, and HR/MET GIST, alpha diversity was evaluated through the Shannon and Simpson indices, highlighting a significant difference across the three groups (KW p = 0.011 and KW p = 0.004, respectively; Figure 1A,B). For both indices, post-hoc tests showed statistically relevant differences among microGISTs and both LR and HR/MET GISTs (Shannon index: W p = 0.015, both; Simpson index: W p = 0.009 and 0.005, respectively, Figure 1A,B). In contrast, no significant differences were observed between LR and HR/MET patients for alpha diversity. We also evaluated Shannon and Simpson indices in GISTs versus microGISTs, observing significant difference (W p = 0.0027 and p = 0.0009, respectively; Figure 1C,D). Regardless of the used alpha diversity indices, no relevant differences were observed in female patients. In male patients, the Shannon and Simpson indices were significantly different between LR and microGISTs (p = 0.02) and between microGISTs and both LR (p = 0.02) and HR/MET GISTs (p = 0.03), respectively. Similarly, in GISTs (LR + HR/MET) versus microGISTs, the Simpson index was significantly different in male subjects (p = 0.034) (Figure S1).
Differences in microbiota composition (beta diversity) were evaluated using weighted and unweighted UniFrac and Bray Curtis dissimilarity metrics (Figure S2). The PERMANOVA analyses showed that tumor groups significantly explained the observed variability in all three applied metrics (p < 0.05; Table S2).
3.1 Microbiota composition of microGISTs differs from GISTs
We compared the microbiota composition of microGISTs with GISTs (LR + HR/MET). Figure S3 summarizes the relative abundance at the phylum level for the two groups (Table 1). Significant differences were found in the relative proportion of five phyla; specifically, Armatimonadota (p < 0.0001), Mixococcota (p = 0.01), Chloroflexi (p = 0.01), and Planctomycetota (p = 0.02) were over-represented, whereas Proteobacteria (p = 0.001) was under-represented in microGISTs compared to GISTs. With regard to the family rank, 24 taxa were statistically different. Among these, Nitrosomonadaceae, Sandaracinaceae, Acidobacteriae, Mycoplasmataceae, and Solirubrobacteraceae were more abundant in microGIST (all p = 0), whereas Ethanoligenenaceae, Acidithiobacillaceae, and Rikenellaceae were over-represented in GISTs (all p = 0). At the genus level, these findings were reflected in 93 genera differentially represented in microGISTs compared to GISTs. Considering those most abundant, Ralstonia (p = 0.02), Cloacibacterium (p = 0.04), and Halomonas (p = 0.03) were mostly observed in microGISTs, but Prevotella (p < 0.05) in GISTs. Data are reported in Table S3 together with the information about nondiscussed taxonomic ranks (i.e., class and order).
| MicroGISTs (%) | GISTs (%) | |
|---|---|---|
| Proteobacteria | 55.06 | 60.30 |
| Actinobacteriota | 13.26 | 13.36 |
| Firmicutes | 12.22 | 8.47 |
| Bacteroidota | 8.46 | 4.93 |
| Deinococcota | 7.92 | 11.52 |
| Chloroflexi | 0.48 | 0.15 |
| Cyanobacteria | 0.39 | 0.03 |
| Fusobacteriota | 0.29 | 0.46 |
| Verrucomicrobiota | 0.19 | 0.11 |
| Patescibacteria | 0.23 | 0.27 |
| Planctomycetota | 0.16 | 0.02 |
| Bdellovibrionota | 0.15 | 0.07 |
| Gemmatimonadota | 0.14 | 0.02 |
| Elusimicrobiota | 0.13 | 0.00 |
| Acidobacteriota | 0.37 | 0.13 |
| Fibrobacterota | 0.16 | 0.00 |
- a Phyla with a relative abundance ≥1% in at least one sample are listed.
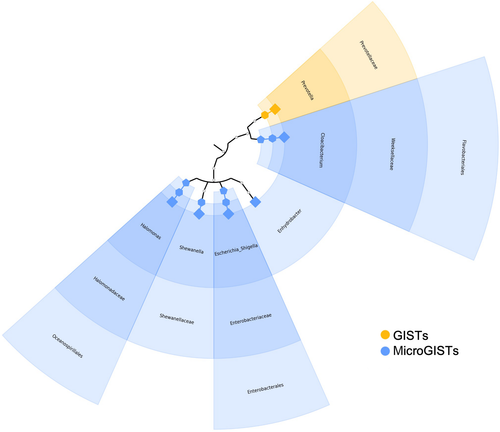
Based on the ASV distribution, the linear discriminant analysis coupled with effect size (LEfSe) tool allowed us to identify possible microbial biomarkers associated with a specific tumor subtype. The cladogram (Figure 2) summarizes the LEfSe association by representing the taxonomic relationship between significant ASVs associated with each group. In particular, an enrichment of Prevotella was observed in GISTs, whereas Halomonas, Shewanella, Escherichia, Enhydrobacter, and Cloacibacterium were enriched in microGISTs.
3.1.1 Prediction of metabolic functional profile and pathways
The metagenomic functional profile, predicted with PICRUSt2, highlighted 13 pathways that were significantly differentially represented among microGISTs and GISTs. Differentially abundant pathways identified by DESeq2 are summarized in Table S4. To identify potential functional markers of GISTs and microGISTs, LEfSe analysis was carried out (Figure 3A shows items with LDA score ≥3).
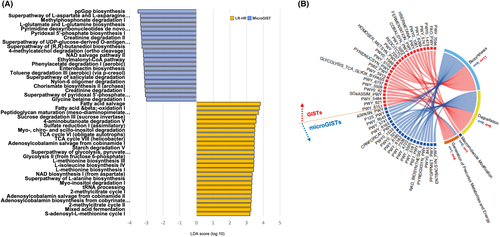
Additionally, to achieve insights into the relevant super-classes to which the pathways belonged, a Circos plot was generated (Figure 3B, Table S5). In particular, in the GISTs group, the pathways mainly belonged to biosynthesis (n = 12), even if a relevant portion was involved in degradation/utilization/assimilation (n = 9) and generation of precursor metabolites and energy (n = 5). In microGISTs, 10 pathways were involved in biosynthesis, and nine in degradation/utilization/assimilation; only one belonged to the precursor metabolites and energy pathway.
3.2 Microbiota composition of LR GISTs differs from HR/MET GISTs
We compared the microbiota composition of LR GISTs with HR/MET GISTs; Figure S4 and Table 2 summarize the relative abundance at the phylum level for each group. Significant differences were found in the proportions of Spirochaetota (p = 0) and Fusobacteriota (p < 0.001), which were significantly under-represented, and Desulfobacterota (p = 0.008) that was over-represented in HR GISTs compared to LR GISTs. Regarding the family rank, 22 taxa were statistically different. Among these Spirosomaceae, Peptostreptococcaceae, and Alicyclobacillaceae were more abundant in HR/MET GISTs (all p ≤ 0.0001), whereas Spirochaetaceae, Trueperaceae, and Kineosporiaceae were over-represented in LR GISTs (all p ≤ 0.0001). At the genus level, these findings were reflected in 57 genera differentially represented in microGISTs compared to GISTs. Considering those most abundant, the Allorhizobium–Neorhizobium–Pararhizobium–Rhizobium group (p = 0.03), Fusobacterium (p = 0.03), and Veillonella (p ≤ 0.0001) were mostly observed in LR GISTs, and Pelomonas (p = 0.03) in HR/MET GISTs. Additional data are reported in Table S6 together with the information about class, order, family, and genus.
| LR GISTs (%) | HR/MET GISTs (%) | |
|---|---|---|
| Proteobacteria | 72.90 | 47.70 |
| Firmicutes | 7.85 | 9.09 |
| Deinococcota | 6.70 | 16.34 |
| Actinobacteriota | 6.62 | 20.09 |
| Bacteroidota | 4.61 | 5.24 |
| Fusobacteriota | 0.34 | 0.58 |
| Chloroflexi | 0.28 | 0.03 |
| Patescibacteria | 0.20 | 0.34 |
| Bdellovibrionota | 0.12 | 0.03 |
| Acidobacteriota | 0.08 | 0.18 |
| Planctomycetota | 0.04 | 0.01 |
| Gemmatimonadota | 0.04 | 0.00 |
| Verrucomicrobiota | 0.02 | 0.20 |
- a Phyla with a relative abundance ≥1% in at least one sample are listed.
3.2.1 Prediction of metabolic functional profile and pathways
The metagenomic functional profile, predicted with PICRUSt2, highlighted 22 pathways that were significantly under-represented in LR compared to HR/MET GISTs. Differentially abundant pathways identified by DEseq2 are summarized in Table S7.
3.3 Microbial networks estimation
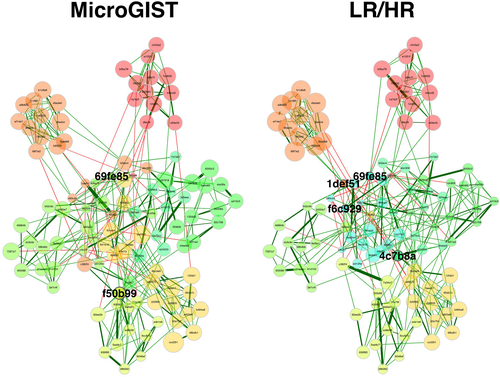
We inferred microbial networks for microGIST and GIST (LR + HR/MET) samples (Figure 4). The microGISTs network revealed the presence of two hub nodes (i.e., nodes with the highest centrality), 69fe85 and f50b99, classified as belonging to the genera Deinococcus and Halomonas, respectively. Four hubs were identified in the GISTs network according to the applied setup: 1def51 (Bradyrhizobium), 4c7b8a (Enhydrobacter), 69fe85 (Deinococcus), and f6c929 (Lawsonella). In both inferred networks, the node 69fe85 was therefore identified as a hub. Finally, according to the ARI, a measure of clustering agreement among networks,30 a similar network clustering was observed (ARI = 0.664, p ≤ 0.0001). Details are reported in Tables S8 and S9.
4 DISCUSSION
So far, the studies on microGISTs have been limited due to their rarity and consequently the difficulties in collecting a reasonable number of these asymptomatic and very small lesions. Moreover, the analyses are usually aimed at characterizing a sole genetic landscape. A key factor contributing to therapeutic failure, drug resistance, and ultimately lethal outcome of cancer is intratumor heterogeneity. In this context, genetic and epigenetic changes, in combination with tumor environment, are the driving factors behind tumor heterogeneity.
Recently, growing attention has been paid to the environment where the cancer grows.7, 31-33 Based on that, and in view of the involvement of the GI microbiota in tumor progression (e.g., gastric and colorectal cancer34), here we analyzed the tissue microbial communities in a cohort of 60 microGIST and GIST samples.
The microbiota analysis showed the lowest alpha diversity (i.e., intrasample diversity, a measure of the microbial communities’ complexity relying on both the observed ASVs and their relative abundance) in GIST patients compared to microGISTs. This aspect suggests that microGISTs retain most of the healthy tissue’s characteristics. Indeed, several reports show that alpha diversity is usually higher in normal tissues and benign lesions when compared with tumor.35-38 Moreover, higher alpha diversity is often associated with prolonged overall survival in cancer patients39-42; however, we did not observe significant differences between LR and HR/MET GISTs, which generally show shorter overall survival.43
In our cohort of patients, Proteobacteria, Actinobacteriota, Firmicutes, and Bacteroidota were the most abundant phyla, regardless of lesion type (i.e., benign or malignant). This finding is in line with reports showing that Bacteroidota and Firmicutes, followed by Actinobacteriota and Proteobacteria, are the most abundant taxa of the intestinal microbiota of a healthy adult, although composition and prevalence could vary in cancer patients.44-47 Interestingly, when we compared microGISTs and GISTs, both weighted and unweighted UniFrac and Bray–Curtis dissimilarity showed significant community-level separation between them. With regard to metabolic prediction, LEfSe highlighted a high number of pathways involved in the biosynthesis and production of precursor metabolites and energy in GISTs (17 vs. 11 in GISTs and microGISTs, respectively). Interestingly, in GISTs, a number of pathways involved in sugar metabolism (glycolysis II, sucrose degradation III, and superpathway of glycolysis) were also highlighted; this was expected as cancer usually displays high aerobic glycolysis despite oxidative phosphorylation and cancer cells raise glucose flux to promote anabolic request.48
Potentially relevant differences were observed when comparing LR and HR GISTs at both microbial community composition and metabolic levels. The phyla Fusobacteriota and Desulfobacterota were the most abundant in LR and HR GISTs, respectively. At the genus level, these differences resulted in an overrepresentation of Fusobacterium in LR GISTs, which was already observed in early stages of colorectal cancer.49, 50
Finally, we estimated the microbiome networks. Key taxa represent those playing a crucial role in the ecological structure and function of the community, irrespective of their overall abundance or prevalence. Looking at microGISTs and GISTs, the general structure of the networks was similar, however, in addition to one shared hub, the GISTs group had additional hubs, revealing that the changes driving the microbiome differences among benign lesions and cancer are probably due to variation of relative abundances of the community members. In general terms, it can be speculated that the microbial community is restructured during the transition from microGIST to GIST. This might also suggest that, even if the general microbiome communities in microGISTs and GISTs share many features, the connections between the bacteria appear to be different.
To the best of our knowledge, this is the first study to analyze microbial composition in microGISTs and GISTs. The study aimed to undertake an exploratory analysis of the tissue microbiome and gain new insights into this under-characterized topic. Given the difficulty in collecting microGISTs, the number of this type of lesion in our cohort represents one of the largest collections to date. Moreover, when considering our study group size, rarity of GIST (1–1.5 cases per 100,000) should be taken into consideration. From a molecular point of view, the cohort was homogeneous and this allowed us to limit potential biases.
Regardless of the interesting results, we are aware that the study is preliminary, and suffers from some limitations, including its retrospective nature. In addition, in the HR/MET GISTs group, a higher heterogeneity was present at the tumor site level compared with the LR GISTs group. Indeed, in 13 of 15 LR GIST cases, the primary site was the stomach, whereas in HR/MET GISTs only 6 of 15 originated from the stomach. However, this is in line with the epidemiology of GISTs; indeed, primary tumors arising from the stomach have a more favorable prognosis with a metastatic rate up to 15%, whereas those from the small intestine present a metastatic rate higher than 50%.51, 52 The tumor site, together with the clinical nature of the two patient subsets, might have contributed to the difference observed in relative abundance. With regard to the use of FFPE samples, a recent study showed that FFPE tissues provide a reliable source of germline and malignant human DNA53; therefore, it is expected that FFPE tissues also provide reliable bacterial DNA,54 and an increasing number of researchers are undertaking metagenomics analyses using FFPE samples.55, 56
In conclusion, our exploratory analysis highlights that specific differences do exist in the tissue microbiome community between GISTs and benign lesions and that microbiome restructuring could drive the carcinogenesis process. This also underlines that, in addition to the well-characterized molecular alterations contributing to GIST evolution from benign to malignant lesions, a key player could be the tumor microenvironment (i.e., the microbiome). Further studies are needed in order to deepen and better clarify its role.
DISCLOSURE
CS has received research funding (institutional) from Karyopharm, Pfizer, Inc, Deciphera Pharmaceuticals, and Bayer AG, consulting fees (advisory role) from CogentBio, Immunicum AB, Deciphera Pharmaceuticals, and Blueprint Medicines, payment for lectures from Bayer AG and Blueprint Medicines, and travel grants from PharmaMar, Pfizer, Bayer AG, Novartis, and Lilly. The other authors have no conflict of interest.
ACKNOWLEDGEMENT
Francesca Goriini and Federica Zanotti have been supported by Fondazione Cassa di Risparmio di Bologna.
ETHICS STATEMENT
The research protocol was approved by the Institutional Review Board (registration no. UCSC9421/18-15338/18-ID1969). All of the patients signed informed consent forms.
Open Research
DATA AVAILABILITY STATEMENT
Sequencing reads were deposited in the NCBI Sequence Read Archive (BioProject ID PRJNA748200).


